USDJPY Holds Near $159.16 Resistance: Is the Bullish Trend Still Intact?
USDJPY trades near $159.16 resistance. While the bullish trend persists, mixed signals from indicators and DXY strength warrant caution. Analysis covers key levels and market context.
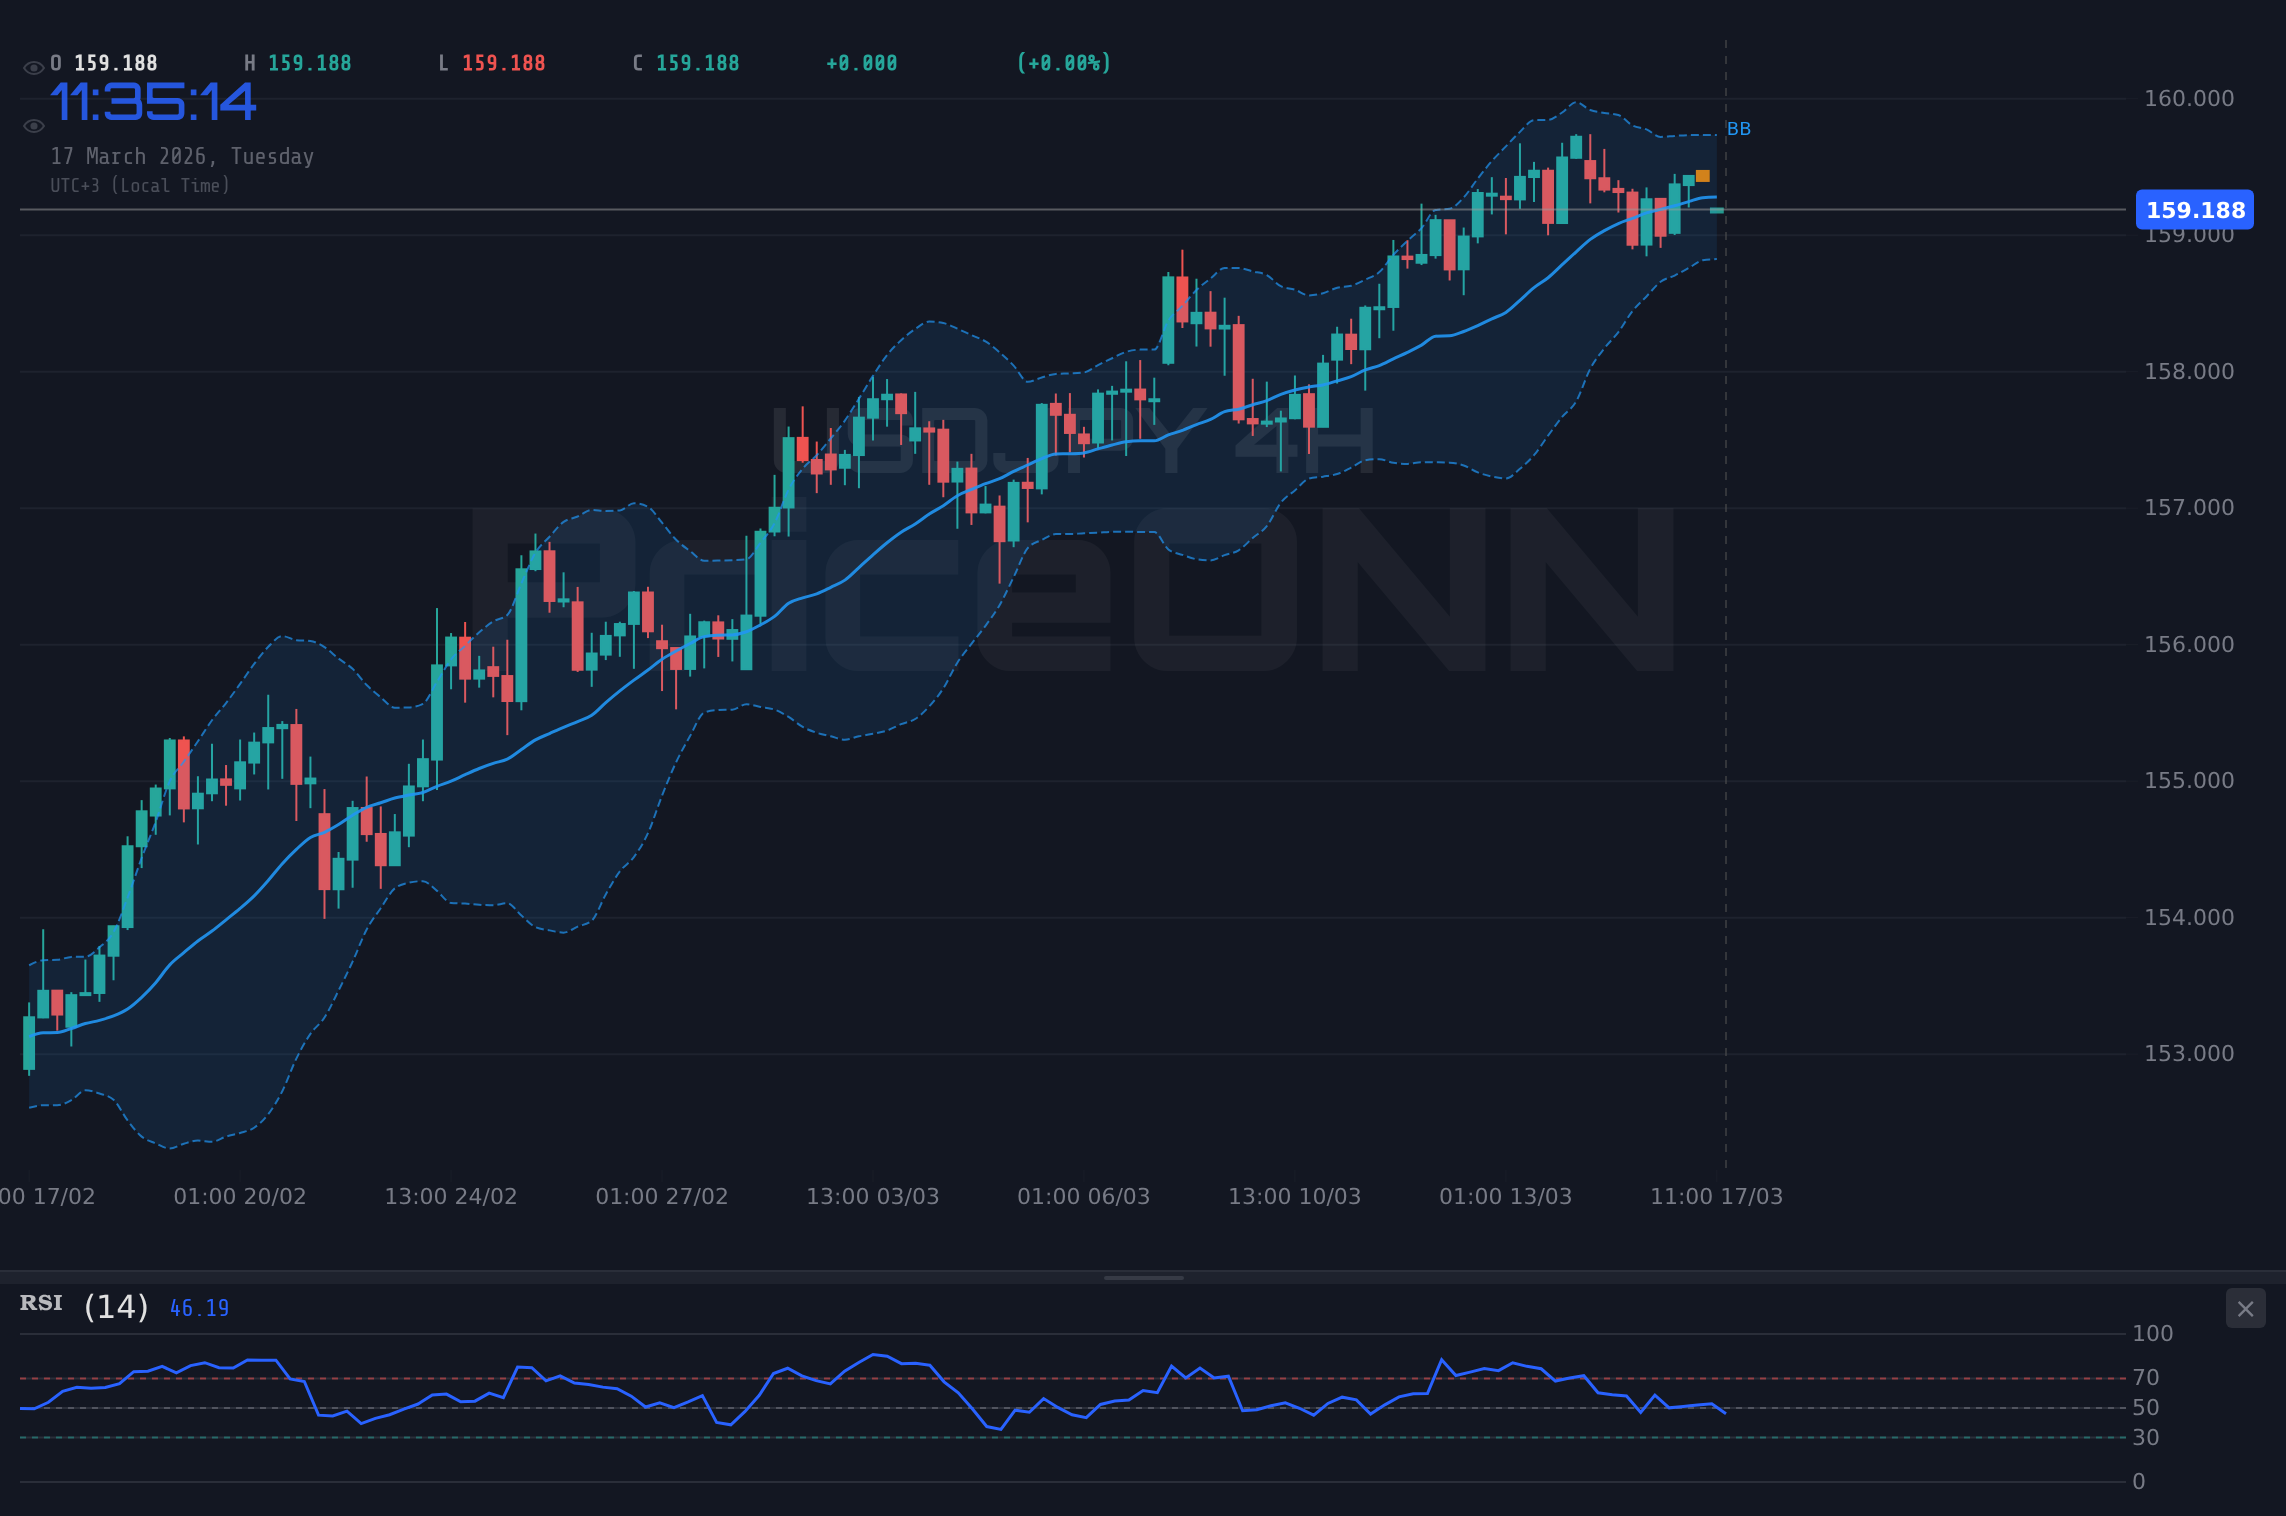
USDJPY today analysis shows the pair hovering just below the critical $159.44 resistance level, currently trading at $159.16. This tight range action has traders on edge, questioning whether the persistent bullish trend can overcome the immediate overhead pressure. Having witnessed a steady climb driven by interest rate differentials and a generally strong dollar, the pair now faces a significant test. The question on everyone's mind is whether this is a mere pause before further upside or the beginning of a more substantial pullback.
- USDJPY is testing resistance near $159.44, currently trading at $159.16.
- The daily trend remains bullish (Strength: 86%), but 1-hour and 4-hour signals show mixed momentum.
- DXY is strong at 99.62, reinforcing the bullish case for USDJPY, but RSI(14) at 46.48 on the 1H chart shows weakening upside momentum.
- Key support levels are identified at $159.29, $159.14, and $159.00, while resistance looms at $159.44, $159.59, and $159.71.
- While the long-term trend is bullish, short-term indicators suggest a potential for consolidation or a minor retracement before the next directional move.
The broader market sentiment plays a crucial role here. The US Dollar Index (DXY) is showing robust strength, currently trading at 99.62 and trending upwards on daily charts. This dollar strength, often inversely correlated with major currency pairs like EURUSD and GBPUSD, typically provides a tailwind for USDJPY. When the dollar strengthens across the board, it naturally bids up the price of USD against other currencies, including the Japanese Yen. However, the strength in DXY itself isn't a guaranteed buy signal for USDJPY; it's a significant contextual factor that needs to be weighed against specific technicals and the Bank of Japan's (BoJ) policy stance.
Navigating the Yen's Weakness: A Tale of Two Trends
On the daily chart, USDJPY presents a compelling bullish picture, with a strong uptrend (Strength: 86%) and key indicators suggesting further potential. The price sits comfortably above the middle Bollinger Band, and the MACD is printing positive momentum, indicating that the larger trend remains intact. The ADX at 22.57 confirms a moderate, albeit not overpowering, uptrend. This longer-term view suggests that dips are likely to be viewed as buying opportunities by market participants anticipating further divergence between US and Japanese monetary policy. The Stochastic Oscillator on the daily chart is in overbought territory (K=86.39, D=86.71), which can sometimes precede a consolidation or a minor pullback, but in a strong trend, this can persist for some time.
However, shifting our focus to the shorter timeframes reveals a more nuanced picture. The 1-hour chart shows a neutral trend with mixed signals. While the overall 'Buy' signal count is higher (5 vs 3), the RSI(14) at 46.48 is trending downwards, suggesting that the immediate buying pressure is waning. Furthermore, the Stochastic Oscillator (K=62.38, D=75.89) is showing a bearish crossover, hinting at potential short-term weakness. The ADX here is only 21.69, indicating a weak trend, which means price action could become choppy. This short-term divergence from the daily bullish trend is what traders are keenly watching; a break below the immediate support at $159.29 could signal a temporary pause or reversal.
The 4-hour timeframe also presents a mixed bag. Here, the trend is neutral with an equal split in signals (4 Buy, 4 Sell). The RSI(14) at 53.29 is in the neutral zone but trending upwards, while the Stochastic Oscillator (K=36.93, D=35.22) suggests a potential upward move. Yet, the MACD is showing negative momentum, and the ADX at 15.6 indicates a weak trend. This inconsistency across different timeframes underscores the current market's indecisiveness. Traders are likely waiting for a clearer signal or a catalyst to break the stalemate. The proximity to the $159.44 resistance level is a significant factor, as a failure to break through it could lead to increased selling pressure, potentially dragging the price towards the $159.00 psychological level.
The Dollar's Dominance and the Yen's Predicament
The underlying fundamental driver for USDJPY's strength remains the widening interest rate differential between the US and Japan. While the US Federal Reserve has been navigating a complex path of inflation control, the Bank of Japan has maintained its ultra-accommodative monetary policy. This policy divergence fuels carry trade strategies, where investors borrow in a low-interest-rate currency (JPY) to invest in a higher-yielding one (USD). As long as this differential persists and the Fed signals a cautious approach to rate cuts, the fundamental bias for USDJPY is likely to remain bullish. Recent news also hints at potential intervention fears; a Reuters report on March 17th mentioned traders closely watching for potential Japanese Yen intervention as USD/JPY retreated from highs near 159.40. This adds another layer of complexity, as direct intervention could temporarily disrupt the trend, regardless of underlying fundamentals.
Looking at correlated assets, the DXY's strength at 99.62 is a significant bullish factor for USDJPY. A rising dollar index typically correlates positively with USDJPY. Conversely, the S&P 500 and Nasdaq are showing signs of weakness, trading down 0.31% and 0.42% respectively. This risk-off sentiment in equities could, in theory, support safe-haven assets like the Yen. However, the USDJPY pair has shown a remarkable resilience and tendency to move higher even amidst broader market jitters, primarily driven by the overwhelming interest rate differential. This decoupling suggests that the yen's weakness is more about its own monetary policy than global risk appetite currently.
Gold prices, currently testing support near $5,000 as per market data, are also a point of interest. While gold often acts as a safe haven, its recent pullback despite geopolitical tensions, as noted by market analysis, indicates that the market's focus is heavily skewed towards the dollar's strength and rate differentials. The fact that gold is consolidating while USDJPY is near resistance suggests that capital might be flowing towards higher-yielding dollar assets rather than traditional safe havens. This dynamic reinforces the bullish narrative for USDJPY, provided key resistance levels hold.
Key Levels and What They Mean for Traders
The immediate price action around $159.16 is critical. The first line of resistance is at $159.44. A decisive close above this level, ideally on increasing volume, would confirm the continuation of the bullish trend and could open the door for a move towards the next resistance at $159.59 and potentially $159.71. On the flip side, failure to break $159.44 could see a retreat towards the first support level at $159.29. Below that, $159.14 and the psychologically significant $159.00 level become the next targets for sellers. The ADX reading of 15.6 on the 4-hour chart signifies a weak trend, implying that any move, whether up or down, might lack strong follow-through initially. Therefore, traders should be wary of false breakouts or breakdowns in this range-bound environment.
The RSI(14) on the 1-hour chart at 46.48 is particularly noteworthy. It's not yet in oversold territory, but its downward trajectory from higher levels suggests that the momentum driving the recent price action is fading. Confirmation would be needed from other indicators or price action itself. For instance, if USDJPY consolidates below $159.44 and the RSI dips below 40, it would strengthen the case for a short-term bearish move. Conversely, if the price decisively breaks above $159.44 and the RSI pushes above 55, it would validate the bullish thesis and suggest that the upward momentum is returning.
The Stochastic Oscillator on the 1-hour chart shows a bearish crossover (K=62.38, D=75.89), which is a sell signal. While not an immediate reason to short, it adds to the caution flag when USDJPY is hovering near resistance. On the 4-hour chart, the Stochastic is showing a bullish signal (K=36.93, D=35.22), highlighting the conflicting signals across timeframes. This lack of confluence makes the current price action a 'watch and wait' scenario for many. The key is to see which timeframe's signals will eventually dominate. Given the strong daily uptrend, a pullback to retest lower levels might offer a better risk-reward setup for bulls looking to join the primary trend.
Market Sentiment and the Path Forward
The current market sentiment surrounding USDJPY is one of cautious optimism for the bulls, tempered by the immediate resistance and mixed short-term indicators. The strong daily trend and supportive DXY provide a solid foundation, but the lack of clear momentum on intraday charts and the potential for intervention add layers of uncertainty. Traders are essentially balancing the powerful long-term fundamentals against the immediate technical hurdles. The market is digesting the implications of the Fed's potential path versus the BoJ's dovish stance, with the carry trade remaining a dominant theme.
The upcoming economic calendar will be crucial. While no major US or Japanese data releases are immediately scheduled to cause significant disruption, any comments from Fed officials or the BoJ could sway sentiment. For instance, if Fed speakers reiterate a hawkish stance, it could bolster the dollar and push USDJPY higher. Conversely, any hint of a shift in BoJ policy, however unlikely, would immediately put pressure on the pair. The market's reaction to the $159.44 resistance will likely set the tone for the coming days. A clean break could signal a continuation towards $160, while a rejection might lead to a retest of the $159.00 psychological barrier.
The risk of a short-term correction is elevated as USDJPY tests significant resistance near $159.44. While the long-term trend remains bullish, traders should be mindful of conflicting signals on intraday charts and the potential for profit-taking or intervention fears to trigger a move lower. Patience and a clear setup are paramount.
From a risk management perspective, waiting for a clear break of either the key resistance at $159.44 or a decisive move below support around $159.00 would be prudent. Trading within this tight range carries a higher risk of whipsaws. The ADX reading across timeframes, particularly the weak 15.6 on the 4-hour chart, supports the idea that the market is consolidating rather than trending strongly in the short term. This suggests that chasing price action here might be less rewarding than waiting for a clearer directional signal or a pullback to more favorable entry levels.
The current consolidation could present a strategic entry for bulls. If USDJPY pulls back to test the $159.00 - $159.14 support zone and holds firm, it could offer a high-probability, risk-defined entry point to rejoin the dominant daily uptrend. Confirmation would ideally come from a bounce in the DXY and stabilization of short-term technicals.
Ultimately, the narrative for USDJPY remains one of a strong fundamental tailwind battling immediate technical resistance. The interest rate differential is a powerful force, and the dollar's overall strength adds to this. However, markets rarely move in straight lines. The current price action around $159.16 suggests a period of consolidation or a minor retracement is possible before the next leg higher. Traders should focus on the key levels mentioned and wait for confirmation rather than trying to anticipate the exact turning point.
“Patience is not the ability to wait, but the ability to keep a good attitude while waiting.” – Joyce Meyer
Frequently Asked Questions: USDJPY Analysis
What happens if USDJPY breaks decisively above the $159.44 resistance level?
A confirmed break above $159.44, especially with strong volume, would likely signal the continuation of the bullish trend. This could trigger further buying, targeting the next resistance levels at $159.59 and $159.71, driven by ongoing interest rate differentials and dollar strength.
Should I buy USDJPY at current levels around $159.16, given the RSI at 46.48 and Stochastic crossover?
Buying at current levels carries risk due to the overhead resistance at $159.44 and mixed short-term indicators like the RSI and Stochastic. A more prudent approach might be to wait for a pullback to test the $159.00-$159.14 support zone, looking for a hold and confirmation before entering, which would offer a better risk-reward ratio.
Is the RSI at 46.48 on the 1-hour chart a bearish signal for USDJPY?
An RSI of 46.48 on the 1-hour chart is in the neutral zone but showing a downward trend, suggesting waning upward momentum. While not a strong bearish signal on its own, it adds to the caution when USDJPY is near resistance, indicating that the immediate buying pressure is fading.
How will the strong DXY at 99.62 affect USDJPY's potential move above $159.44?
The strong DXY at 99.62 provides a fundamental tailwind for USDJPY, increasing the probability of a successful breakout above $159.44. This correlation suggests that dollar strength is a key driver, and if DXY continues to climb, it could help USDJPY overcome the immediate resistance.
Technical Outlook Summary
| Indicator | Value | Signal | Interpretation |
|---|---|---|---|
| RSI (14) | 46.48 | Neutral | Weakening momentum on 1H, but uptrend on 1D |
| MACD Histogram | +0.16 | Bullish | Positive momentum on 1H, but negative on 4H/1D |
| Stochastic | K:62.38, D:75.89 | Bearish | Bearish crossover on 1H, bullish on 4H |
| ADX | 21.69 | Weak Trend | Moderate trend strength on 1H, weak on 4H |
| Bollinger Bands | Middle Band | Test | Price near middle band on 1H, below on 4H/1D |
Track markets in real-time
AI-powered analysis, technical indicators and real-time price data.
Join Our Telegram Channel
Breaking market news, AI analysis and trading signals instantly.
Join Channel