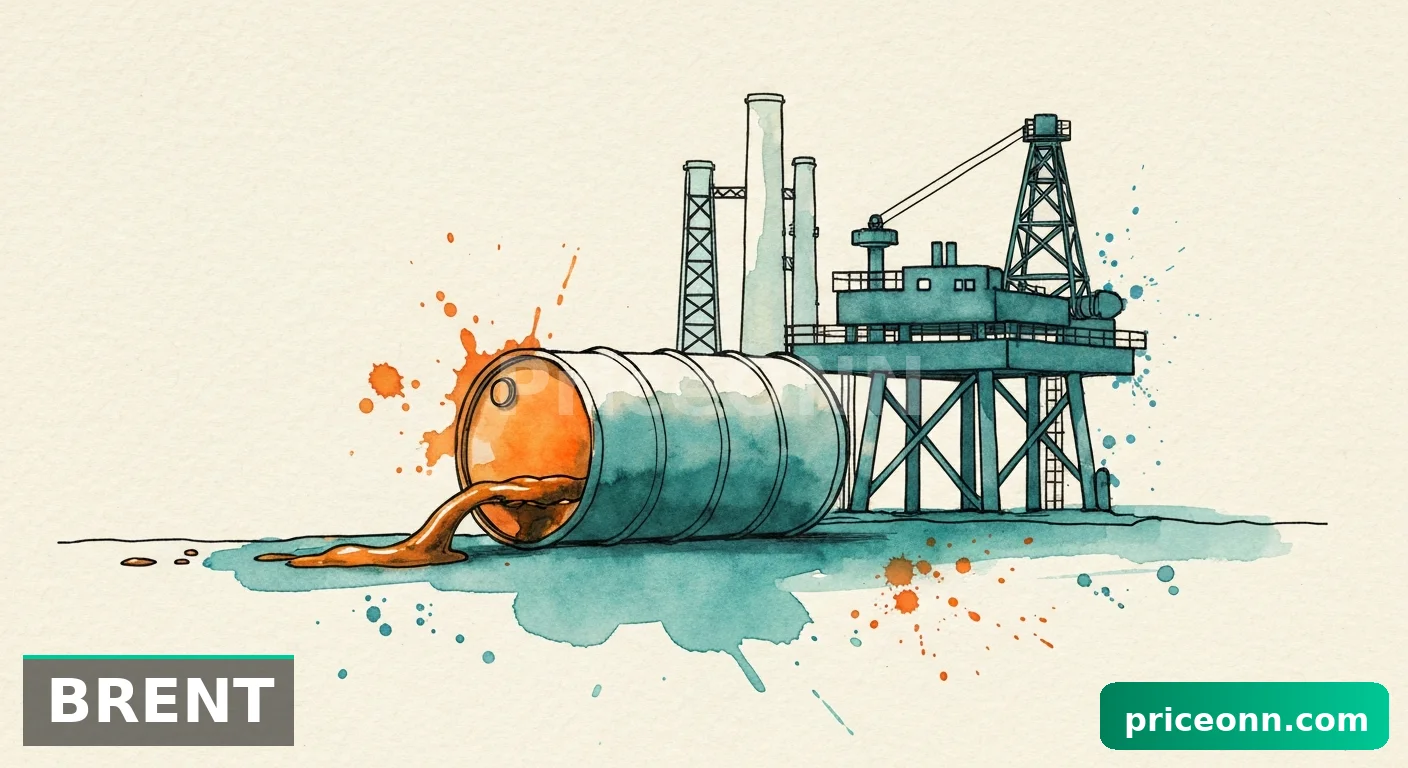
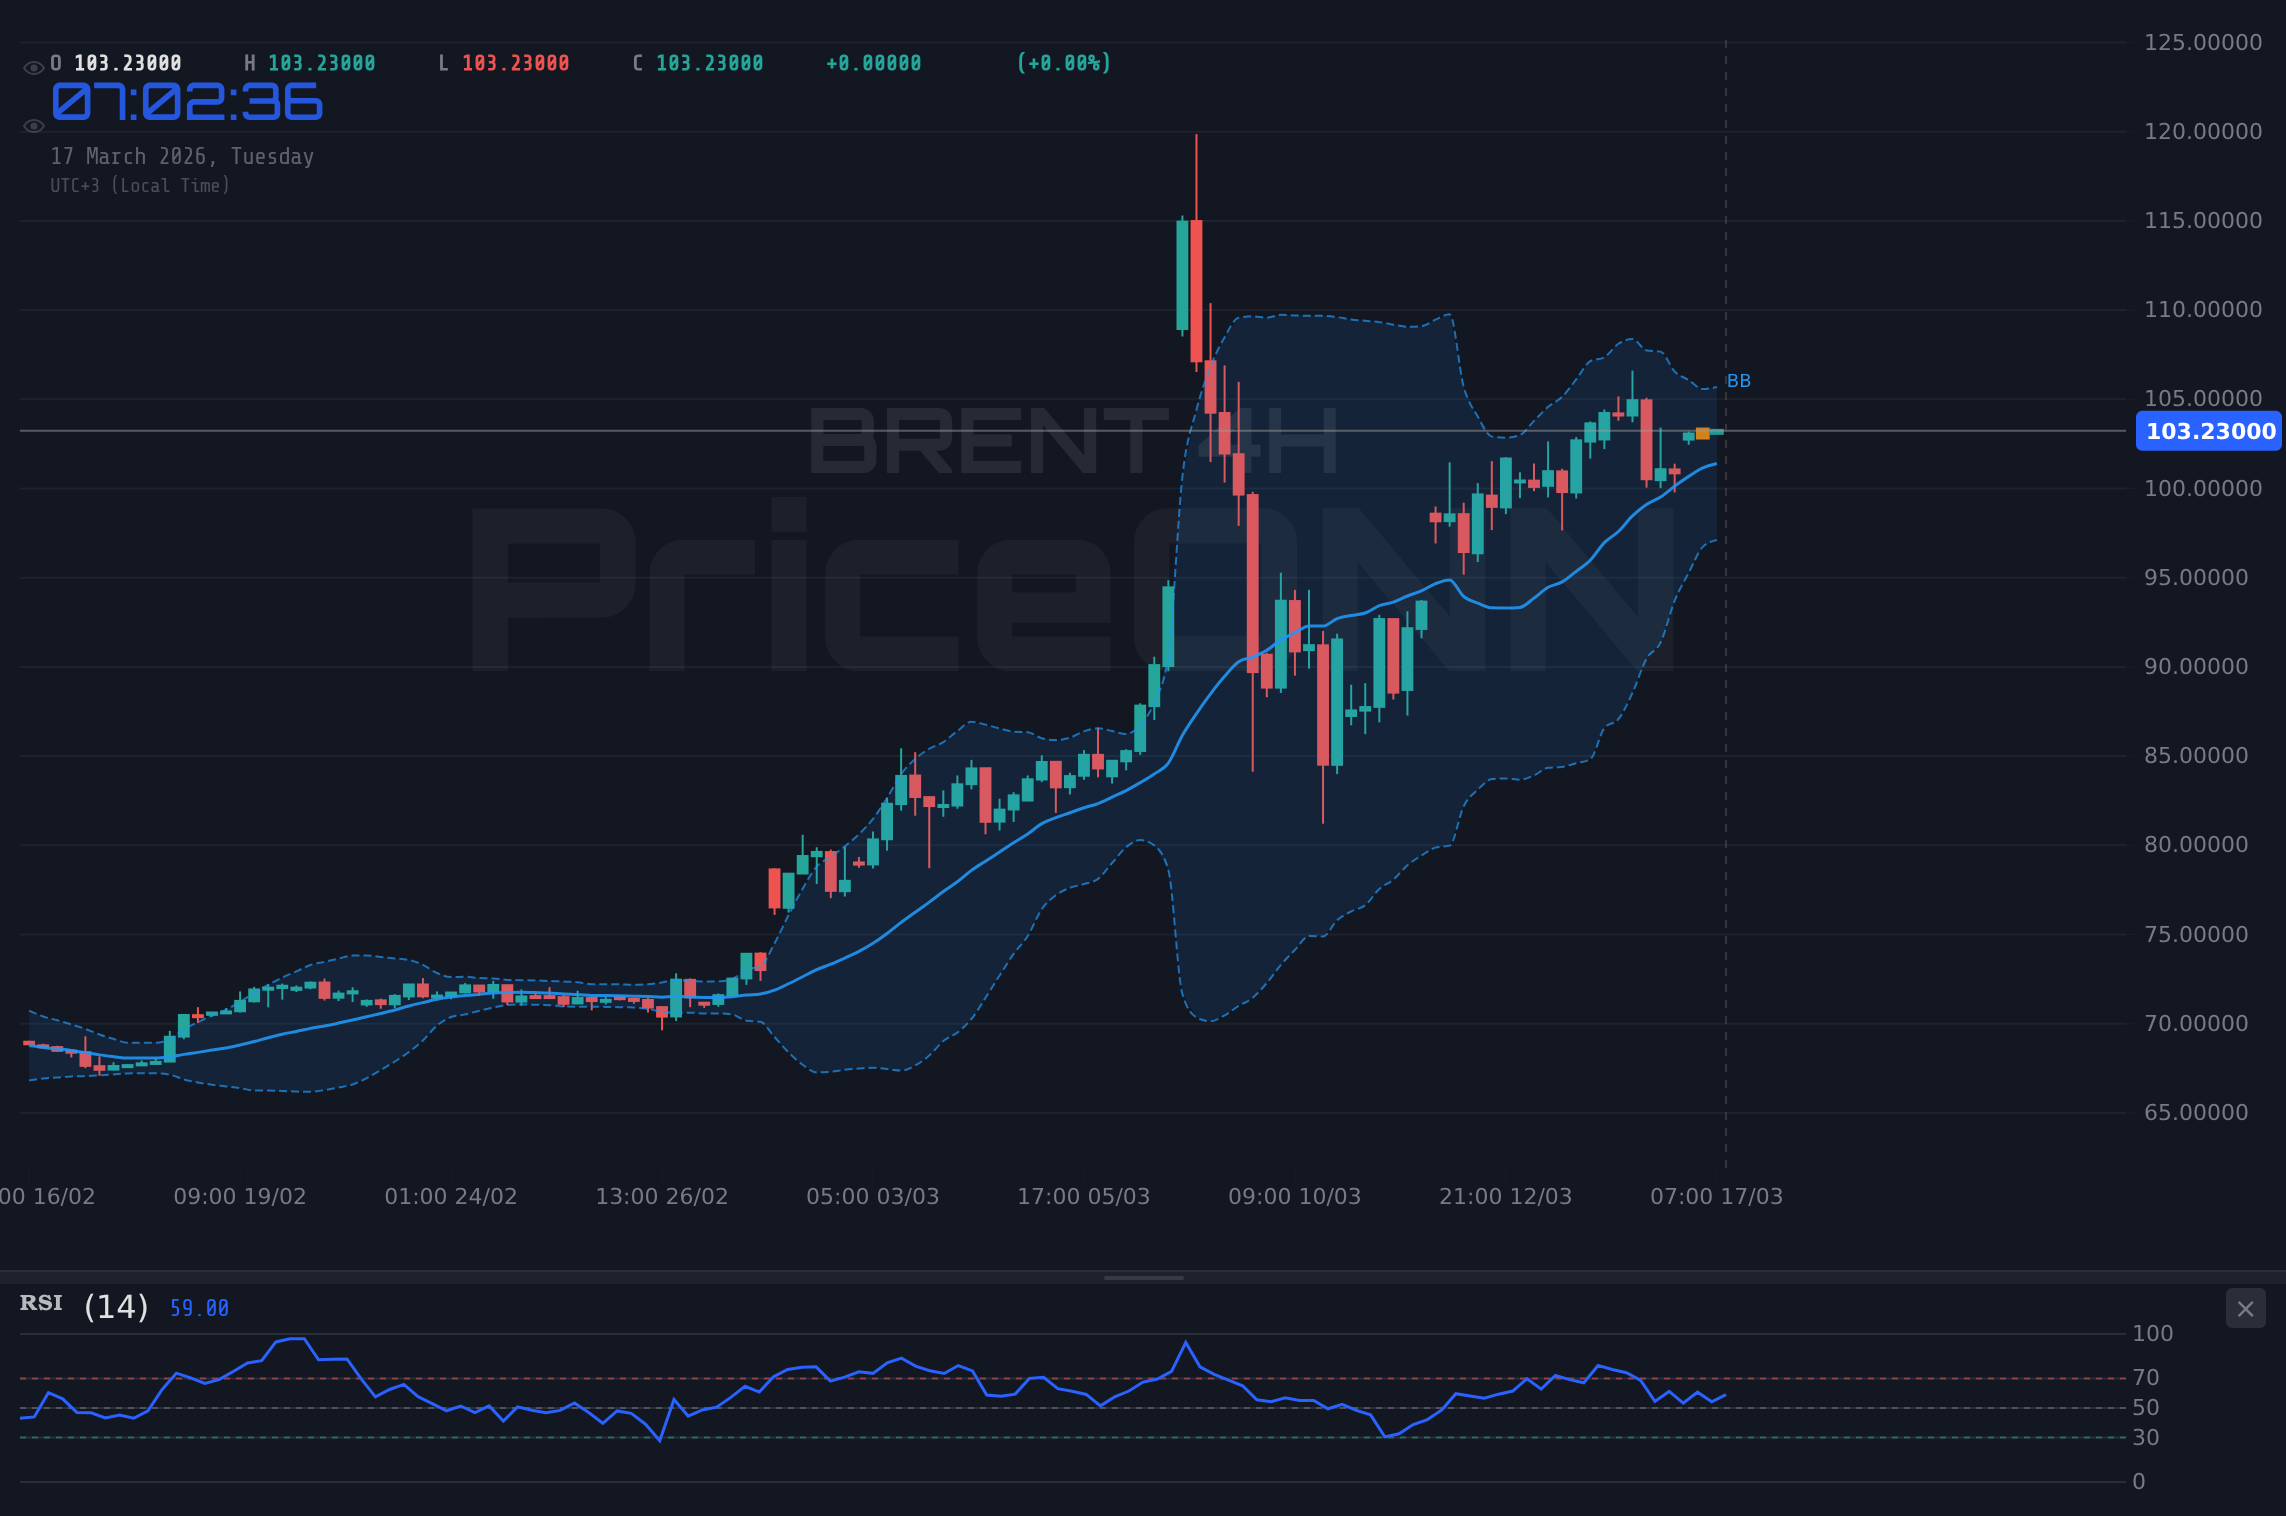
Brent Crude Tests $103.32: Geopolitical Tensions Fuel Bullish Momentum
Brent crude oil is trading at $103.32 as escalating Middle East tensions and strong demand indicators point to continued bullish sentiment, with key resistance at $105.05 in focus.
The oil market is on edge, and Brent crude is leading the charge. At $103.32, the benchmark is not just testing psychological levels but is actively being propelled by a confluence of geopolitical fireworks and robust demand signals. The recent surge, highlighted by a 2.45% daily gain, isn't a mere blip; it's a clear indication that the market is pricing in significant supply risks and a persistent appetite for energy, painting a picture of sustained upward pressure in the near term.
- Brent crude is trading at $103.32, showing a strong bullish trend with a 2.45% daily increase.
- Geopolitical tensions in the Middle East are a primary driver, increasing supply risk premiums.
- Key resistance is identified at $105.05, with a strong daily uptrend signal (ADX 59.72).
- The 1D RSI at 81.48 indicates extreme overbought conditions, suggesting a potential pullback or consolidation is due.
- Correlation with DXY (99.68) shows a strengthening dollar, which typically acts as a headwind for commodities, yet oil is pushing higher.
The Middle East Premium: A Persistent Factor
The narrative driving oil prices higher is undeniably centered on the escalating conflict in the Middle East. Reports of intensified regional disputes and disruptions to key shipping lanes are not just headlines; they are direct signals of potential supply disruptions. This geopolitical premium is a critical component of the current price action. When we see news like crude oil prices surging due to escalating Middle East tensions, it translates directly into traders demanding a higher price for barrels that might be at risk. The market's reaction, even to early signs of easing tensions in some reports, has been volatile, underscoring how sensitive the oil complex is to developments in this volatile region. This ongoing uncertainty means that any flare-up or escalation could easily push Brent prices towards the next significant resistance level.
The inherent volatility associated with Middle Eastern conflicts cannot be overstated. Historically, these events have led to sharp, albeit sometimes temporary, spikes in oil prices. The current ADX value on the daily chart is a striking 59.72, indicating an exceptionally strong trend. While this suggests momentum is firmly behind the bulls, it also raises the question of sustainability. A trend this strong can often extend further than expected, but it also means that any significant geopolitical shift towards de-escalation could trigger a sharp reversal, catching many off guard. The market is clearly factoring in a baseline level of risk, and any news that alters that assessment will likely lead to significant price adjustments.
Demand Side Strength: More Than Just Geopolitics
While geopolitical risks provide the immediate upward thrust, the underlying demand for oil remains robust, adding another layer of support to Brent's ascent. The daily chart shows a strong uptrend with an RSI of 81.48, firmly in overbought territory. This suggests that the buying pressure has been significant and sustained. Despite the lofty RSI, the ADX at 59.72 confirms the trend's strength, indicating that we are in a powerful move that, technically speaking, shows no immediate signs of exhaustion from a trend-following perspective, even if oscillators are screaming 'overbought'. This dichotomy between trend strength and overbought conditions is often seen in strong bull markets where prices can continue to climb even as indicators suggest a pause is due.
Furthermore, the correlation with broader market sentiment cannot be ignored. While indices like the SP500 are showing signs of weakness, trading near 6679.35 with a daily drop of 0.23%, and Nasdaq is down 0.34% to 24562.25, oil is demonstrating a degree of decoupling. This suggests that the drivers for oil - geopolitics and physical demand - are currently outweighing the broader risk-off sentiment seen in equities. This resilience highlights the essential nature of oil as a global commodity. Even when risk appetite wanes, the world still needs to power its economies, and that fundamental demand provides a floor under prices.
Technical Picture: Navigating Overbought Territory
On the technical front, Brent crude presents a compelling, albeit cautionary, picture. The daily chart reveals a powerful uptrend, supported by an ADX of 59.72, signaling a very strong directional move. The price is trading above the middle Bollinger Band, with the upper band stretching, indicating expanding volatility to the upside. However, the RSI(14) at 81.48 is a flashing red light. Readings this high typically suggest that the asset is overbought and due for a correction or at least a period of consolidation. The Stochastic Oscillator, with K=56.46 and D=53.24, also shows a bullish signal (%K > %D), but it's not in the extreme overbought zone that the RSI is indicating, offering a slight divergence in signals.
The immediate resistance level to watch is $105.05. A decisive break above this level, especially with strong volume, could signal a continuation of the bullish trend, potentially targeting the next significant resistance at $109.24. However, the overbought RSI at 81.48 means that any move higher from current levels around $103.32 needs to be treated with caution. A more probable scenario in the short term might involve consolidation or a minor pullback. The support levels to monitor are $103.38 (which is very close to the current price, acting as immediate psychological support), followed by $102.89 and $102.56. A close below $102.56 on the daily chart would start to cast doubt on the immediate bullish outlook.
Correlation Dynamics: DXY and Equities
The interplay between Brent crude, the US Dollar Index (DXY), and equity markets provides crucial context. The DXY is currently trading at 99.68, showing a daily increase of 0.24%, indicating a strengthening dollar. Typically, a stronger dollar acts as a headwind for dollar-denominated commodities like oil, as it makes them more expensive for holders of other currencies. However, in this instance, Brent is pushing higher despite the dollar's strength. This suggests that the bullish factors for oil - primarily geopolitical risk and strong demand - are currently powerful enough to override the typical inverse correlation with the dollar.
The divergence between oil's performance and that of major equity indices like the SP500 and Nasdaq is also noteworthy. While Brent rallies on geopolitical fears and demand strength, equities are showing signs of weakness. The SP500 is down 0.23% and Nasdaq is down 0.34%. This risk-off sentiment in equities, contrasted with the strong performance in oil, reinforces the idea that oil is being driven by specific commodity-related factors rather than broad market risk appetite. Investors are seemingly differentiating between risk assets (equities) and essential commodity assets (oil) in the current environment, prioritizing energy security and inflation hedges.
The Role of Inflation and Central Banks
Oil prices are intrinsically linked to inflation expectations. A sustained rise in oil prices, such as the one we are witnessing, can contribute to inflationary pressures globally. This puts central banks in a difficult position. If inflation remains stubbornly high or re-accelerates due to energy costs, it could complicate monetary policy decisions. While the Fed is currently showing a strong uptrend on its daily chart (ADX 33.54), its actual policy path remains sensitive to incoming data. For instance, if inflation fears intensify due to oil prices, it might delay or alter the expected trajectory of interest rate changes, which in turn could impact global growth and, consequently, oil demand.
The recent news about WTI crude oil plunging below $95 after reaching $101 amid escalating Middle East tensions highlights the market's sensitivity to both supply disruptions and the potential for de-escalation. While Brent is currently trading at $103.32, this volatility serves as a reminder that the geopolitical premium can evaporate quickly. The market is constantly weighing the immediate risks against the longer-term outlook for demand and central bank policy. A sustained high oil price environment would undoubtedly keep inflation concerns at the forefront, forcing central banks to remain vigilant and potentially influencing their decisions on interest rates. This intricate dance between energy prices, inflation, and monetary policy will continue to be a key theme for traders.
Trading Scenarios: What Lies Ahead?
Given the current technical and fundamental backdrop, several scenarios are plausible for Brent crude. The dominant trend remains bullish, as confirmed by the daily ADX of 59.72 and the price trading above key moving averages. The immediate hurdle is the $105.05 resistance level. A strong daily close above this mark, ideally on increased volume, would confirm a continuation of the uptrend and open the path towards the $109.24 and $111.88 resistance levels. This scenario is supported by ongoing geopolitical tensions and robust demand, though the extremely high RSI of 81.48 suggests that such a move might be met with significant profit-taking or consolidation.
Conversely, a bearish scenario would emerge if Brent fails to decisively break above $105.05 and starts to consolidate or pull back. A daily close below the $102.89 support level, and more critically, below $102.56, would signal a potential short-term reversal. This could be triggered by any significant de-escalation in Middle East tensions or signs of weakening global demand. In such a case, the price could retest the $102.32 support and potentially move lower towards $99.96, where the 4H chart shows its primary support. The current stochastic signals on the 1D chart (%K < %D) lean towards a potential pullback, even as the ADX confirms trend strength.
A third, perhaps more likely, scenario in the short term is a period of consolidation. The market might pause here around the $103.32 mark, digesting the recent gains and waiting for clearer signals from geopolitical developments or upcoming economic data. This would likely involve price action fluctuating between the immediate support near the current price and the $105.05 resistance. Traders looking for clear directional conviction might prefer to wait for a decisive break of either the support or resistance levels before committing to new positions. The high RSI reading makes chasing price much above $103.32 look risky without further confirmation.
The Importance of Risk Management
In a market environment as dynamic and driven by geopolitical events as crude oil, risk management is not just advisable - it's paramount. The strong trend indicated by the ADX means that while the potential for further upside exists, the risk of a sharp reversal is also elevated, especially with the RSI in extreme territory. Traders should be acutely aware of the levels mentioned. A close below $102.56, for instance, would invalidate the immediate bullish setup. Similarly, a breakout above $105.05 needs to be confirmed by volume and sustained price action, not just a brief spike.
For those looking to trade Brent, understanding the 'why' behind price movements is crucial. Is the rally driven by actual supply fears, or is it speculative positioning ahead of potential events? The current data suggests a blend of both, with geopolitical risk adding a significant premium. If you are considering entering long positions, waiting for a pullback to a key support level like $102.89 or even $102.56, coupled with signs of stabilization, might offer a better risk-reward ratio than chasing the price higher from $103.32. Conversely, if you are looking for shorting opportunities, waiting for a confirmed break below $102.56 would be prudent, targeting lower support levels.
The market is currently favouring a bullish outlook for Brent crude, driven by a potent mix of geopolitical risk and steady demand. However, the technical indicators, particularly the extremely high RSI, suggest that the current rally might be stretched. Traders should exercise caution and adhere strictly to risk management principles. The $105.05 level remains a critical point of resistance; a clear break above it could fuel further gains, but failure to do so, especially with a close below $102.56, could signal a significant pullback. Patience and discipline will be key to navigating these volatile waters.
Frequently Asked Questions: BRENT Analysis
What happens if Brent crude breaks above the $105.05 resistance level?
A sustained break above $105.05, confirmed by strong volume, would likely signal a continuation of the bullish trend. This could open the door for prices to target subsequent resistance levels at $109.24 and potentially $111.88, especially if geopolitical tensions remain elevated.
Should I buy Brent at current levels of $103.32 given the RSI is at 81.48?
Buying directly at $103.32 with the RSI at 81.48 presents a high-risk entry due to overbought conditions. A more prudent approach might involve waiting for a pullback to support levels like $102.89 or $102.56, or for confirmation of a breakout above $105.05 on increased volume.
Is the extreme RSI reading of 81.48 a sell signal for Brent crude?
An RSI of 81.48 is a strong indicator of overbought conditions, suggesting that the recent rally may be due for a pause or correction. While not an immediate sell signal on its own, especially with the ADX confirming trend strength, it signals caution for new long positions and highlights the potential for profit-taking.
How will escalating Middle East tensions affect Brent crude prices this week?
Escalating tensions typically increase the geopolitical risk premium on oil prices, potentially pushing Brent towards resistance levels like $105.05 and beyond. However, the market also reacts to any signs of de-escalation, making the price action volatile and dependent on incoming news flow.
| Indicator | Value | Signal | Interpretation |
|---|---|---|---|
| RSI (14) | 81.48 | Overbought | Extreme reading, potential reversal or consolidation |
| MACD Histogram | 0.79 | Positive Momentum | Bullish momentum continues |
| Stochastic | K:56.46 D:53.24 | Bullish Crossover | Bullish signal, but RSI is more extreme |
| ADX | 59.72 | Strong Trend | Very strong uptrend confirmed |
| Bollinger | Upper Band | Watch | Price above middle band, suggests upside potential |
Track markets in real-time
AI-powered analysis, technical indicators and real-time price data.
Join Our Telegram Channel
Breaking market news, AI analysis and trading signals instantly.
Join Channel