ETHUSD Tests $2,320 Resistance: Bull vs. Bear Battle at Key Levels
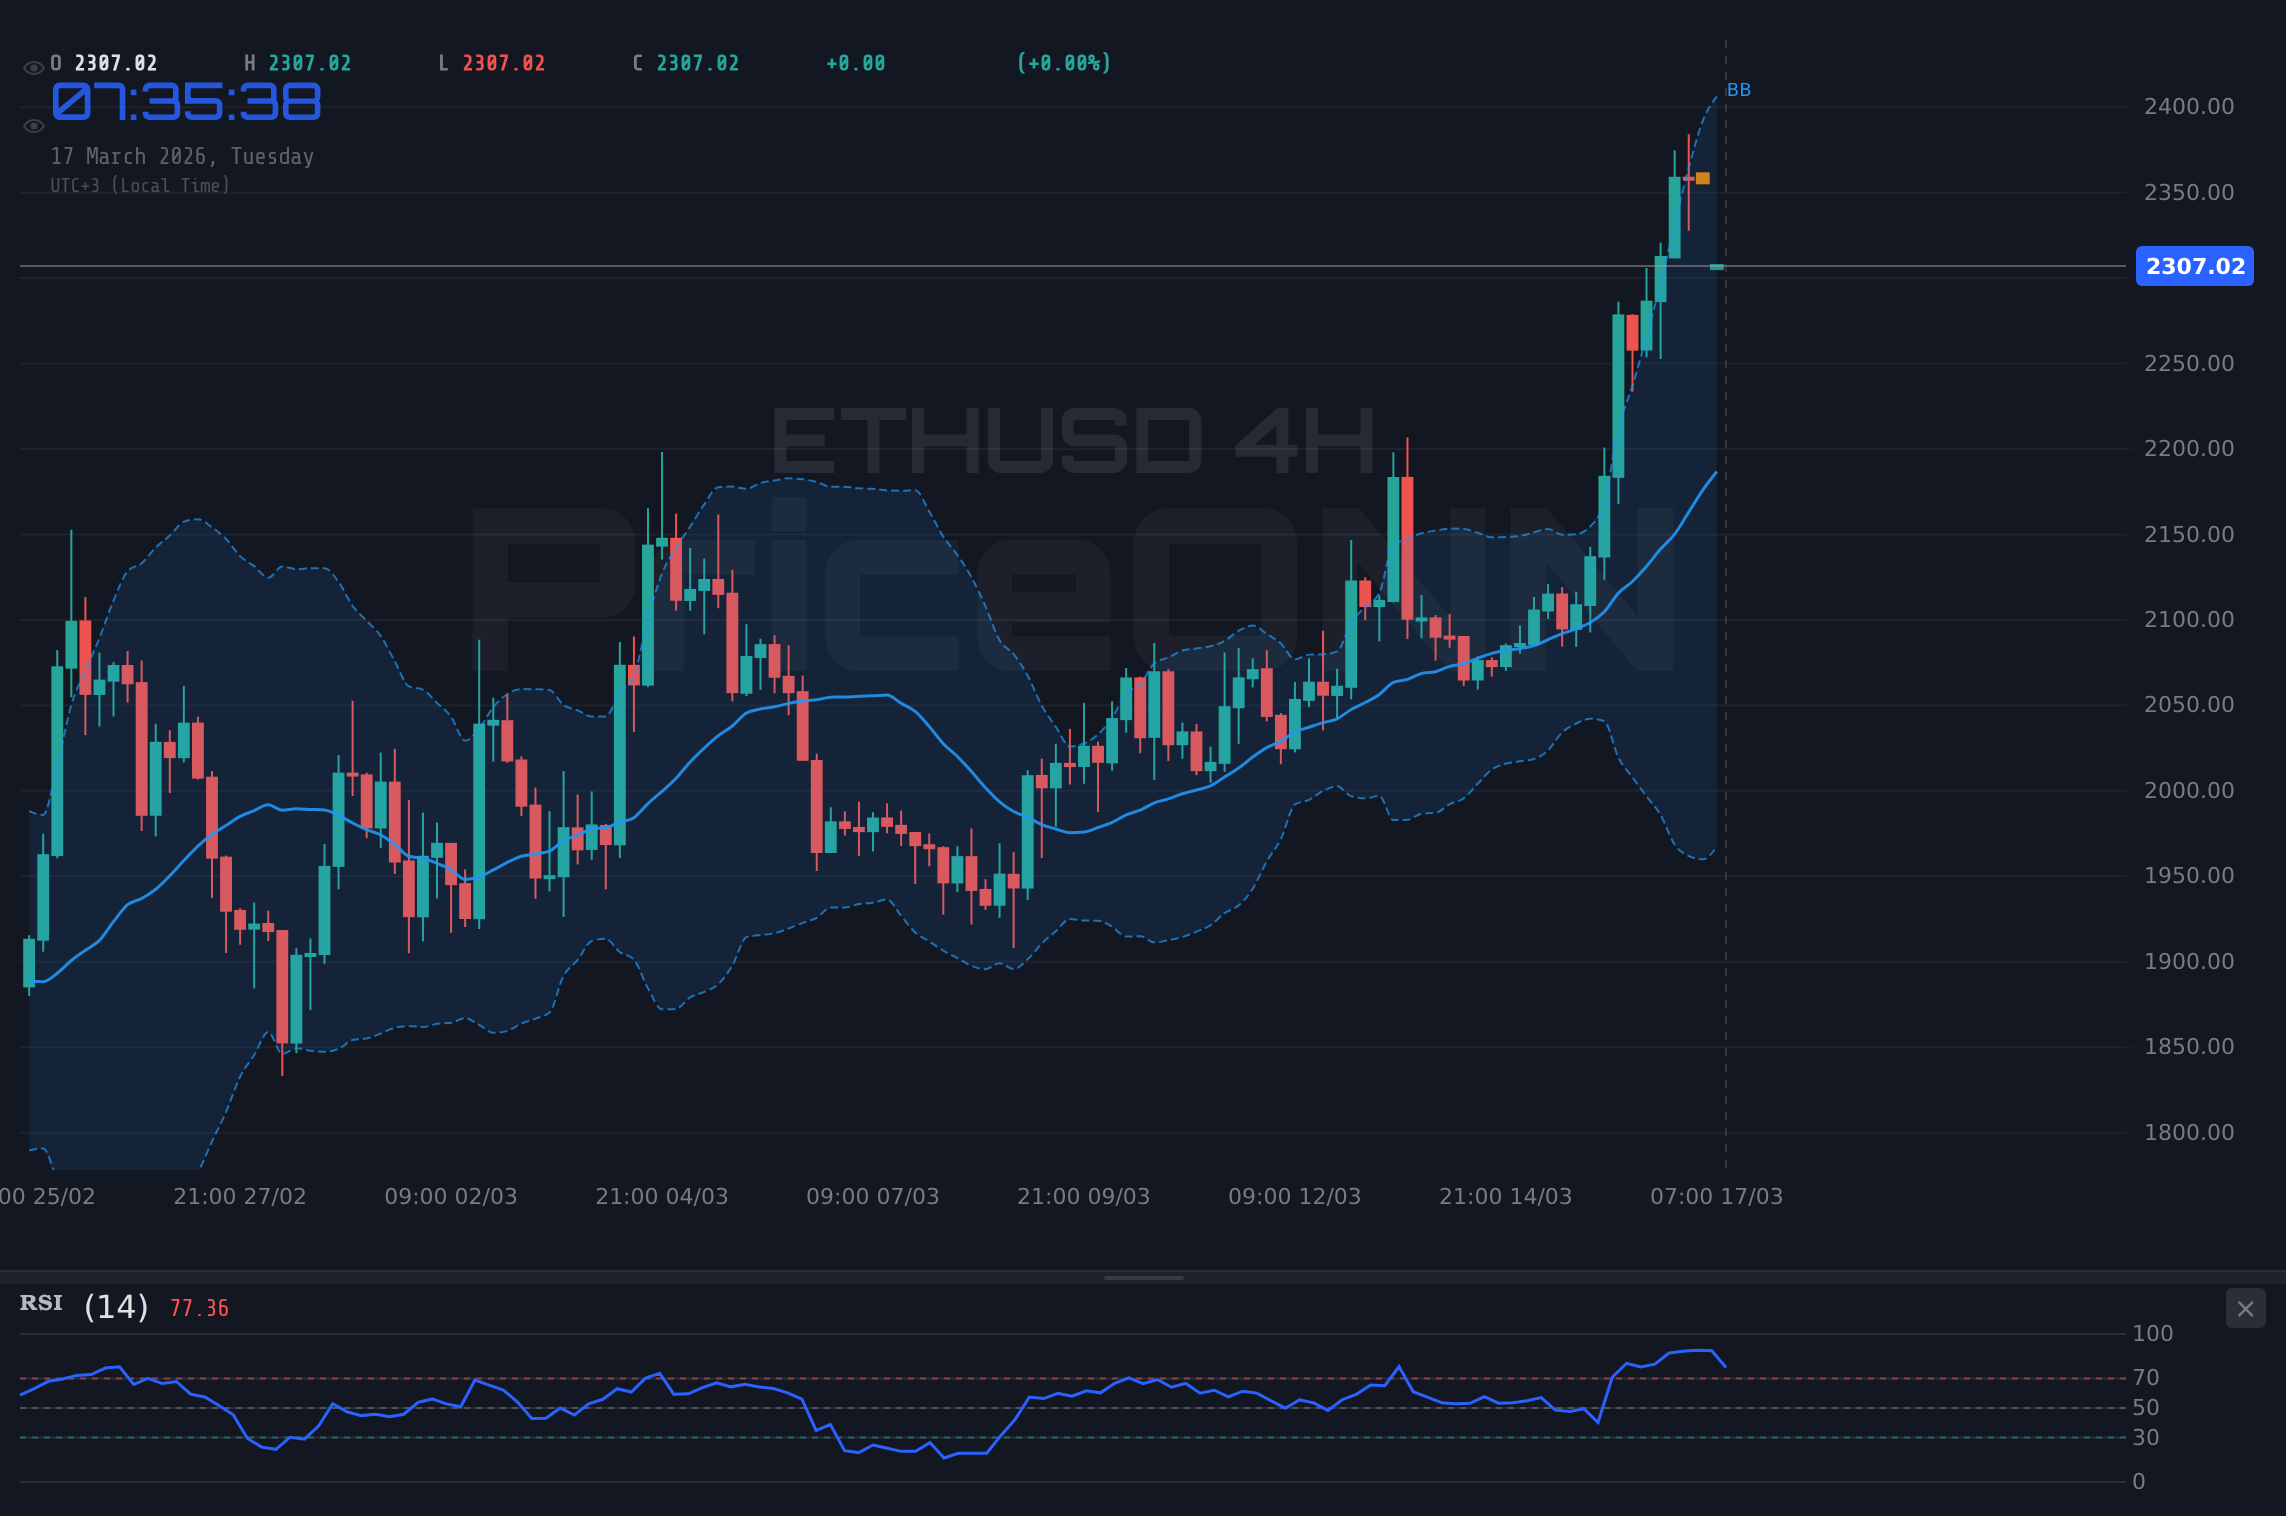
ETHUSD is trading at $2,307.90, nearing $2,320 resistance. Bulls eye further gains while bears watch critical support at $2,196.
The digital asset market is at a critical juncture, with ETHUSD currently hovering around $2,307.90. This price point finds ETH squarely between a significant resistance level at $2,320 and a crucial support zone around $2,196. This tension sets the stage for a classic bull vs. bear debate, where every tick of the price action is scrutinized for clues about the next major move. The question on every trader's mind is whether the bulls can push past the immediate resistance to retest higher grounds, or if the bears will seize control, driving the price back down towards the lower support levels. The underlying market sentiment, influenced by broader macroeconomic trends and specific crypto-related news, will be key in determining the victor of this ongoing tug-of-war.
- ETHUSD is trading at $2,307.90, facing immediate resistance at $2,320 and key support at $2,196.
- The 1-hour chart shows bullish momentum (RSI 56.23, MACD positive), but the 1-day trend is neutral with a strong ADX of 26.35 suggesting a potential trend formation.
- DXY at 99.66 is showing strength, potentially creating headwinds for crypto assets like ETHUSD.
- Geopolitical tensions and oil price volatility (Brent at $103.16) add layers of uncertainty to risk assets.
The Bullish Case: Riding the Momentum Wave
The Case for Upside: Technical Strength and Market Optimism
The bulls are looking at a confluence of technical signals that suggest ETHUSD could be poised for further upside. On the 1-hour timeframe, the Relative Strength Index (RSI) sits at a respectable 56.23, indicating room for upward movement before hitting overbought territory. The Moving Average Convergence Divergence (MACD) also shows positive momentum, with the MACD line trading above its signal line, reinforcing the idea of buying pressure. Furthermore, the Stochastic Oscillator is in a favorable position, with the %K line at 54.43 and the %D line at 82.51, suggesting that while there's some divergence, the overall direction is still leaning bullish, particularly on shorter timeframes. The ADX on the 1-hour chart is at 39.09, indicating a strong trend is in play, which could favor continuation if the price breaks through immediate resistance.
The 4-hour chart offers further encouragement for the bulls. The RSI is at 65, firmly in bullish territory but not yet extreme, suggesting sustained buying interest. The MACD here is also positive, and the Stochastic Oscillator shows %K at 77.18 and %D at 83.28, which, despite being in the overbought zone, still leans towards continued upward momentum. The ADX at 41.81 confirms a strong trend. On the daily chart, while the overall trend is neutral, the RSI at 59.09 and a positive MACD with the Bollinger Bands holding above the middle band suggest that the underlying sentiment remains constructive. The key resistance level to watch is $2,357.98 on the 1-hour chart and $2,385.17 on the 4-hour chart. A decisive break and hold above these levels could signal a move towards the higher daily resistance targets, particularly the $2,447.83 mark.
External Catalysts: A Supportive Macro Environment?
While the crypto market can often move independently, broader market conditions play a significant role. Currently, the US Dollar Index (DXY) is trading at 99.66, showing a degree of strength. Historically, a stronger dollar can act as a headwind for risk assets like ETHUSD. However, the narrative is complex. If the dollar's strength is driven by global risk aversion, it could indirectly pressure ETHUSD. Conversely, if it's due to perceived US economic resilience, it might not be as detrimental. The current market data shows Brent crude oil at $103.16 and WTI at $95.74, indicating elevated energy prices. Such conditions can fuel inflation concerns, which often leads central banks to maintain a hawkish stance or delay rate cuts. This, in turn, can increase the cost of capital and potentially dampen appetite for riskier assets. However, if inflation fears subside or if central banks signal a pivot, it could unlock significant capital for assets like ETHUSD.
The recent news flow highlights some mixed signals. While reports suggest geopolitical tensions are escalating in the Middle East, leading to oil price spikes, other reports indicate a potential easing of tensions in specific areas, causing oil prices to tumble. This volatility in energy markets adds a layer of uncertainty. For ETHUSD bulls, a scenario where geopolitical risks subside and central banks ease monetary policy would be ideal. This would reduce the appeal of safe-haven assets like the dollar and encourage investment into growth-oriented assets. The correlation between ETHUSD and the broader stock market, particularly tech-heavy indices like the Nasdaq 100 (currently at 24587.76) and S&P 500 (at 6683.85), is also crucial. If these indices show signs of recovery and sustained upward momentum, it would likely provide a positive tailwind for ETHUSD.
The Bearish Case: Navigating Headwinds and Technical Weakness
The Counter-Argument: Deteriorating Longer-Term Trends
Despite the short-term bullish signals on the 1-hour chart, the longer-term picture presents a more cautious outlook for ETHUSD. The daily chart reveals a neutral trend with an RSI of 48.58, which is leaning towards bearish territory and shows a downward eğilim. The MACD on the daily timeframe is negative, with the MACD line below its signal line, indicating bearish momentum. Crucially, the ADX on the daily chart is at a mere 13.14, signaling a weak trend. This suggests that the current upward price action might be a counter-trend move within a larger consolidation or downtrend. The Stochastic Oscillator on the daily chart is also bearish, with %K at 14.95 and %D at 28, further supporting the notion of weakening upward pressure.
The 4-hour chart also presents bearish undertones. While the RSI is at 43.28, showing room for decline, the Stochastic Oscillator (%K=29.01, %D=23.35) is showing a potential for a bounce, but this is within the context of a strong bearish trend indicated by the ADX at 43.11. The MACD is negative, and prices are trading below the middle Bollinger Band, signaling a bearish inclination. The existence of significant support levels at $2,196.55, $2,034.40, and $1,945.27 on the daily chart provides substantial downside potential if the bears manage to break current price structures. The immediate support level to monitor is $2,196.55, which has historically acted as a significant floor.
Macroeconomic and Geopolitical Pressures
The current macroeconomic landscape presents several challenges for ETHUSD. The DXY (Dollar Index) is currently at 99.66 and showing a strong upward trend on the daily chart (ADX 33.54). A strong dollar typically implies capital flowing out of riskier assets and into the relative safety of the US currency, which can suppress ETHUSD prices. Elevated energy prices, with Brent crude at $103.16, contribute to inflation concerns. This environment might compel central banks, like the Federal Reserve, to maintain higher interest rates for longer, or even consider further tightening if inflation proves persistent. Higher interest rates increase borrowing costs and reduce the attractiveness of speculative investments. The Fed's recent stance, as indicated by market expectations, leans towards caution, potentially delaying any dovish pivot.
Geopolitical instability, particularly in the Middle East, adds another layer of risk. While news reports are mixed, the potential for escalation could lead to a flight to safety, benefiting the dollar and potentially impacting ETHUSD negatively. The recent volatility in oil prices, with WTI fluctuating around $95.74, reflects this uncertainty. If geopolitical tensions worsen significantly, it could trigger a broader risk-off sentiment across financial markets, leading investors to shed positions in cryptocurrencies and other risk assets. The correlation between ETHUSD and tech stocks like the Nasdaq 100 (at 24587.76) and S&P 500 (at 6683.85) is also a concern. If these indices face further selling pressure due to macroeconomic or geopolitical fears, ETHUSD is likely to follow suit.
The Verdict: Navigating the Crossroads
Technical Confluence and Market Sentiment
The battle between bulls and bears is clearly illustrated by the conflicting signals across different timeframes. The 1-hour and 4-hour charts show some bullish potential, driven by shorter-term momentum indicators like RSI and MACD. However, the daily chart presents a more cautionary picture, with a neutral trend, bearish momentum on the MACD, and a weak ADX, all suggesting that the underlying strength for a sustained rally is questionable. The Stochastic Oscillator on the daily chart is also showing a bearish signal (%K < %D), which aligns with the potential for a downturn.
The immediate resistance at $2,320 is a critical hurdle. If ETHUSD fails to decisively break and hold above this level, especially with the prevailing bearish undertones on longer timeframes and the strong DXY at 99.66, the probability of a move lower increases. The support at $2,196.55 becomes the next significant level to watch. A break below this could trigger cascading stop-losses and accelerate the decline. The ADX readings are particularly telling: while the 1-hour chart shows a strong trend (39.09), the daily chart's ADX of 13.14 signifies a lack of commitment from either bulls or bears on a larger scale, making the current price action potentially a 'dead cat bounce' or a temporary reprieve before a more significant move.
Trade Plan: A Measured Approach
Given the conflicting signals and the critical resistance level at $2,320, a cautious approach is warranted. The high ADX on the 1-hour chart (39.09) suggests a strong trend is present, but the daily chart's weak ADX (13.14) tempers this. The current market environment, with a strong DXY and elevated oil prices, adds to the uncertainty.
Bullish Scenario: Breakout Confirmation
45% ProbabilityBearish Scenario: Rejection at Resistance
55% ProbabilityThe higher probability is assigned to the bearish scenario due to the conflicting signals across timeframes and the headwinds from the macroeconomic environment. The DXY's strength at 99.66 and the neutral-to-bearish signals on the daily ETHUSD chart suggest that upside may be limited. However, a decisive break above resistance, confirmed by volume and sustained intraday trading, could shift the probabilities. Traders should manage risk tightly, waiting for clear confirmation before committing to a position.
Frequently Asked Questions: ETHUSD Analysis
What happens if ETHUSD breaks above the $2,357.98 resistance level?
A sustained break above $2,357.98, confirmed on a 4-hour candle close, would likely trigger further buying, targeting the next resistance at $2,385.17 and potentially extending towards $2,447.83. This would signal a shift to a more bullish short-term trend, supported by strong momentum on shorter timeframes.
Should I buy ETHUSD at current levels around $2,307.90, given the conflicting signals?
Buying at current levels carries significant risk due to resistance at $2,320 and bearish signals on the daily chart. A more prudent approach would be to wait for a clear breakout above $2,357.98 or a confirmed rejection and retest of support at $2,196.55, offering a better risk-reward ratio.
Is the RSI at 56.23 on the 1-hour chart a buy signal for ETHUSD?
An RSI of 56.23 on the 1-hour chart indicates positive momentum but is not yet in overbought territory, suggesting room for further upside. However, it must be considered alongside longer-term indicators and price action; on the daily chart, RSI is at 48.58, showing a more neutral to bearish inclination, which tempers the short-term bullish signal.
How will the strong DXY at 99.66 affect ETHUSD's price this week?
The current strength of the DXY at 99.66 generally acts as a headwind for risk assets like ETHUSD. If the dollar continues to strengthen due to risk aversion or hawkish central bank expectations, it could limit upside potential for ETHUSD and increase the probability of a move towards its support levels.
Track markets in real-time
AI-powered analysis, technical indicators and real-time price data.
Join Our Telegram Channel
Breaking market news, AI analysis and trading signals instantly.
Join Channel