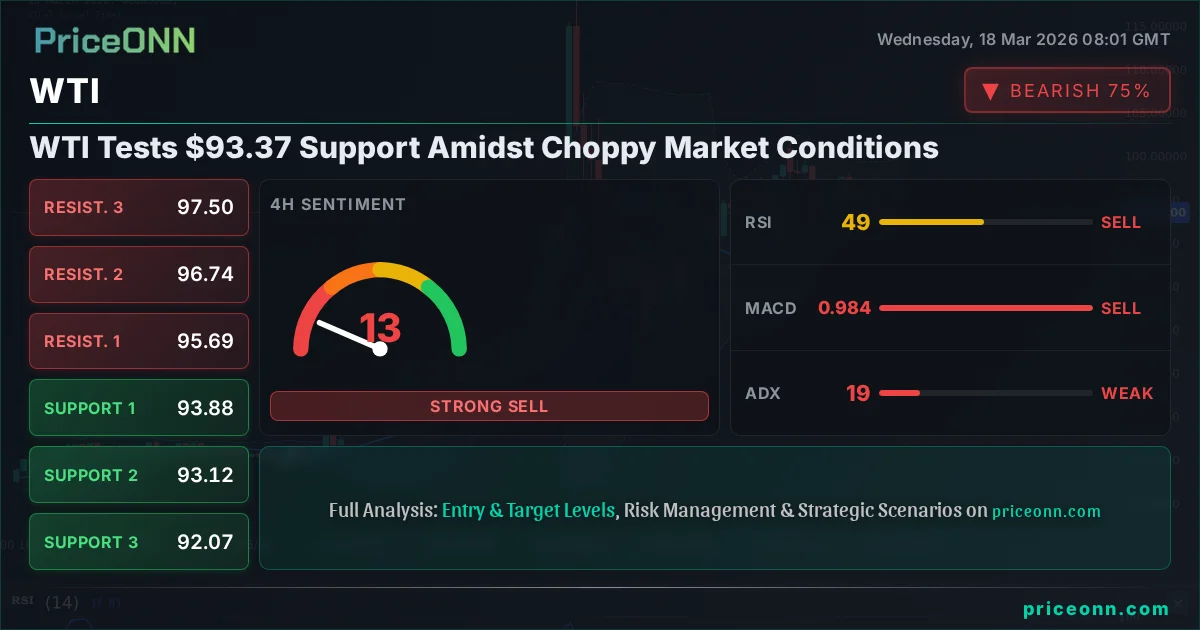
WTI Tests $93.37 Support Amidst Choppy Market Conditions
WTI crude oil hovers near $93.76, facing key support at $93.37. Technical signals are mixed, suggesting a cautious approach as traders await clearer direction.
West Texas Intermediate (WTI) crude oil is currently trading around $93.76, finding itself at a critical juncture as it probes support levels near $93.37. The market is exhibiting signs of consolidation, with indicators providing a mixed bag of signals that demand careful interpretation. This isn't a clear-cut directional play right now; it's a zone where patience and precise observation are paramount for any discerning trader. The broader market context, including the strength of the US Dollar (DXY) and shifts in risk sentiment, continues to play a significant role, adding layers of complexity to the oil market's immediate outlook.
- WTI is testing key support at $93.37, with the current price at $93.76.
- ADX at 18.84 indicates a weak trend, suggesting choppy, range-bound conditions.
- RSI at 43.86 shows room for further downside before becoming oversold.
- MACD histogram is negative, aligning with the current downward pressure on WTI.
- The DXY's strength around 99.39 is likely contributing to the pressure on oil prices.
Navigating the $93.37 Support Zone
The Current Technical Picture
Looking at the 1-hour chart, WTI is showing a clear downward trend with 88% strength, indicated by its ADX value of 16.46. However, this strength is classified as 'weak trend' by the ADX itself, suggesting that while the immediate pressure is downwards, the conviction behind the move isn't overwhelming. The RSI(14) is sitting at 43.86, well within the neutral territory and pointing towards further downside potential before hitting oversold conditions. This gives sellers some room to operate. The MACD histogram is firmly in negative territory, reinforcing the bearish momentum on this shorter timeframe. The Stochastic oscillator, with K at 20.27 and D at 23.23, also signals a bearish continuation, further supporting the idea that the path of least resistance is currently to the downside. The Bollinger Bands are showing the price trading below the middle band, a classic sign of bearish pressure in the short term. This confluence of indicators on the 1-hour chart paints a picture of immediate weakness.
4-Hour Chart Dynamics
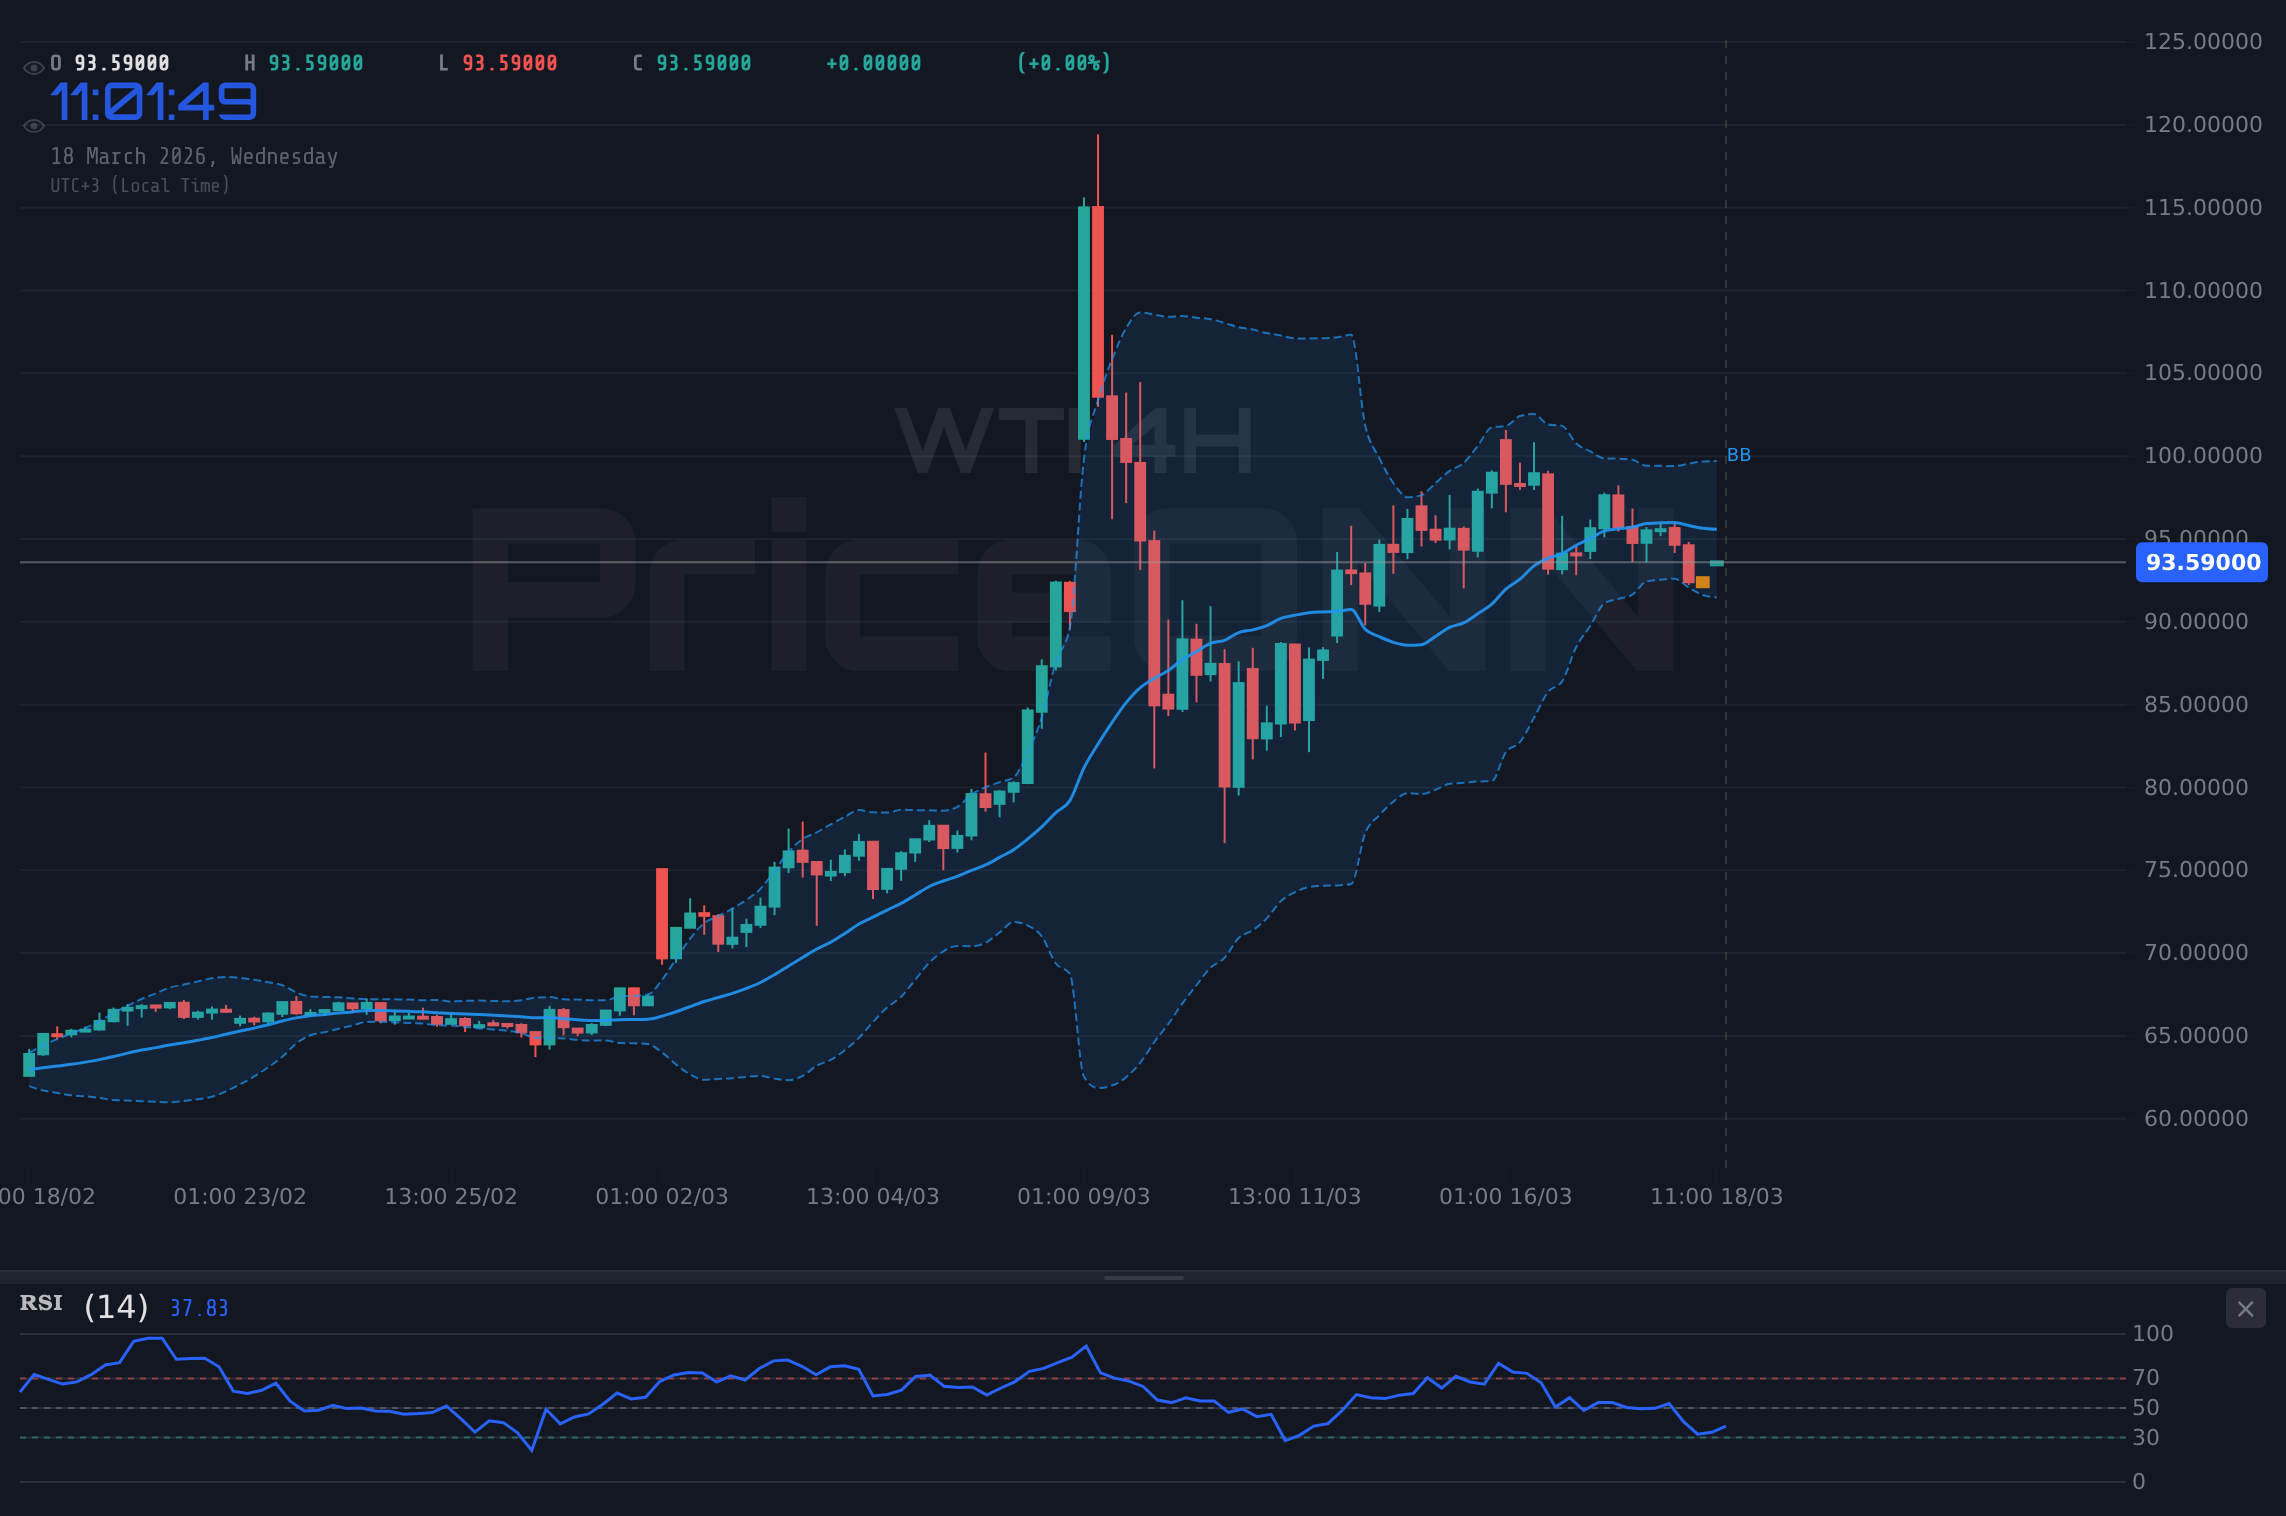
Stepping back to the 4-hour timeframe, the picture becomes a bit more nuanced. The trend is classified as 'Neutral' with 50% strength, and the ADX is at 18.84, reinforcing the idea of a market that isn't strongly trending. This aligns with the 'choppy' market condition noted in the trade recommendation. Here, the RSI is at 49.29, also neutral and showing no immediate signs of being oversold, meaning there's still room for prices to fall before buyers might step in aggressively. The MACD is still negative, suggesting that the larger trend might still be under pressure, but the Bollinger Bands are showing price action between the bands, indicating a less decisive move compared to the 1-hour chart. The Stochastic is showing K=34.51 and D=35.65, still in bearish territory but not yet oversold. The overall signal on this timeframe leans towards 'SELL' (2 Buy, 6 Sell, 0 Neutral), but the weak trend strength (ADX 18.84) suggests that these selling pressures might lack follow-through, potentially leading to range-bound trading.
The Daily Perspective: A Divergent View?
On the daily chart, WTI exhibits a 'Bullish' trend with 100% strength, a stark contrast to the shorter timeframes. This is supported by a very strong ADX reading of 55.31, indicating a powerful upward trend is in play on a macro level. The RSI(14) is at 70.17, which is in the overbought territory. While this might suggest a potential for a pullback or consolidation, in a strong uptrend, RSI can remain elevated for extended periods. The MACD is positive and above its signal line, confirming bullish momentum. The Bollinger Bands are showing price action above the middle band, supporting the bullish outlook. The Stochastic is at K=43.77, D=47.28, suggesting a bearish signal as %K < %D, but this is not an extreme reading and could be a minor divergence within a larger uptrend. The overall signal on the daily chart is 'BUY' (5 Buy, 2 Sell, 0 Neutral). This daily bullishness clashes with the immediate bearish signals on shorter timeframes, creating the 'choppy' condition mentioned earlier. The key here is that the longer-term trend remains bullish, suggesting that any short-term dips might be viewed as opportunities by longer-term players, provided key support levels hold.
Broader Market Correlations and Influences
The Dollar's Dominance: DXY's Impact
The Dollar Index (DXY) is currently trading at 99.39 and showing a bullish trend on the daily chart (62.16 RSI, ADX 34.21). This strength in the dollar typically correlates inversely with commodities like oil. When the dollar strengthens, it makes oil priced in dollars more expensive for holders of other currencies, potentially dampening demand and putting downward pressure on prices. The DXY's current upward momentum, especially on the daily timeframe, adds another layer of resistance for WTI. If the dollar continues to rally, it will make it harder for WTI to sustain any upward moves and could exacerbate any downside pressure. Conversely, a weakening dollar would typically provide a tailwind for oil prices.
Risk Sentiment: Equities as a Barometer
The S&P 500 is currently showing a bullish trend on the 1-hour and 4-hour charts, but a bearish trend on the daily chart (RSI 45.38, ADX 40.98). This divergence in equity markets reflects a broader uncertainty. A strong, risk-on environment, where indices like the S&P 500 are rallying strongly across all timeframes, usually boosts demand for riskier assets like oil. However, the current mixed signals in equities, with the daily chart showing weakness, suggest that overall risk appetite might be wavering. If the major US indices begin to trend lower consistently, it would likely translate into reduced demand for oil and potentially drive prices down further, exacerbating the bearish sentiment seen on WTI's shorter timeframes. The Nasdaq 100, also showing strength on shorter timeframes but a bearish daily trend, echoes this sentiment of a market on edge.
Inflationary Pressures and Geopolitical Tensions
Oil prices are intrinsically linked to inflation expectations and geopolitical stability. While the provided data doesn't explicitly detail current geopolitical events, the historical context of WTI surges above $95 amid escalating tensions (as noted in recent news) highlights the sensitivity of oil markets to supply disruptions. Any news of conflict escalation, especially involving major oil-producing regions or key transit routes like the Strait of Hormuz, can send prices soaring due to fears of supply shortages. Conversely, signs of de-escalation or increased global oil supply (like the unexpected surge in US oil inventories mentioned in recent news) can lead to price drops. The interplay between supply-side risks and global demand, influenced by economic growth and inflation concerns, creates a volatile environment for WTI. The strong bullish daily trend on WTI (ADX 55.31) and the overbought RSI (70.17) on the daily chart, despite short-term weakness, could be partly driven by persistent inflation fears or ongoing geopolitical risk premiums.
Scenario Planning: What Lies Ahead for WTI?
The Bull's Roadmap: A Path Above $95.69?
For a bullish scenario to gain traction, WTI needs to decisively break above the immediate resistance. The first key resistance level on the 4-hour chart is at $95.69, followed by $96.74 and $97.50. A daily close above $95.69 would be a significant signal, suggesting that the short-term bearish pressures are being overcome and the longer-term daily bullish trend is reasserting itself with conviction. Confirmation would come from increasing volumes, a break above the middle Bollinger Band on the daily chart, and ideally, a bullish crossover on the MACD. If these conditions are met, we could see a move towards the next significant resistance levels. The RSI would need to move out of overbought territory on the daily chart, or at least stabilize, and the Stochastic would ideally show a bullish continuation rather than divergence. Such a move would likely be supported by a weakening DXY and a more positive risk sentiment in the equity markets.
Where Bears Take Control: Below $93.37?
The bearish scenario hinges on the failure of the current support level at $93.37. If WTI experiences a decisive daily close below $93.37, it would signal a potential shift in momentum. The next support levels to watch would be $91.99 on the 1-hour chart and $91.58 on the 4-hour chart. A break below $93.37 would likely be accompanied by a strengthening DXY, a decline in risk appetite (equity markets falling), and potentially, news of increased oil supply or easing geopolitical tensions. On the technical side, this would mean the MACD histogram deepening its negative territory, the RSI moving further away from overbought conditions and towards neutral or oversold levels, and the Stochastic confirming bearish momentum. The ADX on the shorter timeframes might show increasing trend strength in the bearish direction. This scenario would be validated if oil inventory data shows a significant build and geopolitical risks recede.
The Waiting Game: Range-Bound Consolidation
Given the conflicting signals across different timeframes and the weak ADX readings (16.46 on 1H, 18.84 on 4H), a period of range-bound trading is a highly plausible outcome. In this scenario, WTI might oscillate between the current support near $93.37 and the immediate resistance around $95.69. Price action could become choppy, with sharp but short-lived moves in either direction, often driven by intraday news flows or algorithmic trading. The MACD might hover around the zero line, RSI could fluctuate within the neutral 40-60 range, and Stochastic would likely show whipsawing signals. This kind of consolidation often occurs when the market is digesting recent price action and awaiting a significant catalyst, such as key economic data releases or major geopolitical developments, to provide a clear directional bias. The daily chart's strong bullish trend suggests that any downside during this consolidation phase might be capped, with buyers potentially stepping in as prices approach the lower bound of the range.
The Most Likely Scenario: A Cautious Outlook
Considering the data, the most likely scenario in the immediate short-to-medium term appears to be a continuation of range-bound trading, leaning towards further downside probing due to the bearish signals on the 1-hour and 4-hour charts, but with a strong underlying bullish bias from the daily trend. The weak ADX across multiple timeframes supports this view. I'd put the probability of continued range-bound action, with potential for a test of the lower support levels, around 60-65%. A decisive break above $95.69 (bullish scenario) has a probability of 25-30%, contingent on strong catalysts. A clear break below $93.37 (bearish scenario) seems less probable in the short term due to the daily trend's strength, perhaps carrying a 10-15% probability unless significant negative news emerges.
What I'm Watching This Week
My focus is squarely on how WTI reacts to the $93.37 support level. A failure to hold this level on a daily closing basis would be a significant bearish development, potentially opening the door for a much deeper correction. Conversely, a strong reclaim and hold above $95.69, especially on significant volume, would signal a resumption of the bullish trend. I'll also be closely monitoring the DXY's movement and the direction of US equity markets (S&P 500, Nasdaq 100) as key indicators of risk sentiment. Any major shifts in geopolitical news, particularly concerning the Middle East or oil supply dynamics, could override technical considerations and trigger significant price action.
Bullish Scenario: Reclaiming Momentum
25-30% ProbabilityBearish Scenario: Support Breakdown
10-15% ProbabilityNeutral Scenario: Range-Bound Consolidation
60-65% ProbabilityFrequently Asked Questions: WTI Analysis
What happens if WTI breaks below the $93.37 support level?
A sustained break below $93.37 on a daily closing basis would invalidate the immediate bullish outlook and could signal a move towards support at $91.99. This would likely be confirmed by a strengthening DXY and falling equity markets.
Should I buy WTI at current levels around $93.76 given the mixed signals?
Given the current choppy conditions and conflicting signals across timeframes, buying at current levels carries significant risk. A more prudent approach would be to wait for confirmation, such as a clear break above $95.69 or a confirmed hold of $93.37 with bullish divergence.
Is the RSI at 43.86 a sell signal for WTI right now?
An RSI of 43.86 on the 1-hour chart is in neutral territory, indicating some downside pressure but not yet oversold conditions. While it aligns with the bearish momentum on shorter timeframes, it doesn't present an immediate strong sell signal on its own and suggests room for further decline before potential buying interest emerges.
How will the current DXY strength around 99.39 affect WTI this week?
The DXY's strength around 99.39 typically exerts downward pressure on oil prices, making WTI more expensive for non-dollar buyers. This correlation suggests that continued dollar strength could hinder any attempts by WTI to rally and may contribute to testing lower support levels.
| Indicator | Value | Signal | Interpretation |
|---|---|---|---|
| RSI (14) | 43.86 | Neutral | Room for downside before oversold |
| MACD Histogram | -1.83 | Bearish | Negative momentum confirmed |
| Stochastic | K=20.27, D=23.23 | Bearish | Further downside potential |
| ADX | 16.46 | Weak Trend | Choppy market conditions likely |
| Bollinger | Middle Band | Watch | Price below middle band on 1H |
Track markets in real-time
AI-powered analysis, technical indicators and real-time price data.
Join Our Telegram Channel
Breaking market news, AI analysis and trading signals instantly.
Join Channel