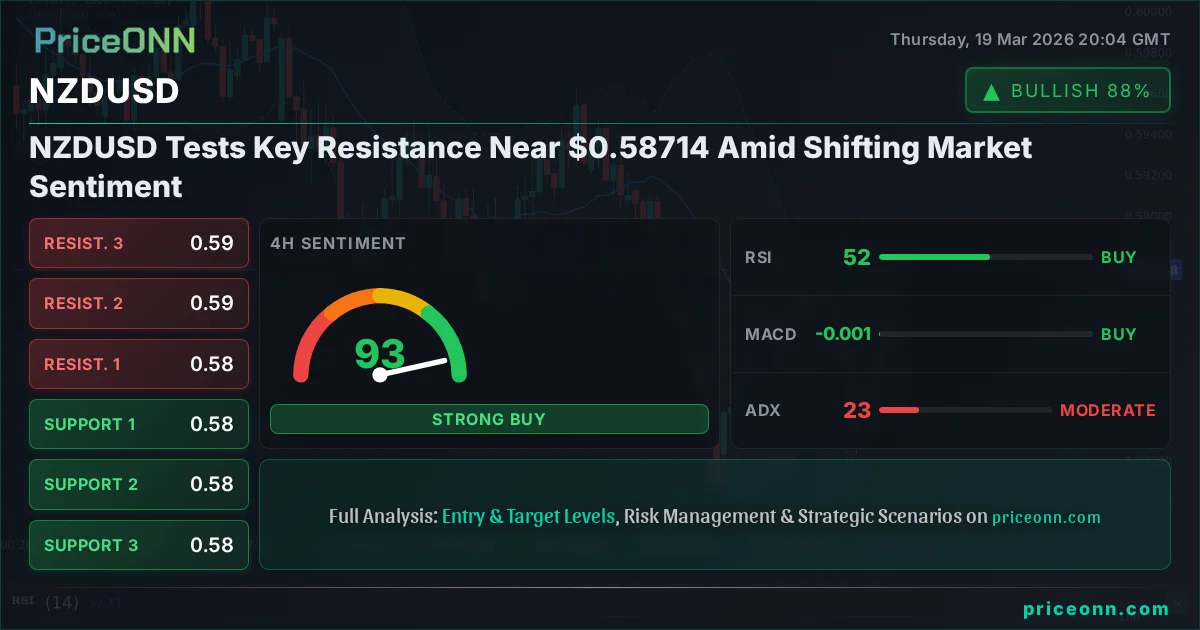
NZDUSD Tests Key Resistance Near $0.58714 Amid Shifting Market Sentiment
NZDUSD hovers around $0.58714, facing critical resistance. With the DXY showing signs of weakness and major indices like SP500 in a downtrend, the pair's next move hinges on key technical levels and upcoming economic data.
NZDUSD Tests Key Resistance Near $0.58714 Amid Shifting Market Sentiment
The NZDUSD currency pair is currently navigating a crucial juncture, trading precisely at $0.58714. This level represents a significant area of resistance that, if decisively broken, could signal a new phase for the pair. However, the broader market context, characterized by a weakening US Dollar Index (DXY) and a risk-off sentiment reflected in the SP500's downward trend, paints a complex picture for the New Zealand Dollar. Understanding the interplay between these factors is paramount for any trader looking to navigate this currency pair effectively in the current environment. The recent sharp movements in commodities like gold and oil, driven by geopolitical tensions and central bank policy expectations, add another layer of complexity, influencing risk appetite and potentially impacting the Kiwi's trajectory.
- NZDUSD is currently trading at $0.58714, testing a significant resistance level.
- The 1-hour chart shows ADX at 23.3, indicating a moderate trend, while RSI(14) at 68.93 suggests upward momentum that is nearing overbought territory.
- Key support for NZDUSD is identified at $0.58498 (S1), with further levels at $0.58386 and $0.58329.
- Resistance is observed at $0.58667 (R1), followed by $0.58724 and $0.58836.
- The US Dollar Index (DXY) is showing a bearish signal on the 1-hour chart at 30.69, potentially offering some reprieve for NZDUSD.
Navigating the Currents: NZDUSD at a Technical Crossroads
The Shifting Sands of Global Markets
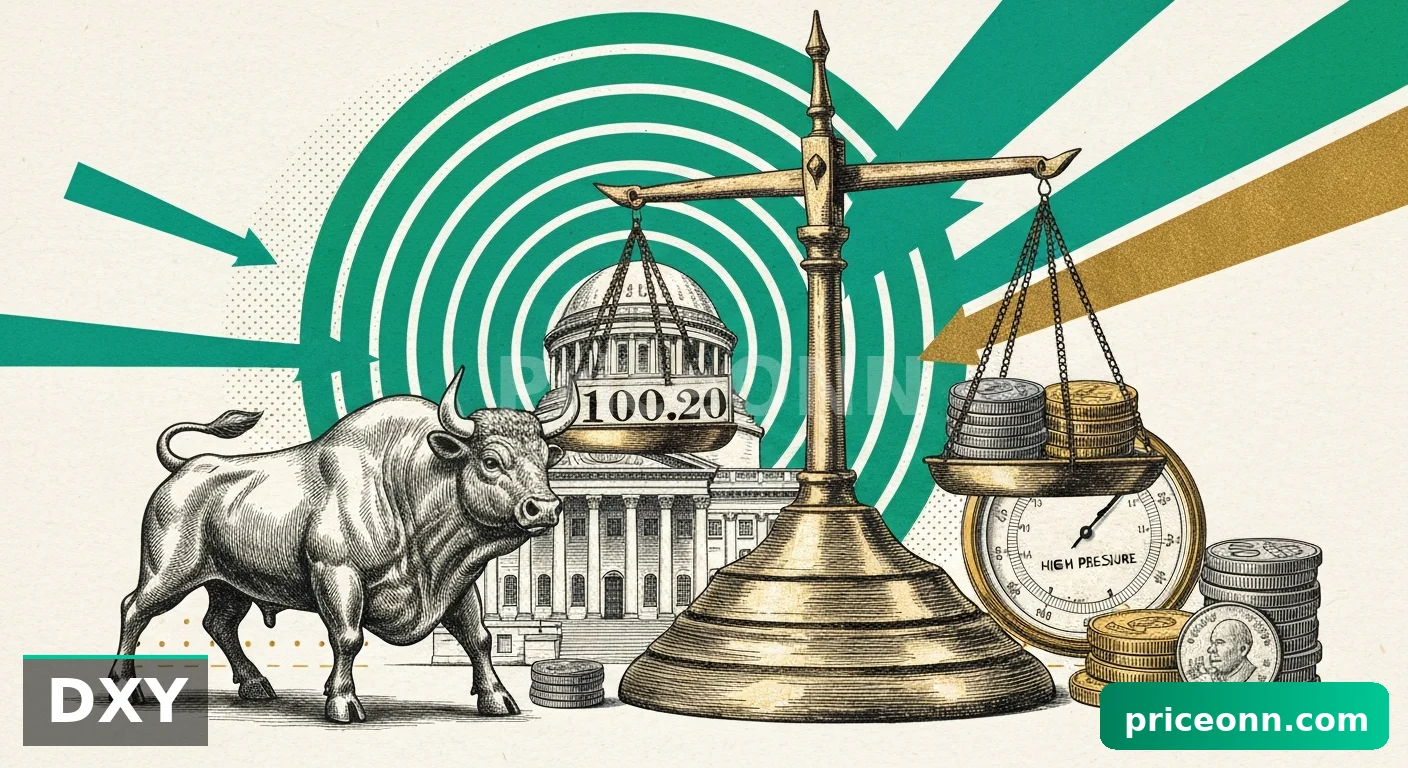
The global financial landscape is currently a tapestry of conflicting signals and evolving narratives. The US Dollar Index (DXY), a key barometer for global risk sentiment, has seen a notable retreat, trading at $99.01. This dip, particularly on the 1-hour chart where the ADX reads a strong 32.63, suggests that the dollar's recent strength might be faltering. Historically, a weakening dollar often translates into a more favorable environment for riskier assets and currencies like the New Zealand Dollar, potentially offering a tailwind for NZDUSD. However, this relationship isn't always linear. The SP500, currently trading at 6602, is exhibiting a bearish trend on the 1-hour timeframe with an ADX of 43.28, indicating a strong downward momentum. This risk-off sentiment in equities can sometimes override dollar weakness, creating a demand for safe-haven assets and putting pressure on commodity-linked currencies like the NZD. The interplay between a softening dollar and falling equities creates a complex environment, demanding a nuanced approach to trading pairs like NZDUSD.Commodities Under Pressure: Gold's Plunge and Oil's Volatility
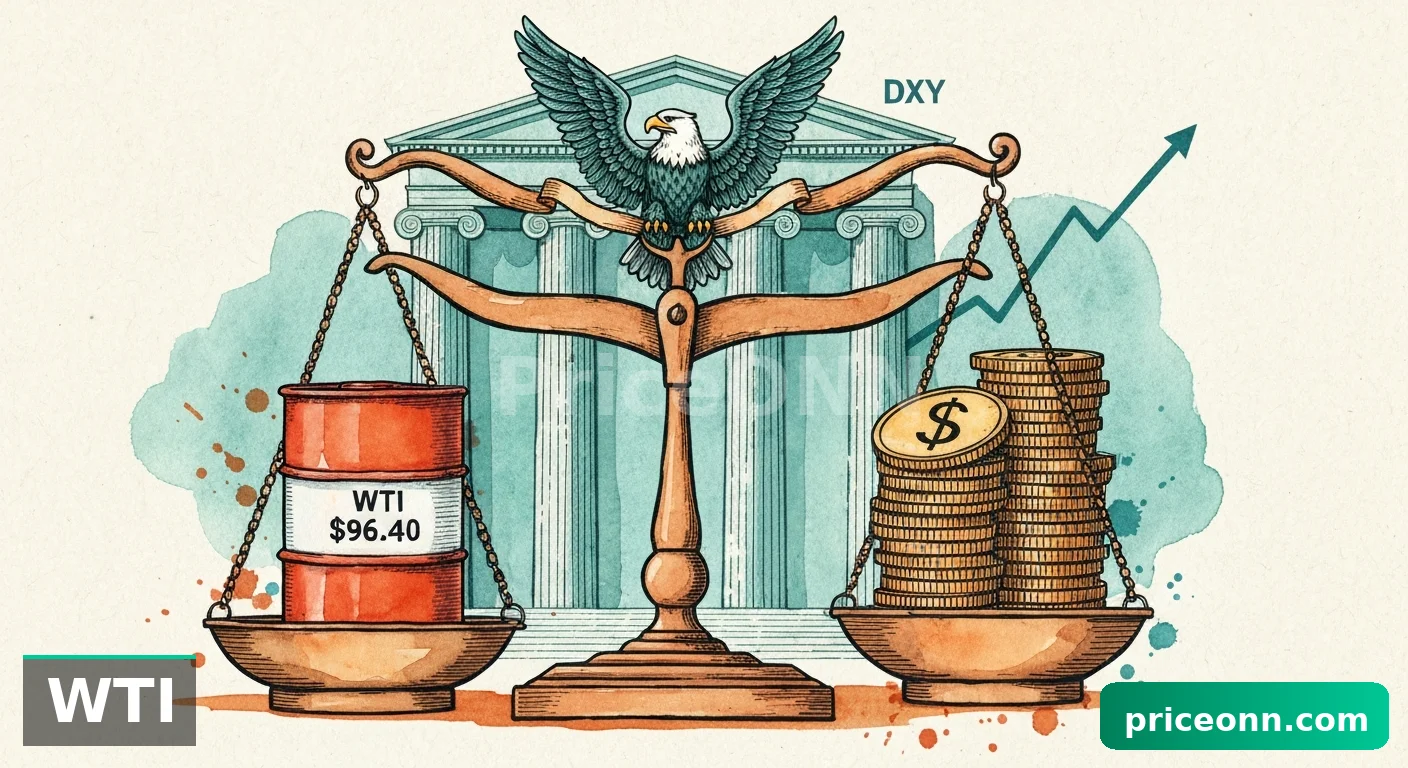
The commodity markets are painting a volatile picture. Gold, often seen as a safe-haven asset, has experienced a significant tumble, dropping to $4,653.34. The 1-hour RSI at 36.63 and the 4-hour RSI at 22.34 clearly indicate oversold conditions, suggesting that the sharp decline might be overextended. This sharp drop in gold, despite geopolitical turmoil and surging oil prices, is particularly noteworthy. Oil prices, on the other hand, remain a focal point, with Brent crude trading around $107.93. While currently in a strong uptrend on the 1-hour chart (ADX 33.95), the daily chart shows a very strong bullish trend (ADX 63.48) with RSI at 80.59 nearing overbought territory. This commodity complex, with gold falling and oil rising, signals underlying inflationary pressures and geopolitical risks, but also a potential divergence in safe-haven demand versus inflation hedging. This divergence can create choppy conditions for currencies like NZDUSD, which often correlates with commodity prices.NZDUSD: A Technical Deep Dive
Intraday Dynamics: The 1-Hour Chart Perspective
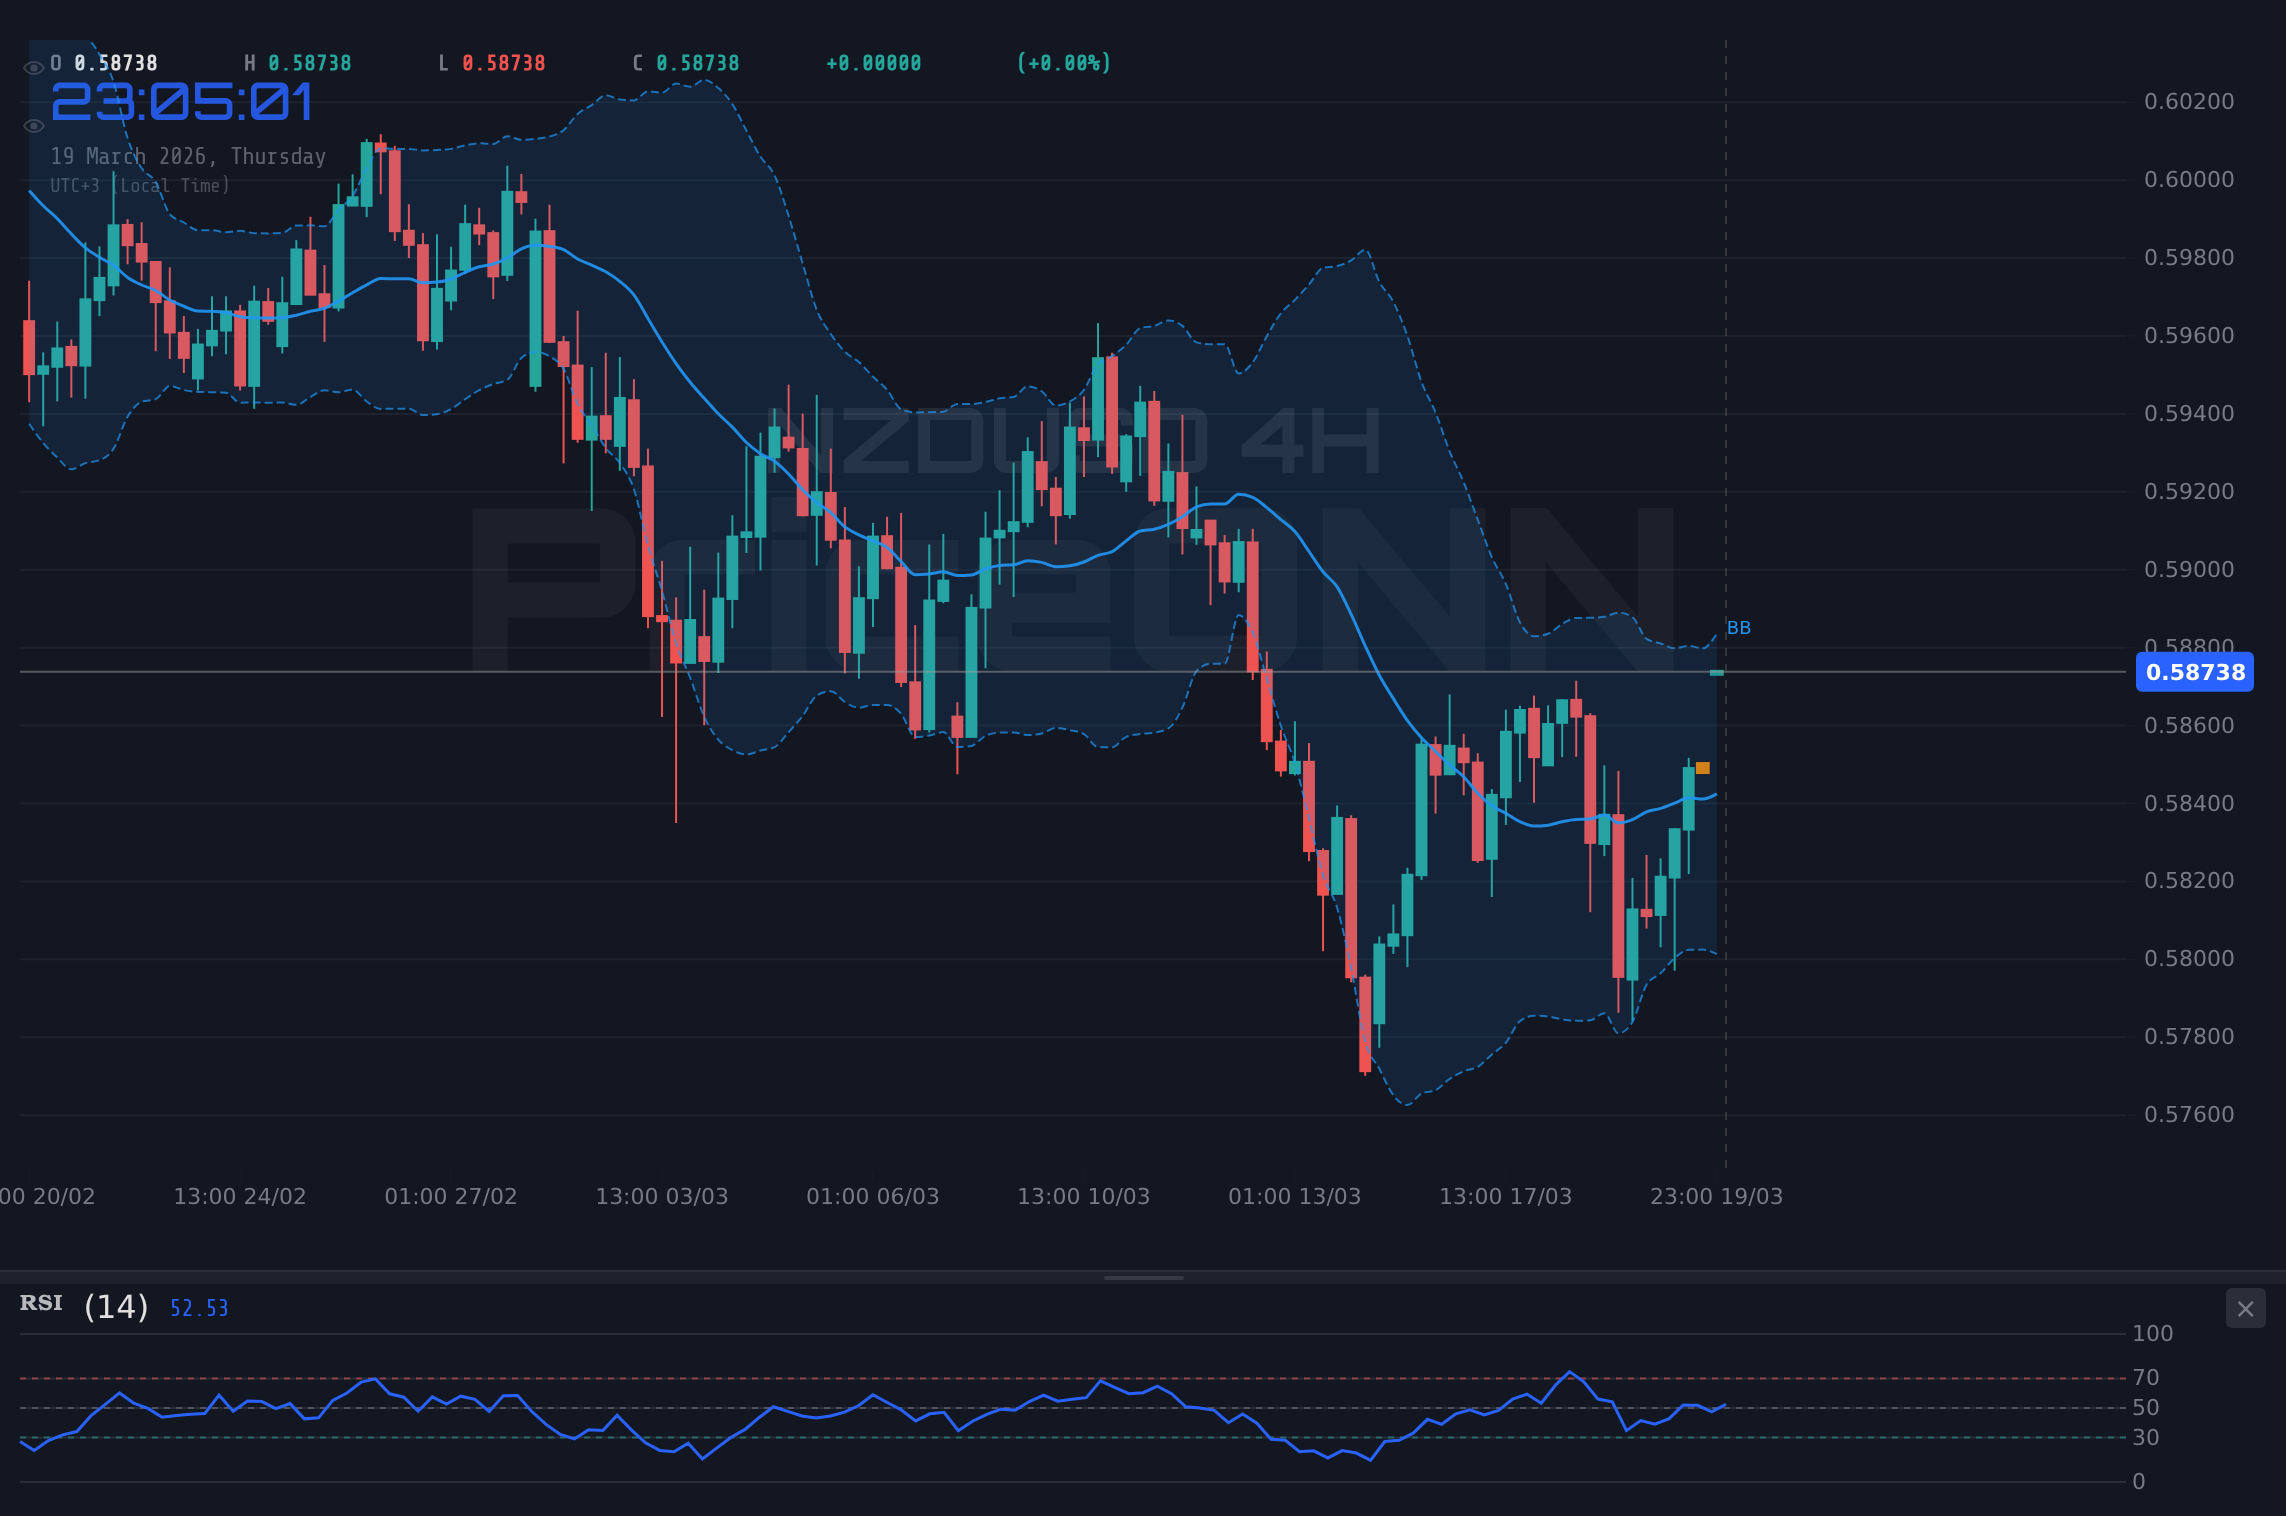
On the 1-hour chart, NZDUSD is showing signs of upward momentum, currently trading at $0.58714. The RSI(14) at 68.93, while indicating a strong upward move, is approaching the overbought threshold of 70, suggesting that the immediate buying pressure might be cooling. This is further reinforced by the Stochastic oscillator (K=91.38, D=81.19), which is firmly in overbought territory, signaling potential exhaustion. The MACD is showing positive momentum, with the MACD line above its signal line, but this needs to be viewed in conjunction with the RSI and Stochastic readings. The ADX at 24.43 indicates a moderate uptrend, suggesting that while there is directionality, it might not be a runaway trend just yet. The Bollinger Bands are trading above the middle band, aligning with the upward bias, but the proximity to the upper band also hints at potential overextension. Support levels on this timeframe are clearly defined at $0.58498, $0.58386, and $0.58329, while resistance is immediately faced at $0.58667, $0.58724, and $0.58836. The immediate price action suggests that breaking through $0.58667 is crucial for the bulls to maintain control.The 4-Hour View: Consolidation and Divergence
The 4-hour chart presents a more nuanced picture for NZDUSD. The trend is classified as neutral with a power of 50%, reflecting a period of consolidation or indecision. The RSI(14) at 47.49 sits in neutral territory, showing a slight downward eğilim, which contrasts with the 1-hour chart's bullish momentum. The MACD is negative, with the MACD line below its signal line, indicating bearish momentum on this timeframe. This divergence between the 1-hour and 4-hour MACD readings warrants attention. The Stochastic oscillator (K=38.49, D=27.36) shows a bullish signal as %K is above %D, but it's not in extreme territory. The ADX at 23.08 suggests a moderate downtrend, which might seem contradictory to the Stochastic's bullish signal. Support is found at $0.7006, $0.69734, and $0.69481, while resistance is marked at $0.70639, $0.70892, and $0.71218. This timeframe highlights a potential battleground where neither bulls nor bears have a clear upper hand, making the $0.58714 level even more critical as a potential turning point.Daily Perspective: Long-Term Trend and Potential Reversals
On the daily chart, NZDUSD exhibits a neutral trend with a power of 50%, but the overall sentiment leans towards caution. The RSI(14) at 53.27 is in neutral territory, slightly favoring a bullish inclination, yet the MACD is negative, with the MACD line below its signal line, suggesting lingering bearish momentum. The Stochastic oscillator (K=50.27, D=50.15) is almost perfectly balanced, indicating a lack of clear direction. The ADX at 21.18 points to a moderate downtrend, reinforcing the idea of a market in flux rather than a clear directional move. Support on the daily chart is located at $0.69913, $0.69517, and $0.68862. Resistance is seen at $0.70964, $0.71619, and $0.72015. The current price of $0.58714 is nestled between these significant daily levels. The daily chart's neutrality, coupled with the mixed signals from indicators, suggests that longer-term traders might be waiting for a clearer directional cue before committing significant capital. The proximity to the daily resistance at $0.70964 is a key factor to monitor for any potential trend reversal.Intermarket Correlations: What Other Markets Tell Us
The Dollar's Dilemma: DXY's Influence on NZDUSD
The US Dollar Index (DXY) is currently trading at $99.01, exhibiting a bearish signal on the 1-hour chart with an ADX of 32.63 indicating a strong downtrend. The RSI(14) at 30.69 is nearing oversold territory, and the Stochastic oscillator (K=12.69, D=11.83) is deeply oversold, suggesting potential for a bounce. However, on the daily timeframe, the DXY shows a strong bullish trend (ADX: 34.58) with RSI at 55.37 and MACD positive. This divergence between short-term bearish signals and a longer-term bullish trend for the dollar creates uncertainty. A sustained drop in the DXY typically supports pairs like NZDUSD. If the dollar continues to weaken, especially if it breaks below the 1-hour support at $98.84, it could provide a significant boost to NZDUSD, potentially helping it break through the immediate resistance near $0.58714. Conversely, any sign of a dollar reversal, supported by its daily trend, could quickly cap upside for NZDUSD.Equities and Risk Appetite: SP500 and Nasdaq's Downward Drag
The performance of major US equity indices, the SP500 and Nasdaq100, provides crucial insight into market risk appetite. The SP500 is trading at 6602, showing a bearish trend on both 1-hour (ADX 43.28) and 4-hour (ADX 21.13) charts. The daily chart also confirms a strong bearish trend (ADX 42.88). Similarly, the Nasdaq100 is at 24347.55, with bearish trends on the 1-hour (ADX 41.79) and daily (ADX 34.44) charts. This widespread decline in equities signals a clear risk-off environment. In such conditions, investors tend to flee riskier assets and seek refuge in perceived safe havens like the US Dollar, Japanese Yen, or even gold (though gold's recent performance is complex). This risk-off sentiment acts as a headwind for NZDUSD, potentially counteracting any positive effects from a weaker dollar and limiting its upside potential, even if it manages to push slightly higher against the greenback.Commodity Divergence: Gold's Plight vs. Oil's Strength
The commodity markets are currently exhibiting a peculiar divergence. Gold, trading at $4,653.34, has seen a sharp decline, with daily RSI at 33.73 and Stochastic deeply oversold. This suggests that the selling pressure might be excessive, but it also indicates a lack of safe-haven demand typically seen in risk-off environments. Brent crude is trading at $107.93, and while the 1-hour chart shows a neutral trend, the daily chart reveals a very strong bullish trend (ADX 63.48) with RSI at 80.59 approaching overbought territory. This rise in oil prices, often linked to geopolitical tensions and inflationary concerns, adds to the market's uncertainty. The combination of falling gold prices and rising oil prices is unusual. It might suggest that inflation fears are overriding safe-haven instincts, or that specific geopolitical events are driving oil prices independently of broader risk sentiment. For NZDUSD, which often has a positive correlation with commodity prices, the strength in oil could provide some support, but the weakness in gold and the overall risk-off equity sentiment might temper this effect.Economic Calendar and Geopolitical Undercurrents
Key Economic Releases and Their Potential Impact
Upcoming economic data releases will be critical in shaping the narrative for NZDUSD. While the provided data does not include specific upcoming events for NZDUSD's currency bloc (NZD or USD), general market sentiment driven by major economies remains influential. For instance, the recent news that the Federal Reserve has maintained its monetary policy unchanged in March, with Chairman Powell signaling greater concern over lingering inflation, is highly relevant. This stance, suggesting a potential delay in rate cuts, could bolster the US Dollar if inflation proves persistent, thereby exerting downward pressure on NZDUSD. Conversely, any indication of a shift in the Fed's tone or a surprise economic downturn in the US could weaken the dollar. Similarly, upcoming data from New Zealand, even if not explicitly listed, will be scrutinized. Stronger-than-expected inflation or employment figures from NZ could provide a floor for the Kiwi, while weaker data would exacerbate downward pressure. Traders must remain vigilant for any scheduled releases from either the US or New Zealand economic calendars.Geopolitical Turmoil: A Persistent Market Influence
The ongoing geopolitical tensions, particularly in the Middle East, continue to cast a long shadow over global markets. Reports of escalating tensions and their impact on oil prices highlight the persistent risk premium in certain markets. This geopolitical uncertainty fuels a general risk-off sentiment, which, as observed in the equity markets, tends to benefit the US Dollar and pressure commodity-linked currencies like the NZD. The news about Europe's economy potentially heading towards stagflation due to war-induced energy disruptions further underscores the fragility of the global economic outlook. Such macro-level instability often leads to increased volatility across all asset classes, including forex. For NZDUSD, this means that geopolitical developments could override purely technical signals, leading to sharp, unexpected moves. The market's reaction to these events, often characterized by a flight to safety, needs to be a primary consideration in any trading strategy.Trade Scenarios for NZDUSD
Bearish Scenario: Downside Breakout
65% ProbabilityNeutral Scenario: Range-Bound Consolidation
25% ProbabilityBullish Scenario: Resistance Breakout
10% ProbabilityMarket Outlook and Actionable Insights
The current technical setup for NZDUSD presents a challenging but potentially rewarding environment for traders. The pair is teetering at a critical resistance level around $0.58714. On the 1-hour chart, indicators like RSI at 68.93 and Stochastic in overbought territory suggest that immediate upside momentum might be losing steam, even as the MACD shows positive momentum. However, the broader context is mixed. A weakening DXY offers potential support, but the risk-off sentiment in equities (SP500, Nasdaq) acts as a significant headwind. The divergence in commodity markets, with gold falling and oil rising, further complicates the outlook, hinting at underlying inflationary pressures and geopolitical risks that could spark flight-to-safety flows. From a risk management perspective, the most probable scenario, given the current ADX readings and the proximity to resistance, is a bearish continuation or consolidation. A breakdown below the immediate 1-hour support at $0.58498 could open the door for further declines, targeting $0.58386 and potentially $0.58329. This aligns with the prevailing risk-off sentiment and the potential for the DXY to find renewed strength from its daily bullish trend. Conversely, a decisive break above $0.58724, supported by strong volume and a clear shift in broader market sentiment, could signal a bullish reversal, targeting $0.58836 and beyond. However, the probability of this scenario appears lower given the current headwinds. Traders should exercise caution and prioritize risk management. The conflicting signals from different timeframes and indicators suggest that a period of consolidation or a sharp move driven by external factors (geopolitics, economic data) is likely. Patience will be key; waiting for a clear break of either the key support or resistance levels, confirmed by broader market movements and indicator confluence, is advisable. The $0.58714 level is not just a price point; it's a battleground where the tug-of-war between a potentially weakening dollar, risk aversion, and commodity price action will likely be decided in the short term.Frequently Asked Questions: NZDUSD Analysis
What happens if NZDUSD breaks decisively above the $0.58724 resistance level?
A sustained move above $0.58724, especially with strong volume and a concurrent weakening of the DXY, could invalidate the bearish short-term outlook. This would likely trigger a bullish scenario targeting $0.58836, potentially extending towards the $0.59000 psychological level, though this remains a lower probability outcome given current market conditions.
Should I consider buying NZDUSD at current levels near $0.58714 given the RSI at 68.93 and Stochastic in overbought territory?
Buying directly at $0.58714 carries significant risk due to the RSI nearing overbought conditions (68.93) and the Stochastic oscillator being deeply in overbought territory (K=91.38). A more prudent approach would be to wait for a pullback to support levels like $0.58498 or confirmation of a breakout above resistance, rather than chasing the current price.
Is the RSI at 68.93 on the 1-hour chart a direct sell signal for NZDUSD?
While an RSI of 68.93 suggests strong upward momentum nearing exhaustion, it is not an immediate sell signal on its own. It indicates caution is warranted for new long positions. A confirmed sell signal would require bearish divergence on the MACD, a break below key intraday support levels, or a significant shift in broader market risk sentiment.
How might the Federal Reserve's stance on inflation affect NZDUSD this week, given the current DXY trend?
The Fed's continued concern over inflation, potentially delaying rate cuts, could strengthen the USD and pressure NZDUSD, especially if the DXY reverses its short-term downtrend. If the DXY breaks above its 1-hour resistance at $99.06, it would likely confirm this bearish pressure on NZDUSD, making a move towards $0.58498 more probable.
Track markets in real-time
AI-powered analysis, technical indicators and real-time price data.
Join Our Telegram Channel
Breaking market news, AI analysis and trading signals instantly.
Join Channel