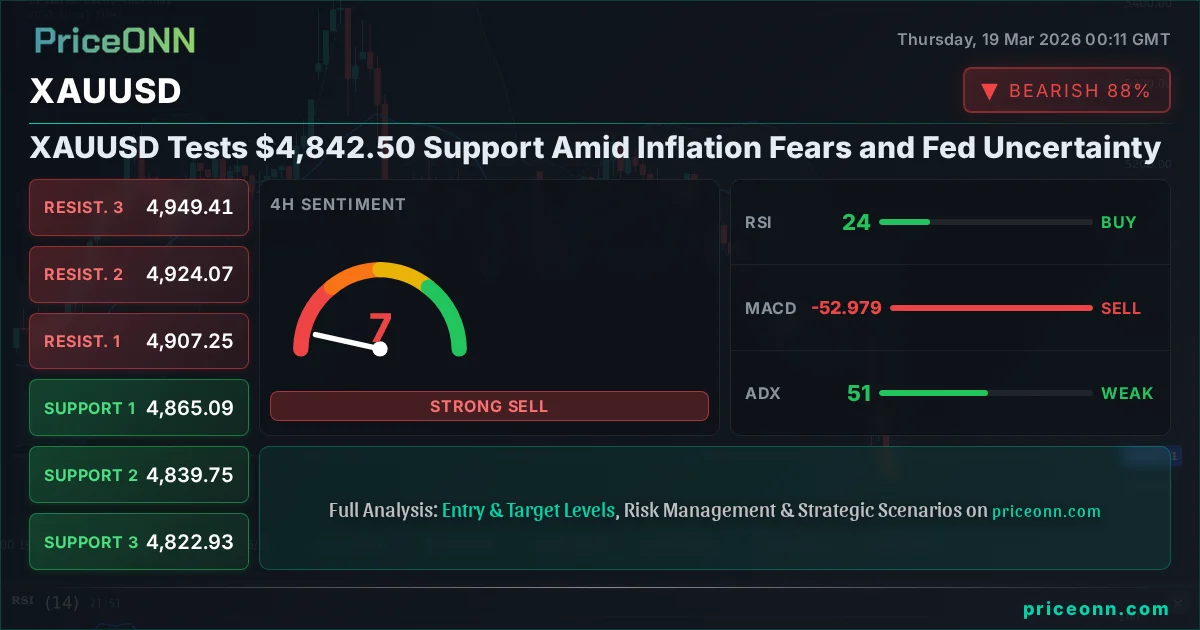
XAUUSD Tests $4,842.50 Support Amid Inflation Fears and Fed Uncertainty
Gold prices are under pressure, trading at $4,842.50 as inflation fears and looming Fed decisions create market volatility. Key levels to watch.
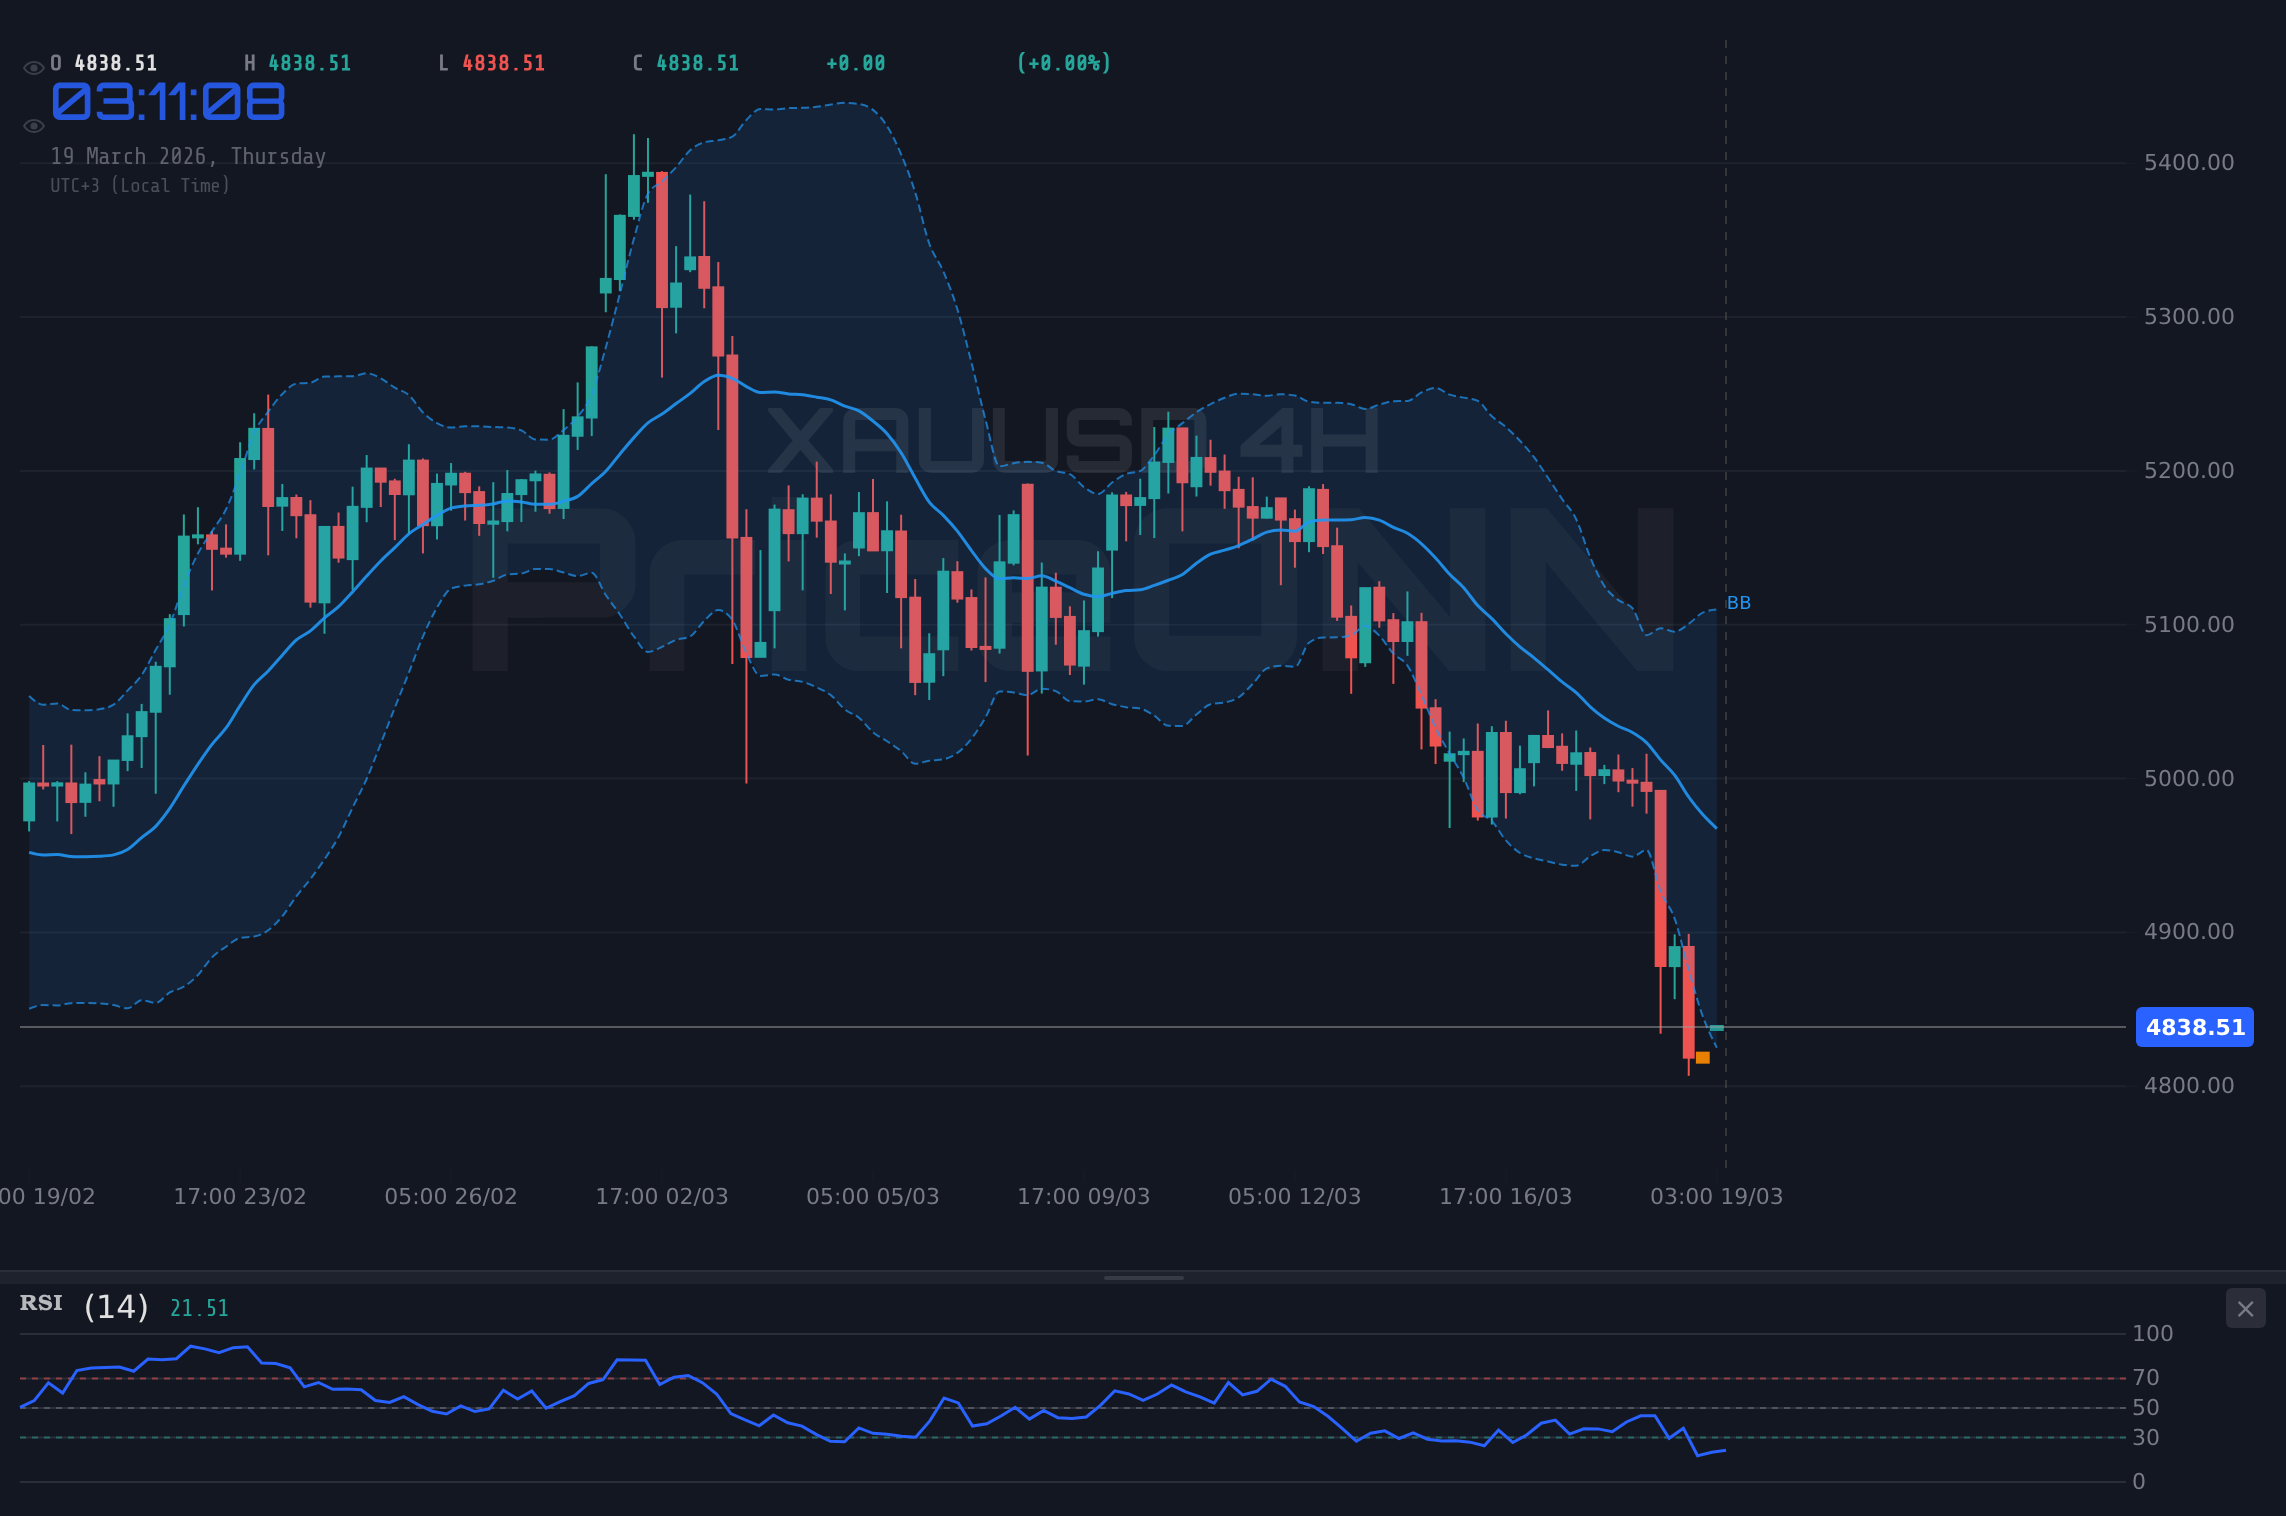
Is gold finally succumbing to the relentless pressure, or is this a classic setup for a bounce? XAUUSD is currently hovering precariously around the $4,842.50 mark, a level that has historically acted as a crucial floor. The sharp 3.3% decline seen recently, pushing prices below the $5,000 psychological barrier, has undoubtedly rattled many investors. But before we panic, let's dive deep into the charts and the broader market context to understand what's really driving this move and what might come next. The narrative is complex, weaving together persistent inflation fears, hawkish central bank signals, and geopolitical tensions that usually bolster safe-haven assets like gold.
- XAUUSD is trading at $4,842.50, testing critical support levels.
- RSI at 29.55 on the 1H chart indicates oversold conditions, suggesting potential for a bounce.
- ADX at 51.36 on the 4H chart confirms a strong downtrend, but oversold RSI might signal a pause.
- The DXY's rise to 99.95 adds pressure, while a falling S&P 500 at 6619.5 could provide some safe-haven support for gold.
- Key resistance to watch is $4,847.18, with support holding firm at $4,813.03.
The Bull's Roadmap: A Potential Rebound at $4,813.03
From a purely technical standpoint, the 1-hour chart paints a picture of oversold conditions. The Relative Strength Index (RSI) is sitting at 29.55, well within the territory that historically signals a potential buying opportunity. When RSI dips below 30, it suggests that the selling pressure may have been overdone, and a reversal could be on the horizon. This is supported by the Stochastic oscillator, where the %K line (27.01) has crossed above the %D line (20.62), a classic bullish crossover signal. The Bollinger Bands on this timeframe are also showing the price hugging the lower band, which can precede a move back towards the middle band. However, we must tread carefully. The ADX at 46.32 still screams 'strong downtrend', meaning any bounce could be short-lived without a broader shift in market sentiment.
If the bulls are to regain control, the immediate focus will be on reclaiming the resistance level at $4,847.18. A sustained move above this point, ideally with increasing volume, would signal the beginning of a potential recovery. The next significant resistance level lies at $4,860.04, and a decisive break above that could open the door for a move towards $4,881.33. This scenario hinges on a shift in the broader market narrative, perhaps driven by a less hawkish tone from the Federal Reserve or a de-escalation of geopolitical tensions. The fact that the S&P 500 is down 1.48% to 6619.5 also adds a layer of complexity; typically, a risk-off environment boosts gold, but the current strong dollar is counteracting that effect.
Expert View
The confluence of oversold indicators on the 1H chart presents a tactical buying opportunity, but the overarching downtrend confirmed by higher timeframe ADX values means risk management is paramount. A close back above $4,847.18 is the first step.
Where Bears Take Control: Testing $4,778.88
On the flip side, the bearish argument is robust, particularly when we look at the 4-hour and daily charts. The 4-hour chart shows a strong downtrend with an ADX reading of 51.36, indicating significant trend strength. Prices are firmly below the middle Bollinger Band, and the RSI at 24.34 is even more deeply oversold than on the 1-hour chart. This suggests that the current price action might be a continuation of the sell-off rather than a temporary dip. The Stochastic oscillator here also favors further downside, with %K (21.81) below %D (31.21).
If the bears maintain their grip, the immediate support level at $4,813.03 will be the first line of defense. A break below this could quickly send prices towards the next support at $4,791.74. The ultimate bearish target, should the selling pressure intensify, would be $4,778.88. This scenario is plausible if upcoming economic data, particularly anything related to inflation or central bank policy, proves to be more hawkish than anticipated. The recent surge in US PPI and the continued strength of the US Dollar Index (DXY), which is nearing the 100.00 level at 99.95, are significant headwinds for gold. A stronger dollar typically makes gold more expensive for holders of other currencies, dampening demand.
The daily chart reinforces this bearish sentiment, with the ADX at 14.48 indicating a weak trend overall, but the RSI at 40.02 and Stochastic K/D lines below 25 still point towards downside potential. While the trend strength is low on this timeframe, suggesting potential consolidation, the immediate pressure remains downwards. The recent news about oil prices surging past $108 for Brent Crude, driven by geopolitical tensions in Iran, is a double-edged sword. While it typically fuels inflation fears and safe-haven demand for gold, the concurrent strength in the dollar and the risk-off sentiment in equities (S&P 500 down 1.48%) seem to be overpowering gold's traditional safe-haven appeal. This divergence is something to watch closely.
Risk Warning
The strong downtrend indicated by the 4H ADX (51.36) suggests that breaking the immediate support at $4,813.03 could lead to a rapid decline towards $4,778.88. Traders should be aware of the potential for sharp moves in either direction given the current market volatility.
The Waiting Game: Consolidation Around $4,822.93?
What if neither the bulls nor the bears can decisively claim victory in the short term? A consolidation scenario is certainly possible, especially if market participants adopt a wait-and-see approach ahead of key economic events, such as upcoming Federal Reserve statements or crucial inflation reports. In such a case, XAUUSD might find itself trading within a range, likely bounded by the immediate resistance at $4,847.18 and the support at $4,813.03. The daily chart's weaker ADX reading of 14.48 could support this view, indicating a lack of strong directional momentum on the longest timeframe.
During a consolidation phase, technical indicators can become less reliable. The RSI might hover around the 50 level, and MACD crossovers could become more frequent but less significant. Price action would likely be choppy, with attempts to break out in either direction being quickly reversed. This period of indecision often occurs when conflicting fundamental forces are at play – for instance, persistent inflation fears supporting gold's appeal as an inflation hedge, while a strong dollar and rising interest rate expectations weigh it down. The market is essentially caught between two opposing narratives, leading to a stalemate until a clear catalyst emerges.
The key to identifying this range-bound environment would be the failure of price to decisively break either the key support or resistance levels mentioned. If XAUUSD fails to hold above $4,813.03, but also fails to break decisively below $4,791.74, we could be entering a period of range trading. Similarly, if attempts to break above $4,847.18 fizzle out near $4,860.04, consolidation becomes more probable. This scenario requires patience, as it often precedes a more significant move once the underlying forces align in one direction.
Market Correlation Watch
The interplay between the US Dollar Index (DXY) and XAUUSD is critical. With the DXY currently at 99.95 and showing signs of strength, it presents a significant challenge for gold. A continued rise in the DXY, especially towards the 100.00 mark, will likely keep gold prices under pressure, even if inflation concerns persist.
The Most Likely Scenario: A Bearish Bias with Caveats
Considering the current technical indicators across multiple timeframes and the prevailing macroeconomic backdrop, the most likely scenario leans bearish, albeit with significant oversold signals on the shorter timeframe demanding caution. The strong ADX readings on the 1H and 4H charts (46.32 and 51.36 respectively) point to a dominant downtrend that is unlikely to reverse without a substantial shift. Furthermore, the persistent strength in the US Dollar Index (DXY) at 99.95, coupled with rising US PPI data and the general risk-off sentiment reflected in the S&P 500's decline to 6619.5, creates a challenging environment for gold.
The probability of a bearish continuation, testing lower support levels, is estimated at around 65%. This is primarily driven by the technical trend strength and the headwinds from a strong dollar and potential for higher-for-longer interest rates. However, the oversold RSI readings on the 1H chart (29.55) cannot be ignored. These suggest that the market is extended to the downside, making a short-term bounce or at least a period of consolidation a distinct possibility. Therefore, a 30% probability is assigned to a neutral scenario where gold trades sideways before its next major move. The bullish scenario, requiring a decisive break of key resistance levels and a shift in macro sentiment, is currently assigned a lower probability of 5% in the immediate term.
Bearish Continuation: Following the Trend
65% ProbabilityConsolidation Phase: Waiting for Clarity
30% ProbabilityBullish Reversal: A Tactical Bounce
5% ProbabilityWhat I'm Watching This Week
My attention is firmly fixed on a few key levels and events that could dictate XAUUSD's next significant move. Firstly, the $4,813.03 support level is paramount. A decisive break below this could accelerate the downtrend, as discussed in the bearish scenario. Conversely, a sustained hold above this level, followed by a push through the $4,847.18 resistance, would signal a potential shift. The market needs to see if the oversold conditions on the 1-hour chart can translate into a meaningful bounce, or if the stronger downtrend signals on the 4-hour chart will prevail.
Secondly, I'll be closely monitoring the US Dollar Index (DXY). Its current strength, nearing the 100.00 mark, is a significant headwind for gold. Any signs of weakness in the DXY, perhaps following dovish commentary from the Fed or a de-escalation in geopolitical tensions, could provide a much-needed tailwind for XAUUSD. Conversely, further strengthening of the dollar would likely reinforce the bearish outlook.
Finally, the upcoming economic calendar, particularly any commentary from Federal Reserve officials or key inflation data releases, will be crucial. While this article focuses on the technical picture, unexpected news on the inflation front or signals about future monetary policy could easily override technical levels. Traders should remain vigilant and prepared for volatility. Remember, patience and disciplined risk management are your greatest allies in these choppy markets.
Frequently Asked Questions: XAUUSD Analysis
What happens if XAUUSD breaks below the $4,813.03 support level?
If XAUUSD breaks decisively below $4,813.03, the bearish scenario gains significant probability. This could trigger a rapid decline towards the next support at $4,791.74, with a further test of $4,778.88 a distinct possibility as strong downtrend momentum continues.
Should I buy gold at current levels around $4,842.50 given the oversold RSI?
While the 1-hour RSI at 29.55 suggests oversold conditions, the stronger bearish trend signals on higher timeframes warrant caution. A tactical bounce is possible, but a confirmed bullish trigger like a close above $4,847.18 with MACD confirmation would be a safer entry point, carrying a lower probability but higher confirmation.
Is the RSI at 29.55 a sell signal for XAUUSD right now?
An RSI reading of 29.55 is technically in the oversold territory, typically signaling a potential bounce rather than a sell signal. However, in the context of a strong downtrend (ADX 51.36 on 4H), it suggests that the current selling pressure might be nearing exhaustion, but not necessarily reversing direction without further confirmation.
How will the strong DXY at 99.95 affect XAUUSD this week?
The current strength of the DXY at 99.95 acts as a significant headwind for XAUUSD. A sustained rise in the dollar typically makes gold more expensive for foreign buyers, potentially capping any upside attempts and reinforcing the bearish pressure on gold prices, especially if inflation data remains elevated.
Technical Outlook Summary
| Indicator | Value | Signal | Interpretation |
|---|---|---|---|
| RSI (14) | 29.55 | Oversold | Potential bounce signal on 1H, but downtrend persists on higher TFs. |
| MACD | Negative | Bearish | Momentum is negative, below signal line across timeframes. |
| Stochastic | K:27.01, D:20.62 | Bullish Crossover | Suggests short-term upward momentum, but needs confirmation against trend. |
| ADX | 46.32 | Strong Trend | Confirms a robust downtrend on the 1H chart, overriding short-term signals. |
| Bollinger | Middle Band | Below | Price is below the middle band, indicating bearish pressure. |
Key Levels
Support Levels
Resistance Levels
Track markets in real-time
AI-powered analysis, technical indicators and real-time price data.
Join Our Telegram Channel
Breaking market news, AI analysis and trading signals instantly.
Join Channel