BRENT Crude Tests $102.56 Support: Is $105.47 the Next Target?
BRENT crude is holding at $102.56. With mixed signals and key levels in play, traders are watching closely to see if a move towards $105.47 resistance is imminent.
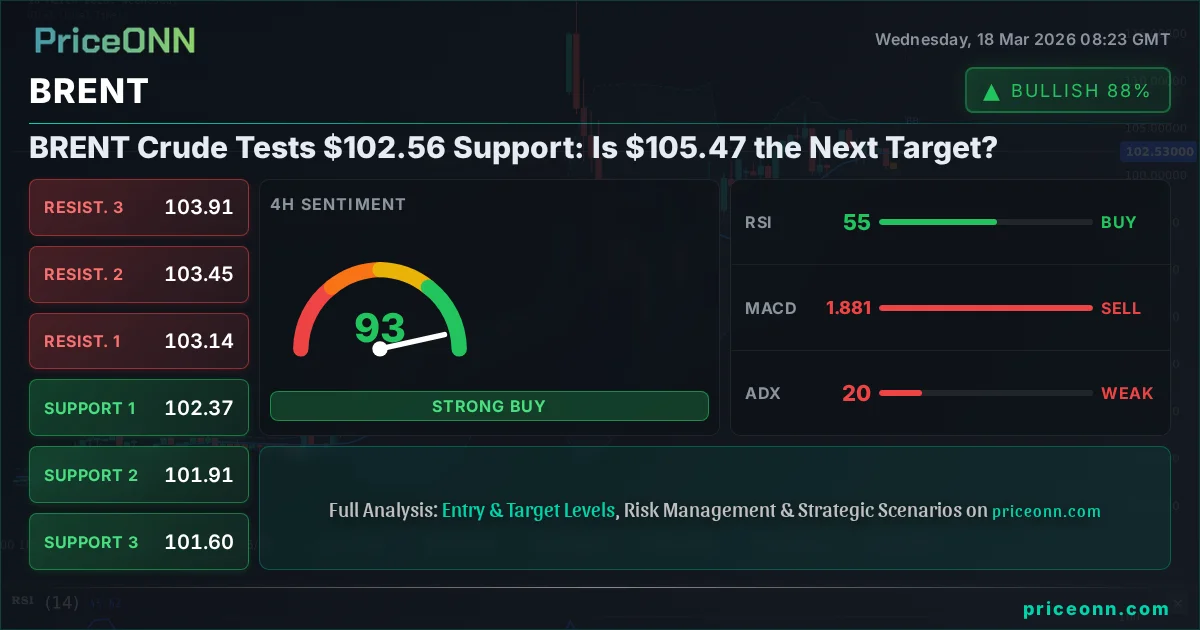
Brent crude is currently hovering around the critical $102.56 mark, a level that has become a focal point for market participants. This price point represents a confluence of technical indicators and fundamental drivers, making it a crucial juncture for determining the near-term direction of oil prices. The market is at a crossroads, with conflicting signals suggesting a potential for either a renewed upward push towards resistance levels or a continuation of the recent pullback. Understanding the interplay between global risk sentiment, geopolitical tensions, and the technical landscape is paramount for navigating this complex environment. As traders digest recent economic data and anticipate central bank policy shifts, the $102.56 level for BRENT becomes more than just a price; it's a psychological barrier and a key determinant of future market movements.
- With RSI at 50.46 on the 1H chart, momentum is balanced, indicating a neutral stance ahead of potential breakouts.
- Critical support sits at $100.89, a level that has shown resilience in recent trading sessions.
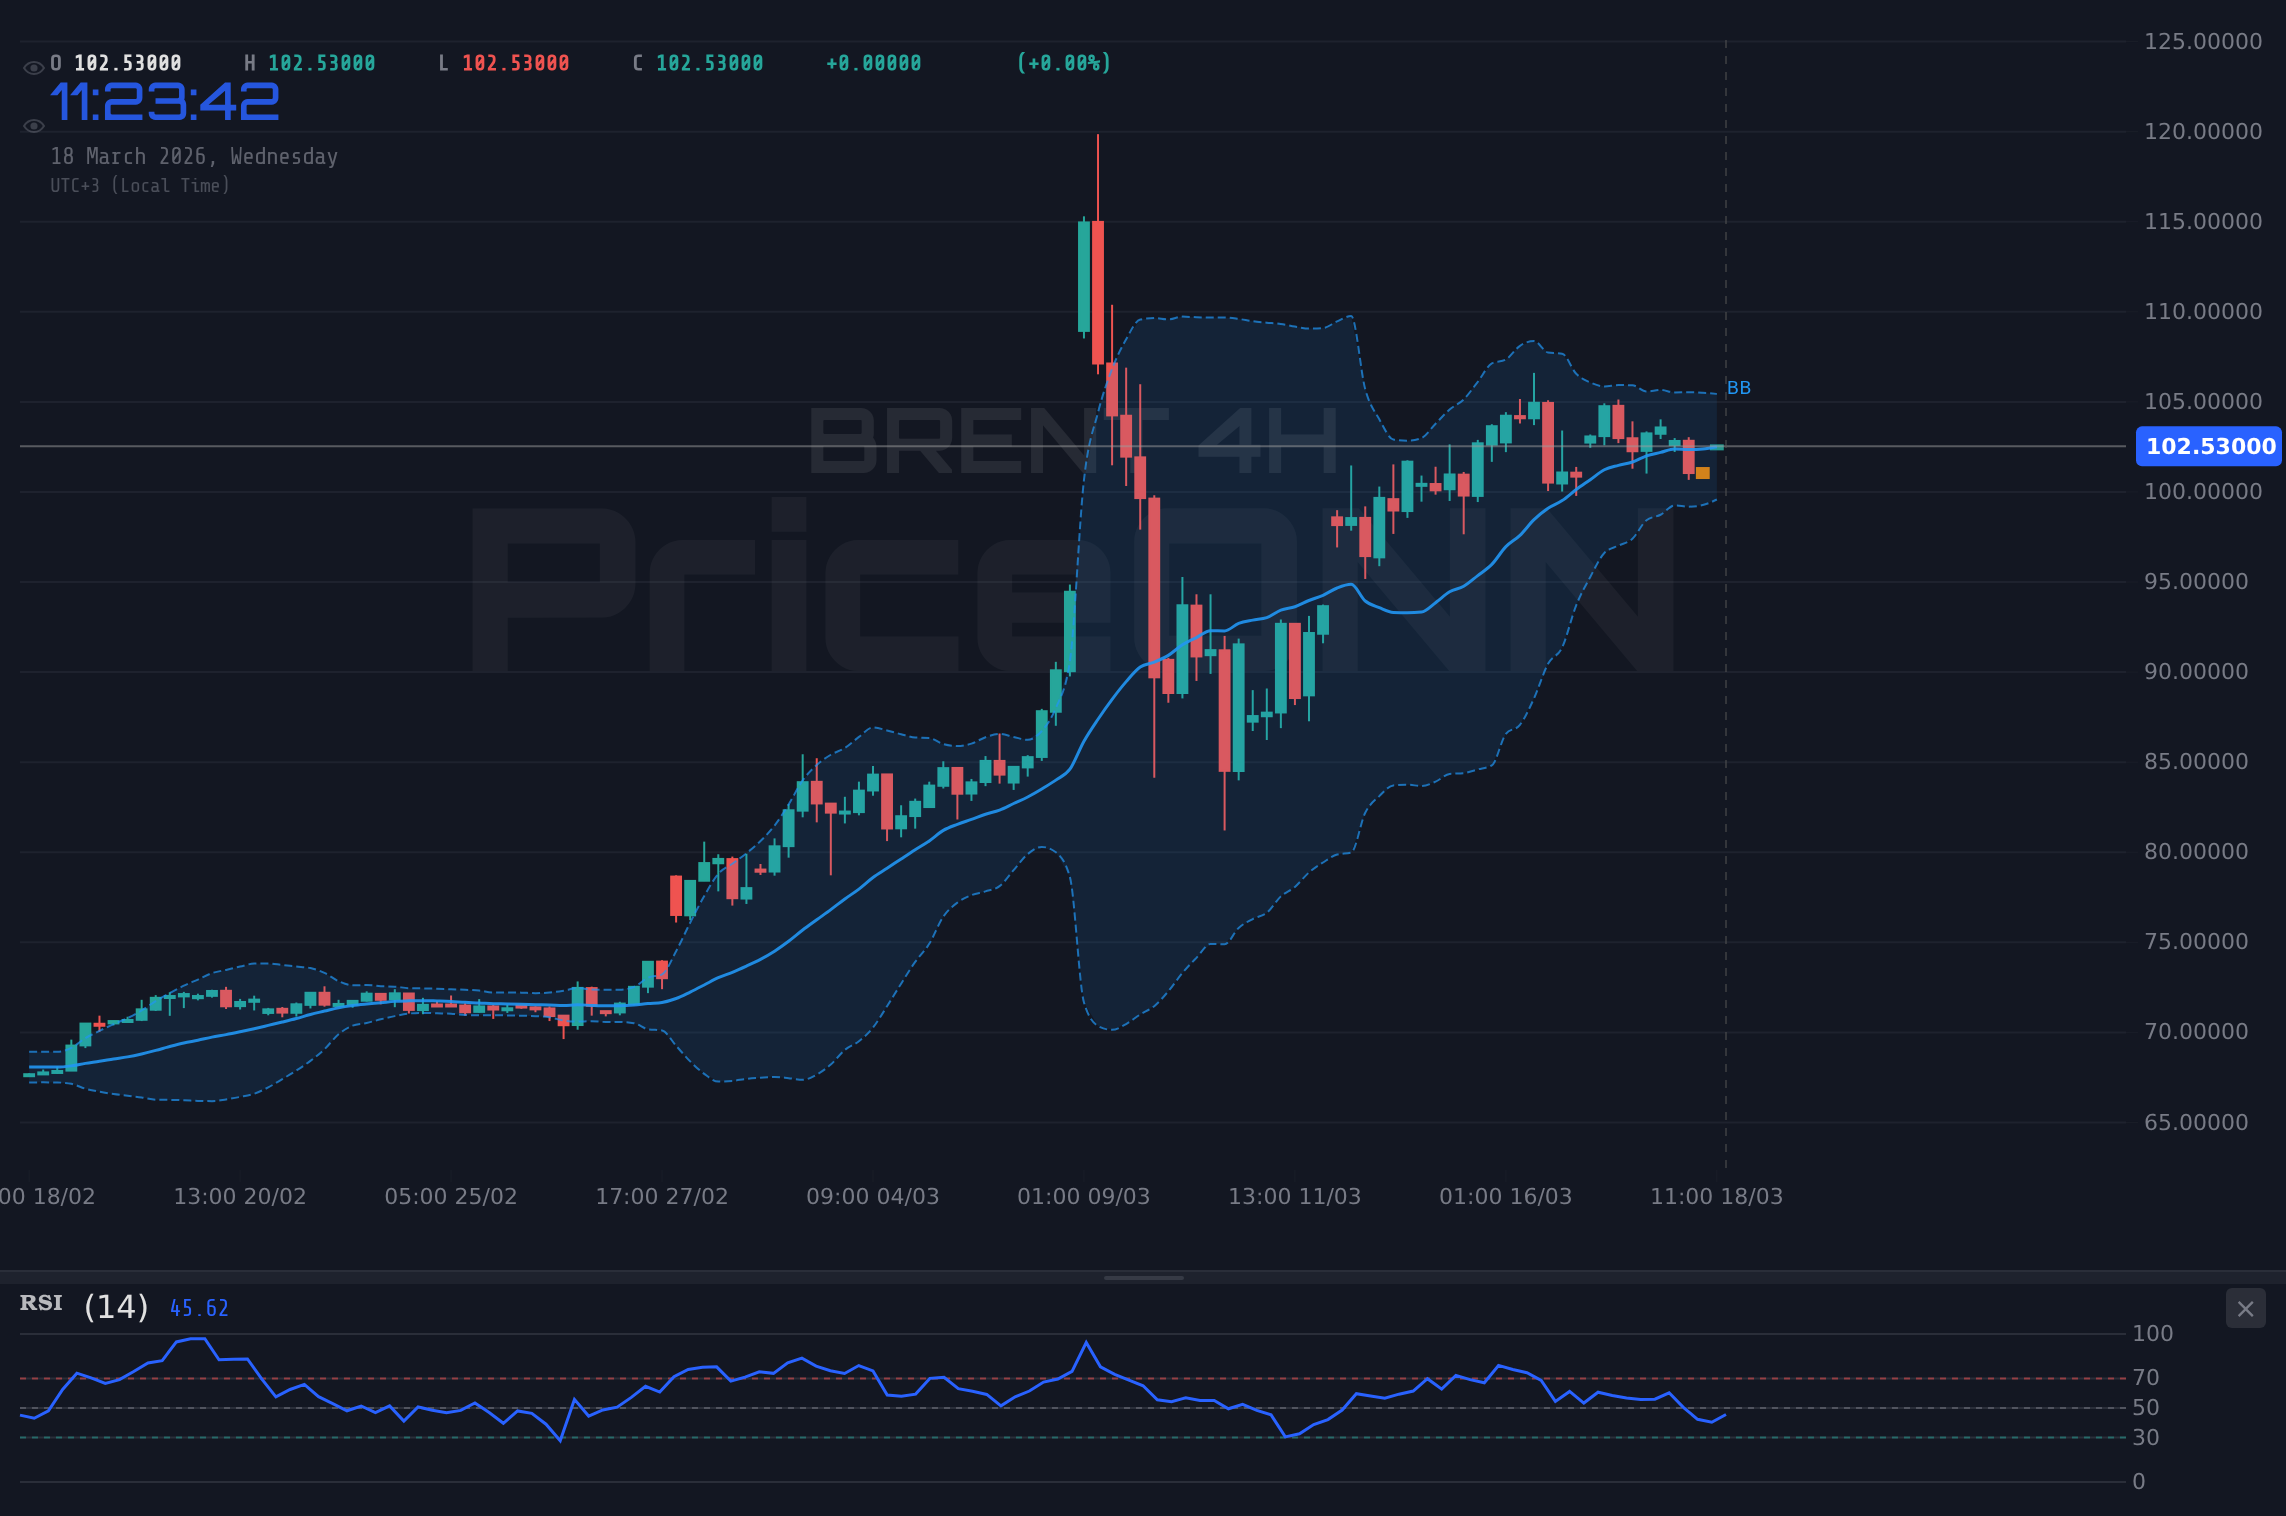
- The ADX at 19.78 on the 4H chart suggests a choppy, ranging market, making breakouts risky without further confirmation.
- Brent's correlation with rising DXY levels at 99.41 is putting downward pressure on oil prices, though geopolitical risks remain a bullish undercurrent.
The Bull's Roadmap: Navigating Towards $105.47
For bulls to regain firm control and push BRENT towards the significant resistance at $105.47, several conditions need to align. The immediate hurdle lies at the $102.37 level on the 1-hour chart, which has acted as immediate resistance. A decisive break and hold above this price is the first step. This would likely be catalyzed by a surge in risk appetite globally, potentially signaled by a rally in US equity indices like the S&P 500, currently trading around 6753.05, and the Nasdaq at 24946.76. If equities show strength, it would suggest a 'risk-on' environment, which typically benefits commodities like oil. Furthermore, a weakening US Dollar Index (DXY), currently showing mixed signals around 99.41 but with a daily uptrend, would provide additional tailwinds. On the technical front, a sustained move above the 1-hour Bollinger's middle band, coupled with a rising RSI above 60, would strengthen the bullish case. The Stochastic oscillator on the 1-hour chart is already showing a bullish crossover (K=36.56, D=29.18), hinting at potential upside momentum, although the ADX at 16.8 suggests the trend is not yet strongly established. A successful push past $102.37 would then target the next resistance at $102.90, followed by the more significant $103.85. Breaking through this latter level would open the door for a potential move towards $105.47, which represents a substantial upside target on the daily chart resistance. This scenario hinges on positive geopolitical developments or a significant shift in central bank hawkishness to dovishness, which seems unlikely given current inflation concerns. The 4-hour chart also shows a buy signal with RSI at 55.07, supporting a bullish outlook if the price can break free from the current consolidation.
However, this bullish path is not without its challenges. The daily chart presents a more cautious picture. While the ADX at 61.26 indicates a very strong uptrend, the RSI at 79.03 is deep in overbought territory, suggesting that any further gains could be met with significant profit-taking. The Stochastic on the daily chart (K=54.89, D=52.75) is also showing a potential bearish divergence, hinting that the current uptrend might be losing steam. For the bullish scenario to materialize fully, this overbought condition needs to be resolved through either a period of consolidation or a price pullback that does not break key support levels. The confluence of technical signals across different timeframes paints a picture of caution: while the short-term charts hint at upside potential, the longer-term outlook suggests that the market might be due for a correction or at least a pause in the rally. The key here is confirmation; a sustained break above $103.85, supported by increasing volume and positive news flow, would be the confirmation needed to target higher levels.
Where Bears Take Control: The Case for a Pullback to $100.89
Conversely, the bearish scenario hinges on the failure of key support levels and a resurgence of 'risk-off' sentiment. The immediate price action on the 1-hour chart shows BRENT trading below the middle Bollinger band, with the RSI at 50.46 pointing to a lack of conviction. If the price fails to hold above the $102.37 resistance and instead breaks down below the $101.91 level on the 4-hour chart, the bears could quickly take charge. This breakdown would likely be exacerbated by negative geopolitical news, such as de-escalation in a conflict zone or a surprise build in US crude oil inventories, which saw a significant unexpected build of 6.556 million barrels recently. Such news could trigger a sell-off, pushing BRENT towards its first significant support at $100.89. This level is a key psychological and technical floor, and a break below it would confirm a bearish shift. The ADX on the 1-hour chart, while currently at 16.8, could accelerate upwards if a strong downtrend begins, indicating increasing bearish momentum. The MACD on the 1-hour chart is already showing negative momentum, reinforcing the potential for a downward move. On the 4-hour chart, the Stochastic (K=60, D=54.33) is showing a bullish signal, but if the price breaks down, this could quickly reverse into a bearish signal. The daily chart, with its strong uptrend (ADX 61.26) but overbought RSI (79.03), is particularly vulnerable to a sharp pullback. A break below $100.89 would then target the next support at $99.94, and potentially even the $99.41 level. This bearish outlook is supported by the fact that the daily Stochastic is showing a potential bearish divergence. If the DXY strengthens significantly, perhaps due to hawkish rhetoric from the Federal Reserve, it would further pressure BRENT prices.
The fundamental backdrop also supports a bearish case if certain conditions are met. Fears of a global economic slowdown or a significant drop in demand for oil could easily shift market sentiment. While current geopolitical tensions in the Middle East and the Strait of Hormuz are providing a floor, any perceived de-escalation or resolution could remove a significant bullish catalyst. Furthermore, if major central banks, particularly the Federal Reserve, signal a prolonged period of higher interest rates to combat stubborn inflation, this would dampen economic activity and, consequently, oil demand. The 1-hour MACD is already in negative territory, and a break below the $100.89 support level would likely see this momentum accelerate, potentially leading to a swift move towards $99.94 and then $99.41. The market is sensitive to these macro shifts, and a combination of weakening global growth and easing geopolitical fears could easily send BRENT prices lower. The 1-hour chart's Stochastic shows a potential for a brief upward correction before a larger move down, but the overall trend on the 4-hour and daily charts, despite recent strength, shows underlying vulnerability.
The Waiting Game: Range-Bound Dynamics at $102.56
It's entirely plausible that BRENT crude will remain range-bound, with price action oscillating around the $102.56 level for the foreseeable future. This scenario typically occurs when bullish and bearish forces are in equilibrium, or when market participants are hesitant to commit to a significant directional move due to uncertainty. On the technical side, the ADX readings across multiple timeframes (1H: 16.8, 4H: 19.78, 1D: 61.26 - though this is a strong trend reading) suggest a lack of a clear, strong trend on the shorter timeframes, favoring consolidation. The 4-hour ADX of 19.78 is particularly indicative of a choppy, non-trending market. In such an environment, price tends to oscillate between defined support and resistance levels. The immediate support is at $100.89, and the resistance is around $103.85 on the 1-hour chart. If BRENT remains trapped between these levels, traders might look for range-bound strategies, buying near support and selling near resistance, though the tight intraday ranges limit the potential for significant profits. The RSI readings across timeframes (1H: 50.46, 4H: 55.07, 1D: 79.03) also paint a mixed picture. While the daily RSI is extremely high, the shorter-term readings suggest indecision or a neutral stance, which is characteristic of range-bound markets.
Fundamentally, this range-bound scenario could be driven by conflicting macroeconomic signals and geopolitical uncertainties. For instance, the Federal Reserve might maintain a hawkish stance on inflation, which would typically pressure oil prices, while simultaneously, escalating geopolitical tensions in the Middle East could provide a constant underlying bid. These opposing forces could effectively neutralize each other, keeping BRENT prices within a defined range. The market might also be waiting for clearer direction from upcoming economic data releases, such as inflation reports or employment figures, or from central bank meetings. Until a significant catalyst emerges to break this equilibrium, BRENT could continue to trade sideways. The MACD indicator on the 1-hour chart is currently negative, but the 4-hour MACD is also negative, and the daily MACD is positive, highlighting the conflicting signals. This divergence across timeframes often leads to choppy price action. The key price levels to watch in this range-bound scenario are the $100.89 support and the $103.85 resistance. A failure to break decisively above $103.85 might lead to a retest of the lower bounds, while holding above $100.89 could see a bounce towards the upper range.
The Most Likely Scenario: A Cautious Outlook
Considering the current data, the most likely scenario for BRENT crude in the immediate short term (next 1-3 days) leans towards a cautious, potentially range-bound or slightly bearish outlook, with a probability of around 55%. While there are bullish undertones on the 1-hour chart, the conflicting signals on the daily timeframe, particularly the extremely overbought RSI (79.03) and the strong ADX (61.26) indicating a powerful but potentially topping trend, suggest that further upside may be limited. The bearish divergence on the daily Stochastic adds to this caution. The recent unexpected build in US oil inventories and the general uncertainty surrounding central bank policy further support a more conservative approach. Geopolitical tensions provide a floor, but they might not be enough to drive prices significantly higher without a clear catalyst or a sustained shift in global risk sentiment towards 'risk-on'. Therefore, the market might consolidate or even experience a mild pullback towards the $100.89 support level before any potential larger move can be confirmed. A break above $103.85, sustained by strong volume and positive news, would be needed to invalidate this cautious bias and open the path towards $105.47. Until then, expect choppiness and a battle between the bulls and bears around the $102.56 mark.
The 4-hour chart offers a slightly more balanced view with an ADX of 19.78, suggesting range-bound conditions are more probable in the medium term. The Stochastic on this timeframe is showing a bullish signal, but the overall 'General Signal' across all timeframes is leaning towards 'SELL' (Al: 5, Sat: 3, Nötr: 0 for 1H, Al: 6, Sat: 2, Nötr: 0 for 4H, Al: 7, Sat: 1, Nötr: 0 for 1D). This aggregate signal, despite the strong daily uptrend, points to a potential short-term reversal or consolidation. The probability of a sustained rally towards $105.47 in the next 72 hours is likely less than 40%, given the technical headwinds and the lack of clear fundamental drivers for a significant demand surge. Conversely, a sharp move below $100.89, triggered by negative news or a strong USD, could see a 30-35% probability of reaching the $99.94 level. The remaining probability rests on the consolidation scenario, where prices remain trapped between $100.89 and $103.85.
What I'm Watching This Week
My attention is sharply focused on a few key triggers that will likely dictate BRENT's path in the coming days. Firstly, the price action around the $102.37 and $103.85 resistance levels on the 1-hour and daily charts, respectively, is critical. A failure to break and sustain above these levels, especially the latter, would reinforce the bearish or range-bound outlook. Secondly, I'll be monitoring the US Dollar Index (DXY) closely. With DXY currently at 99.41 and showing a daily uptrend, any further strength in the dollar, potentially fueled by hawkish Fed commentary, could add significant downward pressure on BRENT. Conversely, a sharp decline in the DXY would be a bullish signal for oil. Lastly, any significant developments regarding geopolitical tensions in the Middle East or major shifts in global oil demand forecasts will be crucial. News related to OPEC+ production decisions or unexpected inventory reports will also be closely watched. These factors, combined with the technical picture, will determine whether BRENT can overcome its current challenges and target higher levels, or if a pullback is on the cards.
The market sentiment indicators, such as the S&P 500 (6753.05) and Nasdaq (24946.76), will also be key. A sustained rally in equities would signal a 'risk-on' environment, potentially lifting oil prices. However, if these indices falter, it could signal a broader market correction, dragging BRENT down with them. The interplay between these macro factors and the specific technical levels will provide the clearest signals. For instance, if BRENT breaks above $103.85 resistance while the DXY is falling and equities are rising, that would be a high-conviction bullish setup. Conversely, a break below $100.89 support with a strengthening DXY and falling equities would signal a strong bearish move. The price action around $102.56 remains the immediate battleground, and observing how traders react to these levels will offer valuable insight into the market's immediate intentions.
| Indicator | Value | Signal | Interpretation |
|---|---|---|---|
| RSI (14) | 50.46 | Neutral | Balanced momentum on 1H, overbought on 1D |
| MACD Histogram | -0.29 | Bearish | Negative momentum on 1H & 4H |
| Stochastic | K=36.56, D=29.18 | Bullish | Bullish crossover on 1H, but potential divergence on 1D |
| ADX | 16.8 | Weak Trend | Choppy market conditions on 1H |
| Bollinger | Middle Band | Watch | Price is below middle band on 1H, above on 4H & 1D |
Frequently Asked Questions: BRENT Analysis
What happens if BRENT breaks above $103.85 resistance?
A sustained break above $103.85 on the 1-hour chart, especially with increasing volume and positive news flow, could signal a bullish continuation. This would likely target the next resistance level at $105.47, supported by a risk-on sentiment and a weaker USD.
Should I buy BRENT at current levels of $102.56 given the mixed signals?
Buying at $102.56 is risky due to conflicting signals. The daily RSI is overbought at 79.03, and the 4H ADX at 19.78 indicates choppy conditions. A more prudent approach would be to wait for a clear break above $103.85 or a pullback to support near $100.89 for a better risk-reward setup.
Is the RSI at 50.46 a sell signal for BRENT right now?
An RSI of 50.46 on the 1-hour chart indicates neutral momentum, not an immediate sell signal. However, combined with the negative MACD momentum and the daily chart's overbought conditions, it suggests caution. A confirmed break below the $100.89 support would be a stronger bearish signal.
How will the upcoming Fed decision affect BRENT crude oil prices this week?
If the Federal Reserve signals a hawkish stance or maintains higher interest rates due to inflation concerns, it could strengthen the USD (DXY at 99.41) and put downward pressure on BRENT. Conversely, any dovish hints could weaken the dollar and support oil prices, potentially aiding a move towards $105.47.
Track markets in real-time
AI-powered analysis, technical indicators and real-time price data.
Join Our Telegram Channel
Breaking market news, AI analysis and trading signals instantly.
Join Channel