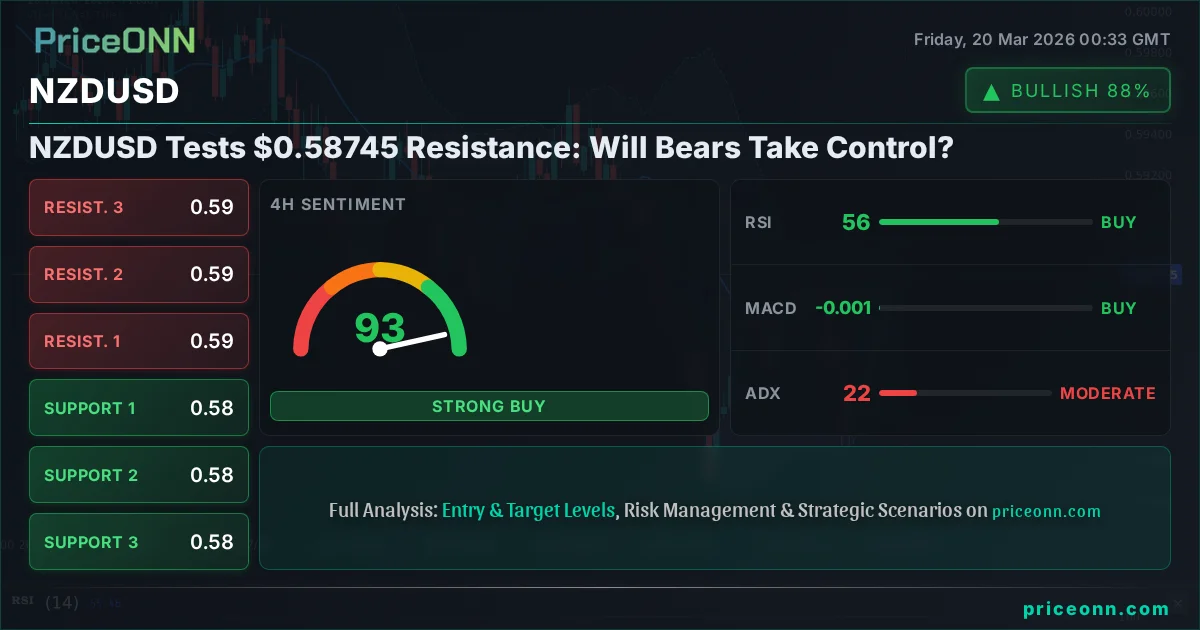
NZDUSD Tests $0.58745 Resistance: Will Bears Take Control?
NZDUSD struggles at $0.58745 resistance, with a strong dollar and weakening risk appetite favoring bears. Explore key levels and scenarios.
The currency pair NZDUSD is currently testing a critical resistance zone around $0.58745, and the question on many traders' minds is whether the bears will finally seize control or if the bulls can muster a renewed push. This analysis delves into the intricate dance between bullish and bearish forces shaping NZDUSD's trajectory, examining the technical indicators, macroeconomic undercurrents, and geopolitical factors that are likely to dictate its next move. With the Dollar Index (DXY) showing signs of strength and risk sentiment wavering, the pressure is mounting on risk-sensitive currencies like the New Zealand Dollar.
- RSI at 64.59 on the 1H chart signals strengthening bullish momentum, but caution is advised as it approaches overbought territory.
- The critical resistance level for NZDUSD is currently pegged at $0.58862, a break above which could signal a shift in trend.
- ADX readings across multiple timeframes suggest a developing trend, with 1H at 24.1 and 4H at 22.1 indicating moderate strength.
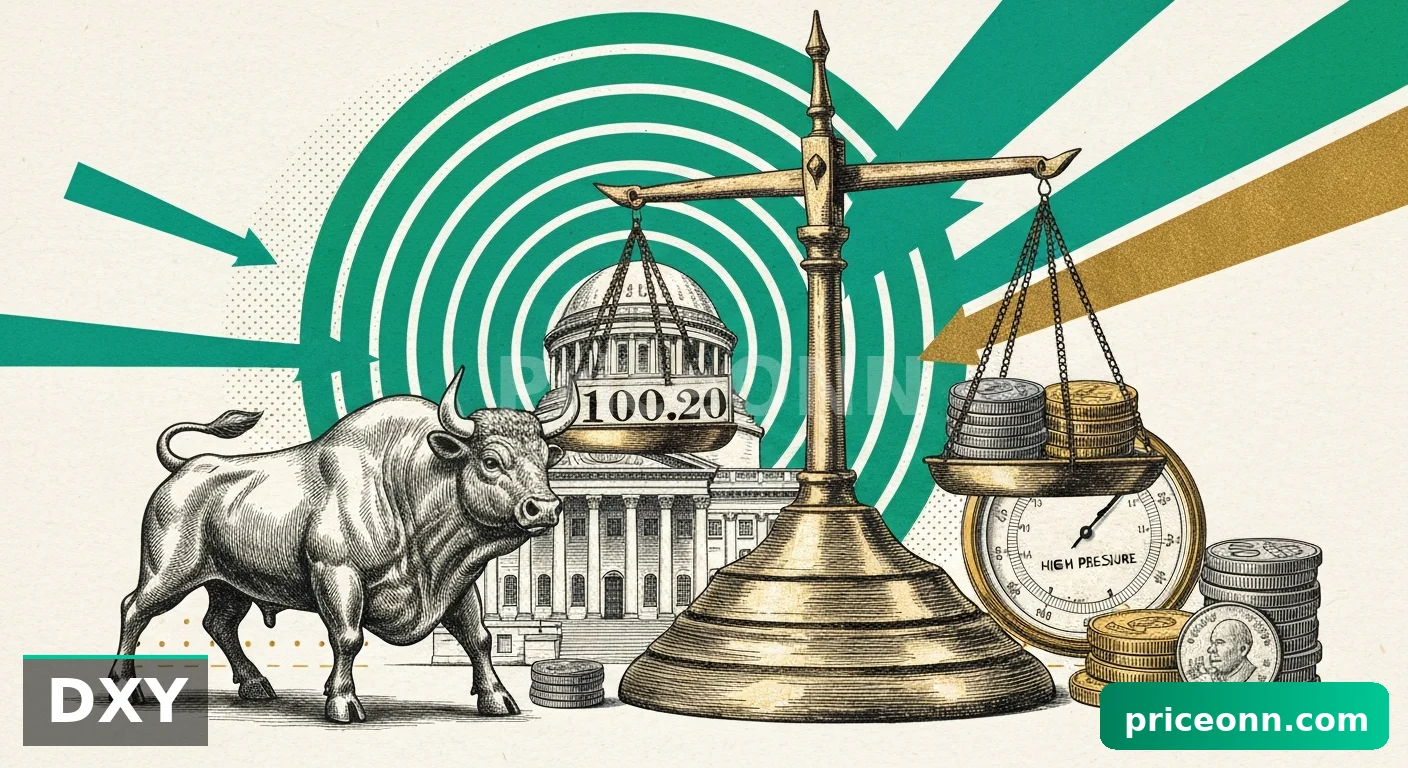
- The correlation with a strengthening DXY (currently 99.09) and a cautious S&P 500 (6617.15) paints a mixed picture, demanding careful risk management.
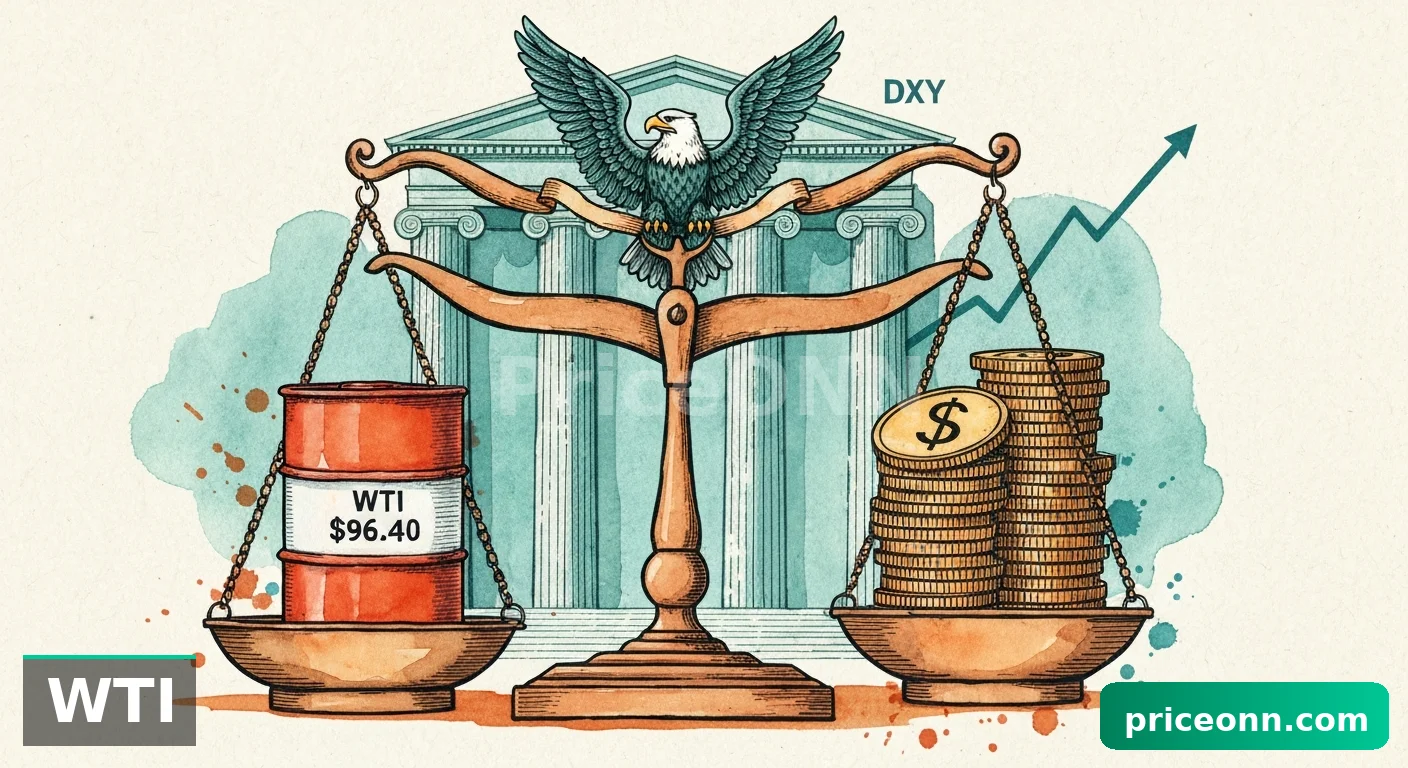
The interplay between the New Zealand Dollar and the US Dollar is often a barometer for global risk appetite. As we navigate a period marked by geopolitical tensions and shifting central bank expectations, understanding this dynamic is paramount. The recent tumble in gold prices, falling to $4,649.89, and the sharp decline in WTI crude oil to $94.70, suggest a potential move away from riskier assets, which could embolden the bears in pairs like NZDUSD.
On the 1-hour chart, NZDUSD is showing resilience, with a General Signal of 'BUY' from 7 out of 8 indicators. The RSI(14) stands at 64.59, indicating healthy upward momentum, though it's approaching the overbought threshold of 70. This suggests that while buyers are in control in the short term, the pair might be getting stretched. The MACD is showing positive momentum, and Stochastic is in the upper range, further supporting a bullish short-term outlook. However, the ADX at 24.1 points to a moderately strong trend, not yet a runaway one, suggesting that the current upward move might face significant headwinds.
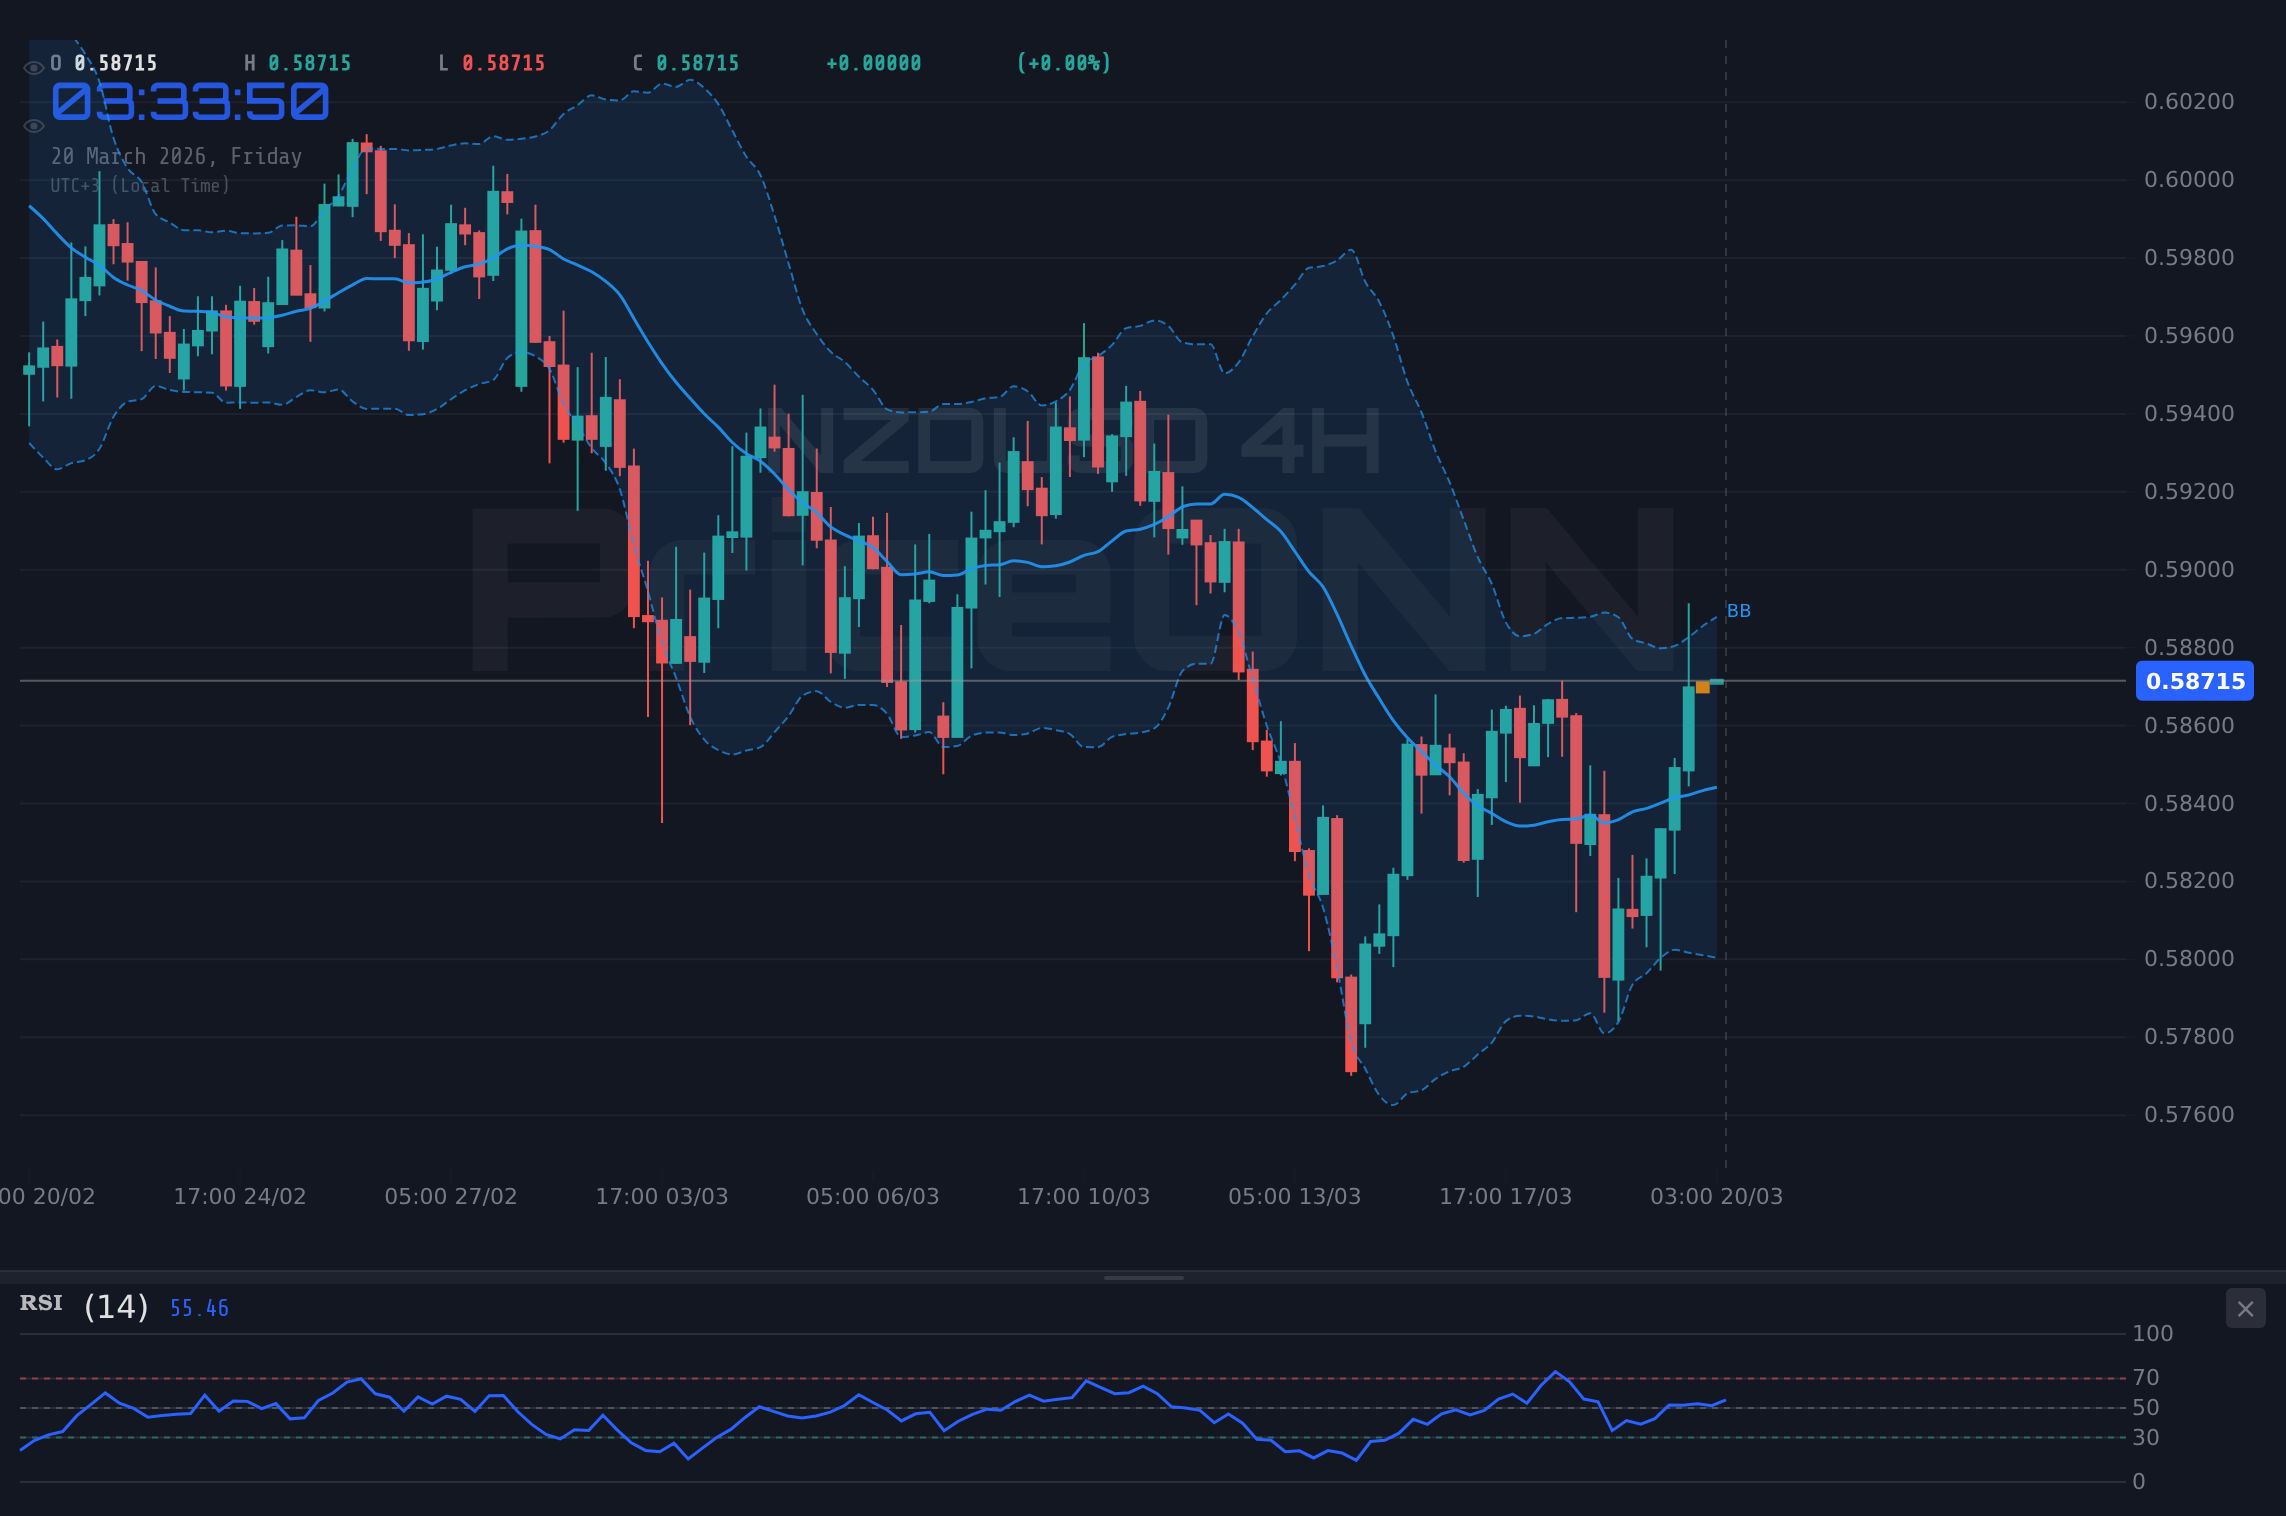
Zooming out to the 4-hour timeframe, the picture becomes more nuanced. The General Signal shifts to 'BUY' with a strong 7 out of 8 indicators, yet the trend is classified as 'Düşüş' (Downtrend) with 86% strength. This divergence is crucial. It implies that while recent price action has been positive, the longer-term structure might still favor sellers. The RSI(14) at 56.46 is in neutral territory, and the MACD is showing negative momentum, contradicting the 1H chart. The Stochastic is signaling a potential buy, but the ADX at 22.1 still points to a developing, rather than established, trend. This conflict highlights the importance of not relying on a single timeframe or indicator.
Navigating the Dollar's Strength
The US Dollar Index (DXY) currently sits at 99.09, and its recent movements are a significant factor for NZDUSD. A rising DXY typically puts downward pressure on risk-sensitive currencies like the Kiwi. The DXY's 1-hour and 4-hour charts show a 'SELL' signal, indicating a short-term pullback, which could offer temporary relief to NZDUSD. However, the DXY's daily chart shows a strong 'BUY' signal and a robust uptrend. This suggests that the dollar's broader strength might persist, creating a challenging environment for the New Zealand Dollar in the medium to long term. The fact that the DXY is trading below its 1-hour middle Bollinger band also points to potential short-term consolidation, but the overall daily trend strength cannot be ignored.
This broader dollar strength narrative is amplified by the recent commentary from Federal Reserve officials, which has significantly dampened expectations for interest rate cuts in 2026. This hawkish stance from the Fed tends to support the dollar by making US interest rates more attractive relative to other major economies. While the SNB, BoE, and ECB are expected to hold their rates steady, the Fed's potential delay in easing could give the USD a structural advantage, putting NZDUSD under constant pressure. The market is keenly watching for any communication that might further solidify or alter these rate cut expectations.
Gold's Plight and Risk Sentiment
The dramatic fall in gold prices, down 3.5% to $4,649.89, is a significant indicator of shifting market sentiment. Traditionally a safe-haven asset, gold's sharp decline suggests that investors are either moving out of risk-off assets or are anticipating a scenario where inflation fears are receding, making gold less attractive. This is further compounded by the weakening of WTI crude oil to $94.70, which, while still elevated, indicates some easing of immediate energy crisis concerns. The fact that gold has crashed below $4,600, with yields surging and Fed cut bets delayed, paints a picture of a market prioritizing yield over traditional safe havens. This environment is generally not favorable for riskier currencies like NZDUSD.
The recent spike in crude oil prices, reportedly linked to geopolitical tensions in the Middle East, adds another layer of complexity. While rising oil prices can sometimes correlate with a stronger NZD (as a commodity currency), the broader risk-off sentiment they can induce might also lead to a flight to safety, benefiting the US dollar at the expense of the Kiwi. The news about Cuba's blackout amidst a US oil blockade, while localized, highlights the fragility of energy supply chains. European central banks are particularly concerned about navigating the economic fallout from the Iran war, which could further destabilize global markets and impact currency pairs like NZDUSD through indirect channels.
The Technical Battleground: 1H vs. 4D vs. 1D
The divergence in signals across different timeframes is where the real trading edge lies. On the 1-hour chart, NZDUSD presents a 'BUY' signal with RSI at 64.59 and positive MACD momentum. The Stochastic is also in the upper quadrant, suggesting continued upside potential. However, the ADX at 24.1 indicates that this trend is still forming. The 4-hour chart, however, paints a more cautious picture. Despite a 'BUY' signal from most indicators, the overall trend is still classified as 'Downtrend' (86% strength), with a neutral RSI (56.46) and negative MACD momentum. This suggests that the short-term rally might be a retracement within a larger downtrend.
The daily chart for NZDUSD is perhaps the most telling. It shows a 'SELL' signal from 6 out of 8 indicators, confirming a dominant downtrend with 94% strength. The RSI(14) at 33.64 is firmly in neutral territory with a downward bias, indicating room for further decline. The MACD is negative, and Stochastic is in the oversold region, suggesting potential downside exhaustion but not necessarily an immediate reversal. Crucially, the ADX at 17.05 indicates a very weak trend on the daily chart, which can sometimes precede a significant move in either direction. This daily perspective suggests that the current strength seen on the 1H chart might be a temporary counter-trend move, vulnerable to the prevailing bearish sentiment.
The Role of Economic Data and Central Bank Communication
Looking ahead, upcoming economic data releases will be critical in shaping the narrative for NZDUSD. Any surprises in New Zealand's inflation data, employment figures, or GDP reports could significantly sway the Reserve Bank of New Zealand's (RBNZ) policy stance. Similarly, US economic data, particularly anything related to inflation or employment, will be closely scrutinized for its impact on the Fed's policy path. The market's reaction to the upcoming BoE and ECB rate decisions, though expected to be neutral, will also provide context for broader currency movements. The EUR/GBP pair hovering near 0.8640 ahead of these decisions highlights the sensitivity of currency markets to central bank communication.
The ongoing debate about whether the Fed has effectively ended rate cut hopes for 2026 is a major driver. If US economic data continues to surprise to the upside, reinforcing the Fed's hawkish stance, the US Dollar could see further strength, pushing NZDUSD lower. Conversely, any signs of economic weakness in the US could reignite rate cut expectations and provide a reprieve for the Kiwi. The correlation between NZDUSD and risk sentiment, as indicated by the S&P 500 (currently 6617.15) and Nasdaq (24374.75), remains a key factor. A sustained risk-off move in equities would likely weigh on NZDUSD.
The Bull Case: Short-Term Momentum and Divergence
The bullish argument for NZDUSD hinges primarily on the short-term technical picture and potential for oversold bounces. The 1-hour chart, with its 'BUY' signals, RSI at 64.59, and positive MACD momentum, suggests that buyers are actively defending the lower bounds and pushing the price higher. The Stochastic indicator on the 1-hour chart (K=78.04, D=56.01) also supports further upside. Furthermore, the 4-hour Stochastic shows a strong buy signal (%K > %D) with K at 70.22. If NZDUSD can decisively break above the immediate resistance at $0.58745 and sustain the move towards the next resistance at $0.58862, it could signal a short-covering rally. This scenario relies on the idea that the current downtrend is facing exhaustion, and the short-term positive momentum might be the precursor to a larger correction.
Another element supporting the bull case could be a shift in global risk sentiment. If geopolitical tensions ease, or if positive economic surprises emerge from New Zealand, the Kiwi could find strength irrespective of the DXY's direction. The daily chart's RSI at 46.54, while showing a downward bias, is not yet in deeply oversold territory, leaving room for a bounce. The MACD on the daily chart also shows positive momentum, which, if sustained, could eventually pull the price higher. The key for bulls will be to hold the immediate support levels, such as $0.58618 on the 1H chart and $0.58599 on the 4H chart, and use them as launchpads for a move higher.
The Bear Case: Daily Trend Dominance and Dollar Strength
Conversely, the bearish argument is built on the overwhelming evidence from the daily timeframe and the persistent strength of the US Dollar. The daily chart paints a clear picture of a downtrend, with a 'SELL' signal from 6 out of 8 indicators and an ADX of 17.05 suggesting a lack of strong trend, which can often precede a downside continuation after a period of consolidation. The RSI at 33.64 indicates bearish momentum, and the Stochastic is in oversold territory, but this can persist for extended periods in a strong downtrend. The critical resistance at $0.58862, and even more significantly $0.5900, represents a formidable barrier.
The prevailing macroeconomic environment, characterized by hawkish Fed rhetoric and potential delays in rate cuts, strongly favors the US Dollar. As the DXY shows strong daily uptrend strength (ADX 34.58), it creates a headwind for NZDUSD. The correlation analysis reinforces this: a rising DXY at 99.09 puts pressure on the pair. The broader market sentiment, indicated by the decline in gold to $4,649.89 and the cautious equity markets (S&P 500 at 6617.15), suggests a preference for safety over risk. If NZDUSD fails to break above the $0.58745 level and instead retreats, the path of least resistance would be lower, targeting the support levels at $0.58599 and potentially $0.58301 on the 4-hour chart.
Technical Confluence and Scenario Planning
The current technical setup presents a classic bull vs. bear battleground. The short-term indicators suggest a potential for upside continuation, while the longer-term daily trend and macroeconomic factors lean bearish. The ADX values are particularly interesting: 24.1 on the 1H, 22.1 on the 4H, and 17.05 on the 1D. These readings suggest that while a trend is developing on shorter timeframes, the daily trend is weak, implying that any move might lack sustained conviction. The key will be how price reacts around the $0.58745 mark. A rejection here, especially on higher volume, would validate the bearish case and likely lead to a test of the support levels.
Conversely, a decisive close above $0.58862 on the 1H chart, backed by increasing volume and perhaps a shift in broader market sentiment, could signal the start of a more significant correction. Traders must remain vigilant, as the conflicting signals across timeframes require a disciplined approach. Risk management is paramount, especially given the uncertain macroeconomic outlook and the potential for sharp moves driven by central bank commentary or geopolitical events. The price action around $0.58745 will be the immediate determinant of short-term direction.
Bearish Scenario: Trend Continuation
65% ProbabilityNeutral Scenario: Consolidation Around Resistance
25% ProbabilityBullish Scenario: Short-Covering Rally
10% ProbabilityFrequently Asked Questions: NZDUSD Analysis
What happens if NZDUSD breaks above the $0.58862 resistance level?
A decisive break and sustained hold above $0.58862, especially on increasing volume, would invalidate the immediate bearish outlook. This could trigger a short-covering rally targeting $0.59000 and potentially $0.59344, the next significant resistance level on the daily chart.
Should I consider buying NZDUSD at current levels around $0.58745 given the mixed signals?
Buying at current levels around $0.58745 carries significant risk due to the conflicting signals and the prevailing daily downtrend. A more prudent approach would be to wait for confirmation, either a clear break above resistance for a bullish continuation or a rejection and break below support at $0.58618 for a bearish move. Risk management dictates waiting for a higher probability setup.
Is the RSI at 64.59 on the 1H chart a sell signal for NZDUSD right now?
An RSI of 64.59 on the 1-hour chart indicates strong bullish momentum but is approaching overbought territory. It is not an immediate sell signal on its own, especially with other indicators showing positive momentum. However, it suggests that the bullish move might be losing steam and could be vulnerable to a pullback or consolidation, especially if it fails to break higher resistance levels.
How will the Fed's potential delay in rate cuts affect NZDUSD this week?
The Fed's hawkish stance, signaling potential delays in rate cuts, generally strengthens the US Dollar. This increased dollar strength creates a significant headwind for NZDUSD. If this narrative continues, expect downward pressure on NZDUSD as the yield differential favors the USD, potentially pushing the pair towards lower support levels.
Track markets in real-time
AI-powered analysis, technical indicators and real-time price data.
Join Our Telegram Channel
Breaking market news, AI analysis and trading signals instantly.
Join Channel