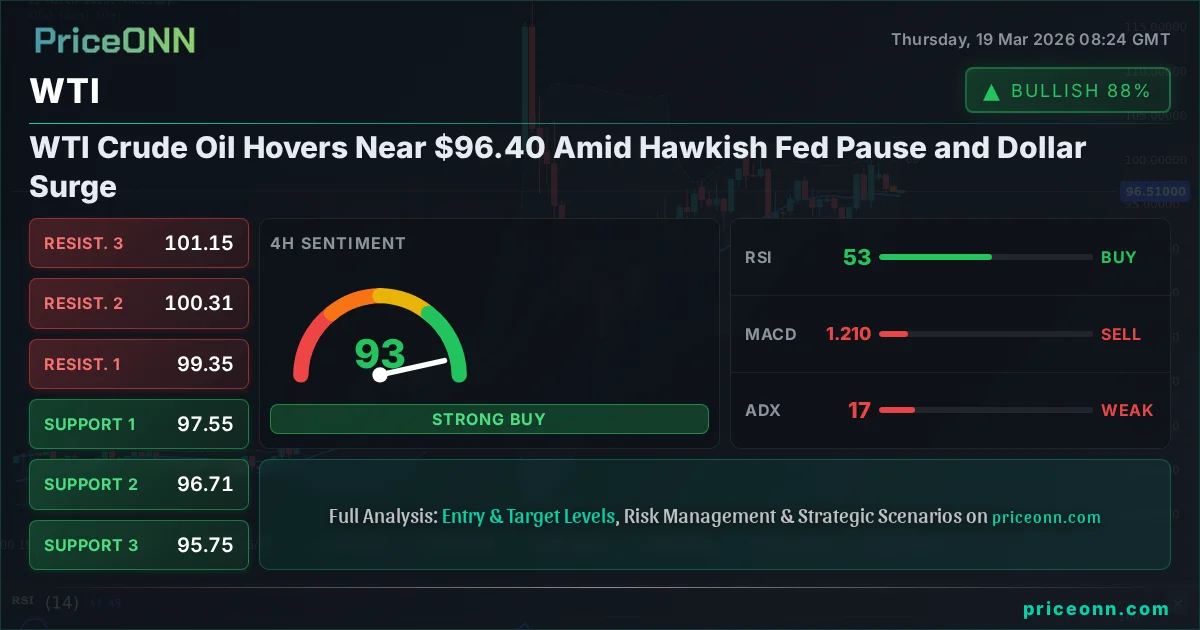
WTI Crude Oil Hovers Near $96.40 Amid Hawkish Fed Pause and Dollar Surge
WTI crude oil holds near $96.40 as a hawkish Fed stance and a strengthening dollar pressure energy markets, while Brent crude rallies past $113. Geopolitical tensions remain a key driver.
The energy landscape is currently defined by a complex interplay of central bank policy, geopolitical undercurrents, and a resurgent US dollar. West Texas Intermediate (WTI) crude oil finds itself trading precariously near the $96.40 mark, a level that encapsulates the current market tension. This price point reflects a market grappling with a Federal Reserve that has signaled a more cautious approach to rate cuts, reinforcing the dollar's strength and simultaneously casting a shadow over risk assets like oil. Meanwhile, its international counterpart, Brent crude, is carving a different path, surging past $113.73, highlighting a widening spread and underscoring the multifaceted pressures influencing global energy benchmarks. Understanding this dynamic requires a deep dive into the technical signals, the prevailing macroeconomic narrative, and the ever-present geopolitical risks that continue to shape oil's trajectory.
- WTI crude oil is currently trading near $96.40, reflecting a neutral trend with strong downward momentum on shorter timeframes.
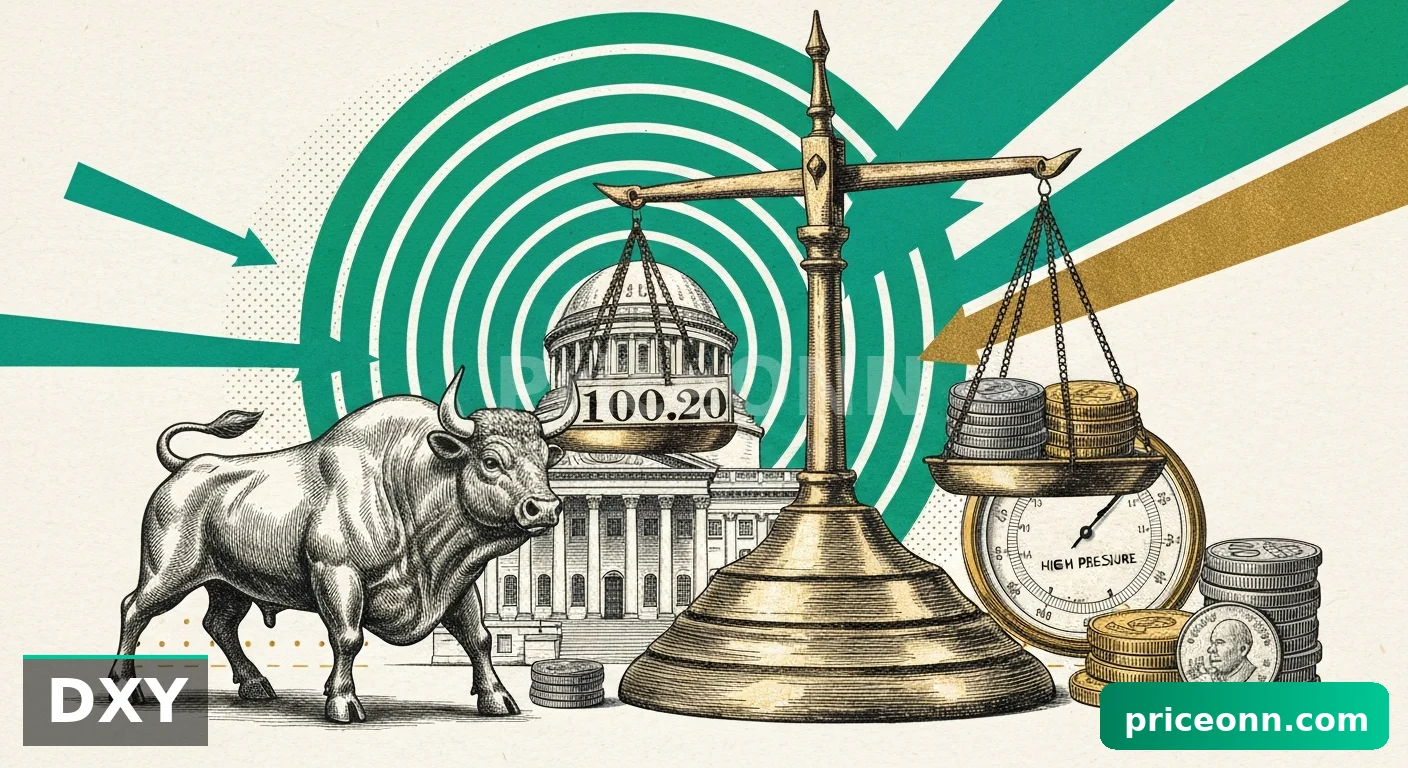
- The US Dollar Index (DXY) is at 99.98, exhibiting a strong upward trend, which typically exerts downward pressure on oil prices.
- Brent crude is outperforming WTI, trading significantly higher at $113.73, indicating specific supply-side concerns influencing the global benchmark.
- Geopolitical tensions and a hawkish Federal Reserve policy are key drivers, creating a mixed sentiment for oil markets.
Navigating the Cross-Market Currents: DXY, Equities, and Oil's Correlation
The current market environment is characterized by a strong correlation between the US Dollar Index (DXY) and commodities like WTI crude oil. With the DXY at 99.98, its upward trend, particularly evident on the 1-hour and daily charts, suggests a strengthening greenback. Historically, a robust dollar makes dollar-denominated assets, such as oil, more expensive for holders of other currencies, often leading to reduced demand and downward price pressure. This inverse relationship is a critical factor for traders monitoring WTI. The DXY's ADX at 28.2 on the 1-hour chart and 35.88 on the daily chart indicates a firm uptrend, reinforcing the dollar's strength. This presents a significant headwind for WTI, which is showing a neutral trend overall but with a strong 50% power and a clear downward bias on the 1-hour and 4-hour timeframes, evidenced by its ADX readings of 15.07 and 17.48 respectively. The divergence between the dollar's strength and oil's current price action, despite the latter's upward move in Brent, warrants close observation.
Furthermore, the sentiment in global equity markets, as indicated by the S&P 500 and Nasdaq, plays a crucial role. The S&P 500 is currently at 6613.05, showing a daily rise but with a dominant bearish trend on the 1-hour and daily charts (ADX 45.33 and 42.65). The Nasdaq 100, trading at 24361.01, mirrors this weakness with strong bearish signals across timeframes. This risk-off sentiment in equities often correlates with a move towards safer assets and can amplify downward pressure on riskier commodities like oil. When major stock indices are trending downwards, it signals a general aversion to risk, which typically dampens demand for industrial commodities that are sensitive to economic growth expectations. The current technical setup in equities suggests caution, implying that any upside in oil might face significant resistance from a broader market that is signaling potential headwinds.
WTI's Technical Picture: A Study in Divergence and Weak Trends
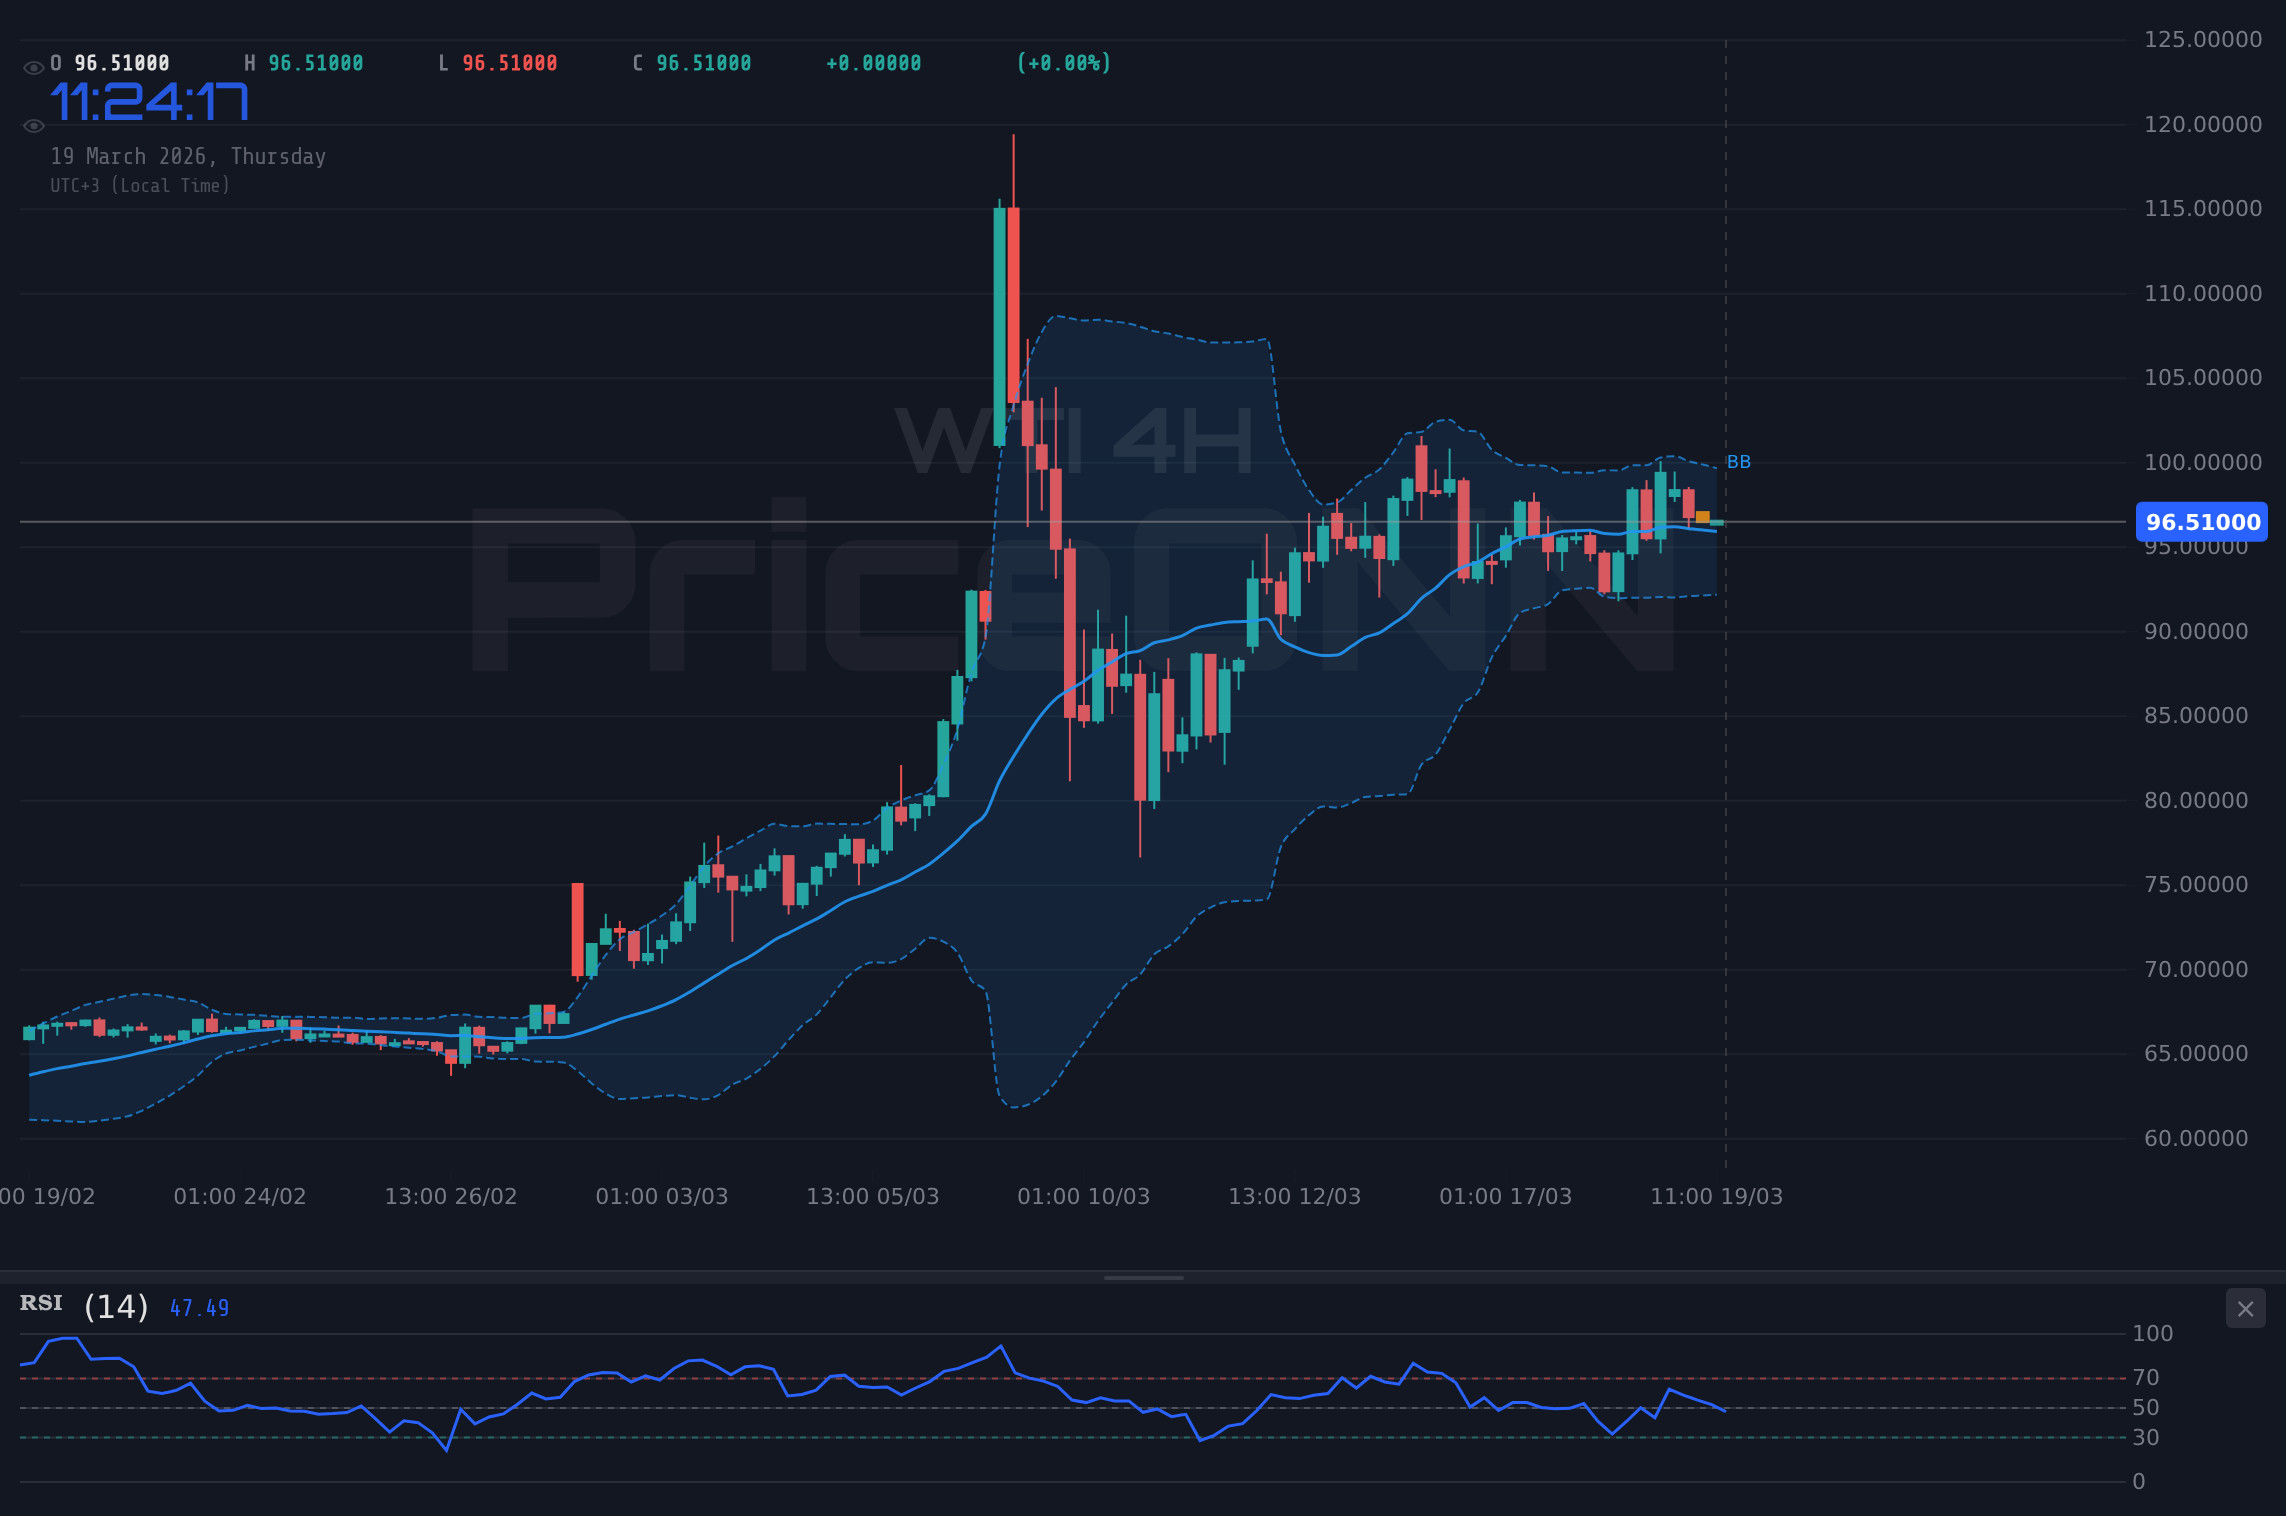
Delving into the technical indicators for WTI crude oil reveals a complex and somewhat contradictory picture, particularly when examining different timeframes. On the 4-hour chart, WTI is showing a neutral trend with 50% power, but the ADX reading of 17.48 suggests a weak trend, often characteristic of ranging or consolidating markets. This is further supported by the Stochastic indicator, with %K at 75.51 and %D at 61.59, indicating an upward signal but also approaching overbought territory. However, the RSI(14) at 52.43 sits squarely in neutral ground, offering little directional conviction. The Bollinger Bands are trading above the middle band, hinting at upward momentum, but the overall picture is one of indecision rather than a clear directional conviction.
The 1-hour timeframe paints a more bearish immediate picture. Here, WTI exhibits a neutral trend with 50% power, but the ADX at 15.07 indicates a similarly weak trend. The RSI(14) is at 48, suggesting a lack of strong momentum in either direction. The MACD is in negative territory, with its histogram below the signal line, pointing to bearish momentum. Stochastic %K at 17.59 and %D at 32.94 clearly signals a downward move, and the price is trading below the middle Bollinger Band, reinforcing a bearish bias in this short-term view. This contrast between the 4-hour and 1-hour charts highlights the choppy nature of WTI currently. Traders must be wary of entering positions based on weak trend signals, as they can lead to whipsaws and unpredictable price action. The lack of a strong, confirmed trend across multiple timeframes makes any directional bet inherently riskier.
On the daily chart, the picture for WTI becomes even more nuanced. The trend is classified as 'Uplift' with 100% power, yet the ADX is a robust 57.6, indicating a very strong trending market. However, the RSI(14) at 70.52 is firmly in overbought territory, suggesting that the current upward momentum might be unsustainable and susceptible to a pullback or consolidation. This is a classic scenario where strong trends can be accompanied by overbought conditions, increasing the likelihood of a correction. The MACD is positive, with its histogram above the signal line, supporting the bullish trend. Stochastic K at 48.56 and D at 49.36 are nearing a bearish crossover, adding a layer of caution. The Bollinger Bands are trading above the middle band, confirming the bullish trend, but the RSI reading is a significant warning sign for immediate upside potential. The general signal across all timeframes leans towards 'Buy' (5 Buy, 2 Sell, 0 Neutral), but the overbought RSI on the daily chart is a critical caveat.
The Brent-WTI Spread: A Tale of Geopolitics and Supply Dynamics
The significant divergence between Brent crude and WTI crude oil prices is a critical narrative in the current energy market. Brent is trading at $113.73, showing a strong daily increase of 3.71% and a very strong 100% upward trend on all timeframes, with an ADX of 63.41 on the daily chart. This surge is largely attributed to geopolitical factors, as indicated by recent news suggesting escalating Middle East tensions and retaliatory strikes impacting energy infrastructure. Brent's strength is further amplified by its RSI(14) at 86.25 on the daily chart, signalling extreme overbought conditions, yet the trend remains powerfully bullish. This suggests that supply-side concerns, potentially linked to regional conflicts or production disruptions specific to the Brent supply chain, are overriding broader market pressures.
In contrast, WTI, trading at $96.40, is showing a much weaker performance. While the daily chart indicates a 100% uplift trend, the ADX at 57.6 is strong, but the RSI at 70.52 is just entering overbought territory, unlike Brent's extreme reading. The 1-hour and 4-hour charts for WTI show weaker trends and more neutral or even bearish signals, as previously discussed. This widening spread between Brent and WTI, currently around $17.33, is not uncommon during periods of geopolitical stress in the Middle East, which directly impacts Brent's supply routes and availability more than WTI's primarily North American market. This divergence underscores that global oil prices are not a monolith; localized supply disruptions can create significant price differentials even when macro demand factors are broadly similar. Traders must recognize that strategies applied to Brent may not directly translate to WTI, and vice versa, due to these specific supply-side dynamics.
The Fed's Hawkish Pause and the Dollar's Dominance
The Federal Reserve's recent policy decision has injected a significant dose of caution into the market, with a clear signal of a 'hawkish pause' in interest rate cuts. This implies that the Fed is more concerned about persistent inflation than previously signaled, leading to expectations of fewer rate cuts in the near future. This stance has bolstered the US Dollar Index (DXY), pushing it towards the 100.00 mark. As of the latest data, the DXY is at 99.98, with strong upward momentum across all monitored timeframes. The daily chart shows a clear bullish trend with an ADX of 35.88, and RSI at 66.61, indicating a strong upward bias without being excessively overbought. This strengthening dollar is a major headwind for commodities like WTI, making them more expensive and potentially dampening demand.
The impact of a strong dollar is amplified when coupled with broader risk-off sentiment in equity markets. The S&P 500 and Nasdaq are showing bearish trends, suggesting that investors are becoming more risk-averse. In such an environment, capital tends to flow towards perceived safe-haven assets, with the US dollar often being a primary beneficiary. This confluence of factors - a hawkish Fed, a strengthening dollar, and declining risk appetite in equities - creates a challenging environment for oil prices, even in the face of geopolitical supply concerns that are currently boosting Brent. The $96.40 level for WTI becomes a critical battleground where these opposing forces are clashing. A sustained dollar rally could easily overwhelm any bullish sentiment stemming from supply-side issues, pushing WTI lower.
Geopolitical Ripples: The Ever-Present Risk Premium in Oil
The energy market remains acutely sensitive to geopolitical developments, and recent events have served as a stark reminder of this reality. Reports of escalating Middle East tensions and retaliatory strikes impacting energy infrastructure have directly fueled the surge in Brent crude prices. This geopolitical risk premium is a significant factor that can override typical supply-demand fundamentals. When such tensions rise, traders price in the potential for supply disruptions, leading to sharp price increases, particularly in benchmarks like Brent that are more exposed to the affected regions. This is precisely what we are observing, with Brent rallying significantly while WTI, though influenced, shows a more muted reaction due to its different supply dynamics.
The ongoing conflict and its potential to disrupt global energy flows mean that oil prices could remain volatile and susceptible to sudden upward shocks. While the current technical indicators for WTI on shorter timeframes suggest caution or even a bearish bias due to weak trends and approaching overbought conditions on the daily chart, the geopolitical backdrop introduces an unpredictable element. Any further escalation or significant disruption could trigger a rapid price surge, irrespective of the prevailing technical signals. Conversely, a de-escalation of tensions could lead to a swift correction, especially if coupled with a strong dollar and weakening global demand. Traders must remain vigilant, monitoring news flow closely as geopolitical events can rapidly alter the market's trajectory, often overriding technical patterns in the short term.
Forward-Looking View: What's Next for WTI Near $96.40?
As WTI crude oil hovers near $96.40, the market faces a critical juncture influenced by a trifecta of factors: a hawkish Federal Reserve, a strengthening US dollar, and ongoing geopolitical tensions in the Middle East. The technical indicators present a mixed picture. While the daily chart shows a strong uptrend, the RSI(14) at 70.52 is signaling overbought conditions, suggesting potential for a pullback. Shorter timeframes (1-hour and 4-hour) exhibit weak trends and bearish momentum, reinforcing the need for caution. The divergence with Brent crude, which is significantly outperforming due to specific supply concerns, adds another layer of complexity. The robust DXY at 99.98 and risk-off sentiment in equities further point towards potential headwinds for WTI.
The immediate future for WTI will likely depend on the interplay between these forces. If geopolitical tensions continue to escalate, they could provide enough of a risk premium to support oil prices, potentially overriding some of the dollar's strength. However, a sustained rally in the DXY, especially if the Fed maintains its hawkish tone, could cap any significant upside for WTI. The weak trend signals on shorter timeframes suggest that any breakout might lack conviction unless accompanied by a significant fundamental catalyst or a clear shift in market sentiment. Traders should pay close attention to the $96.40 level as a key psychological and technical point. A decisive break below it, particularly on increased volume, could signal further downside, while holding this level and consolidating might set the stage for a potential recovery if geopolitical risks subside or demand indicators improve.
Frequently Asked Questions: WTI Analysis
What is the immediate outlook for WTI crude oil trading near $96.40 given the hawkish Fed and rising DXY?
The immediate outlook for WTI near $96.40 is cautious. The hawkish Fed stance and a strong DXY at 99.98 typically exert downward pressure, while geopolitical risks supporting Brent crude add complexity. Technicals show weak trends and overbought conditions on longer timeframes, suggesting limited upside without a clear catalyst.
How does the Brent-WTI spread affect WTI's price action at current levels?
The significant spread, with Brent at $113.73 and WTI near $96.40, highlights specific supply concerns impacting Brent more directly. This divergence suggests that WTI's price may not fully reflect the geopolitical risk premium boosting Brent, potentially limiting its downside if tensions persist, but also capping its upside if macro factors like dollar strength dominate.
Is the RSI at 70.52 on the daily chart a strong sell signal for WTI at $96.40?
An RSI of 70.52 on the daily chart indicates overbought conditions, suggesting that the recent uptrend might be losing momentum and a pullback is possible. However, it is not a definitive sell signal on its own, especially in a strong trend. Confirmation from other indicators or a price break below key support levels like $95.53 would be needed for a higher-probability bearish trade.
How will upcoming geopolitical events or Fed policy shifts impact WTI's price around the $96.40 level?
Further escalation of Middle East tensions could push WTI higher, potentially breaking resistance levels like $97.46, despite dollar strength. Conversely, any dovish shift from the Fed or easing of geopolitical risks could see WTI fall towards support levels around $95.53, amplified by a strong dollar.
Track markets in real-time
AI-powered analysis, technical indicators and real-time price data.
Join Our Telegram Channel
Breaking market news, AI analysis and trading signals instantly.
Join Channel