Silver Tests $79.45 Amidst Shifting Market Tides: Bull vs. Bear Showdown
Silver (XAGUSD) hovers around $79.45 as strong dollar and market volatility create a tug-of-war. Analysis reveals key levels and trade scenarios.
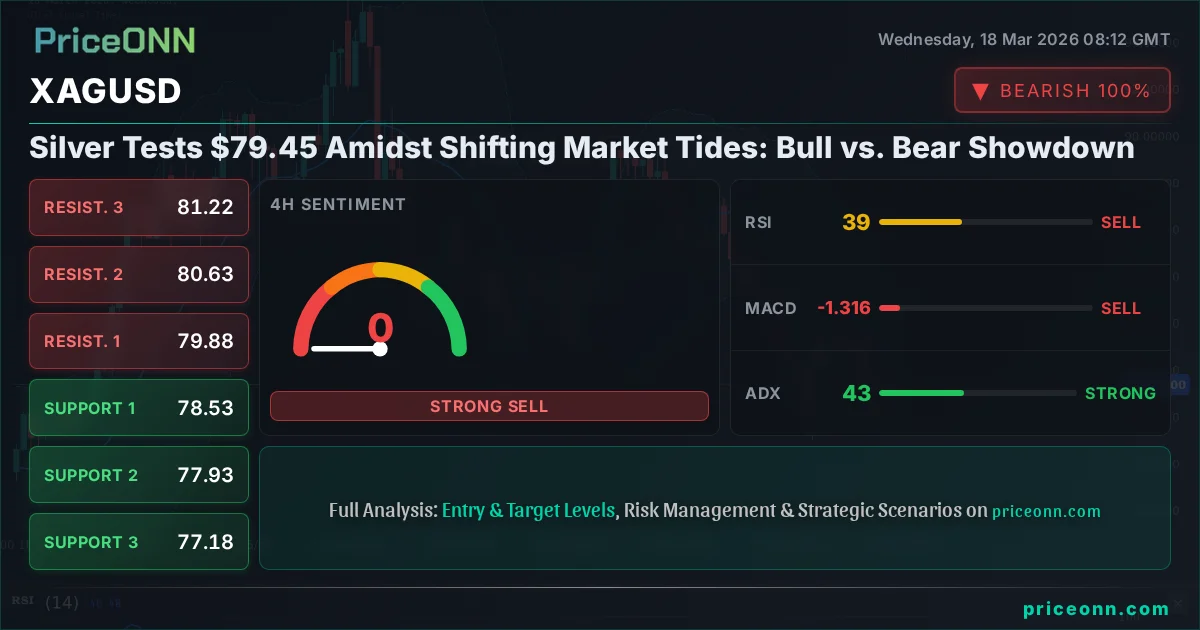
Silver, or XAGUSD, is currently caught in a fierce tug-of-war, trading precariously around the $79.45 mark. This critical juncture is where the bulls and bears are battling it out, each side presenting a compelling, yet opposing, narrative for the precious metal's next move. With the 1-hour chart showing a strong downward trend (87% strength) and the daily chart indicating a neutral stance (50% strength), the immediate future of silver hangs in the balance. This complex technical picture, coupled with shifting macroeconomic winds, demands a deep dive into both the bullish and bearish arguments to understand where XAGUSD might head next.
- Silver (XAGUSD) is trading at $79.45, with the 1H RSI at 42.56 and the 1D RSI at 46.25, both indicating neutral to bearish pressure.
- Critical support for XAGUSD is identified at $77.48, while resistance looms at $81.75 on the daily timeframe.
- The US Dollar Index (DXY) at 99.41 is showing strength, correlating with a bearish outlook for silver as per historical market dynamics.
- Geopolitical tensions and central bank policy remain key drivers, creating a volatile environment for safe-haven assets like silver.
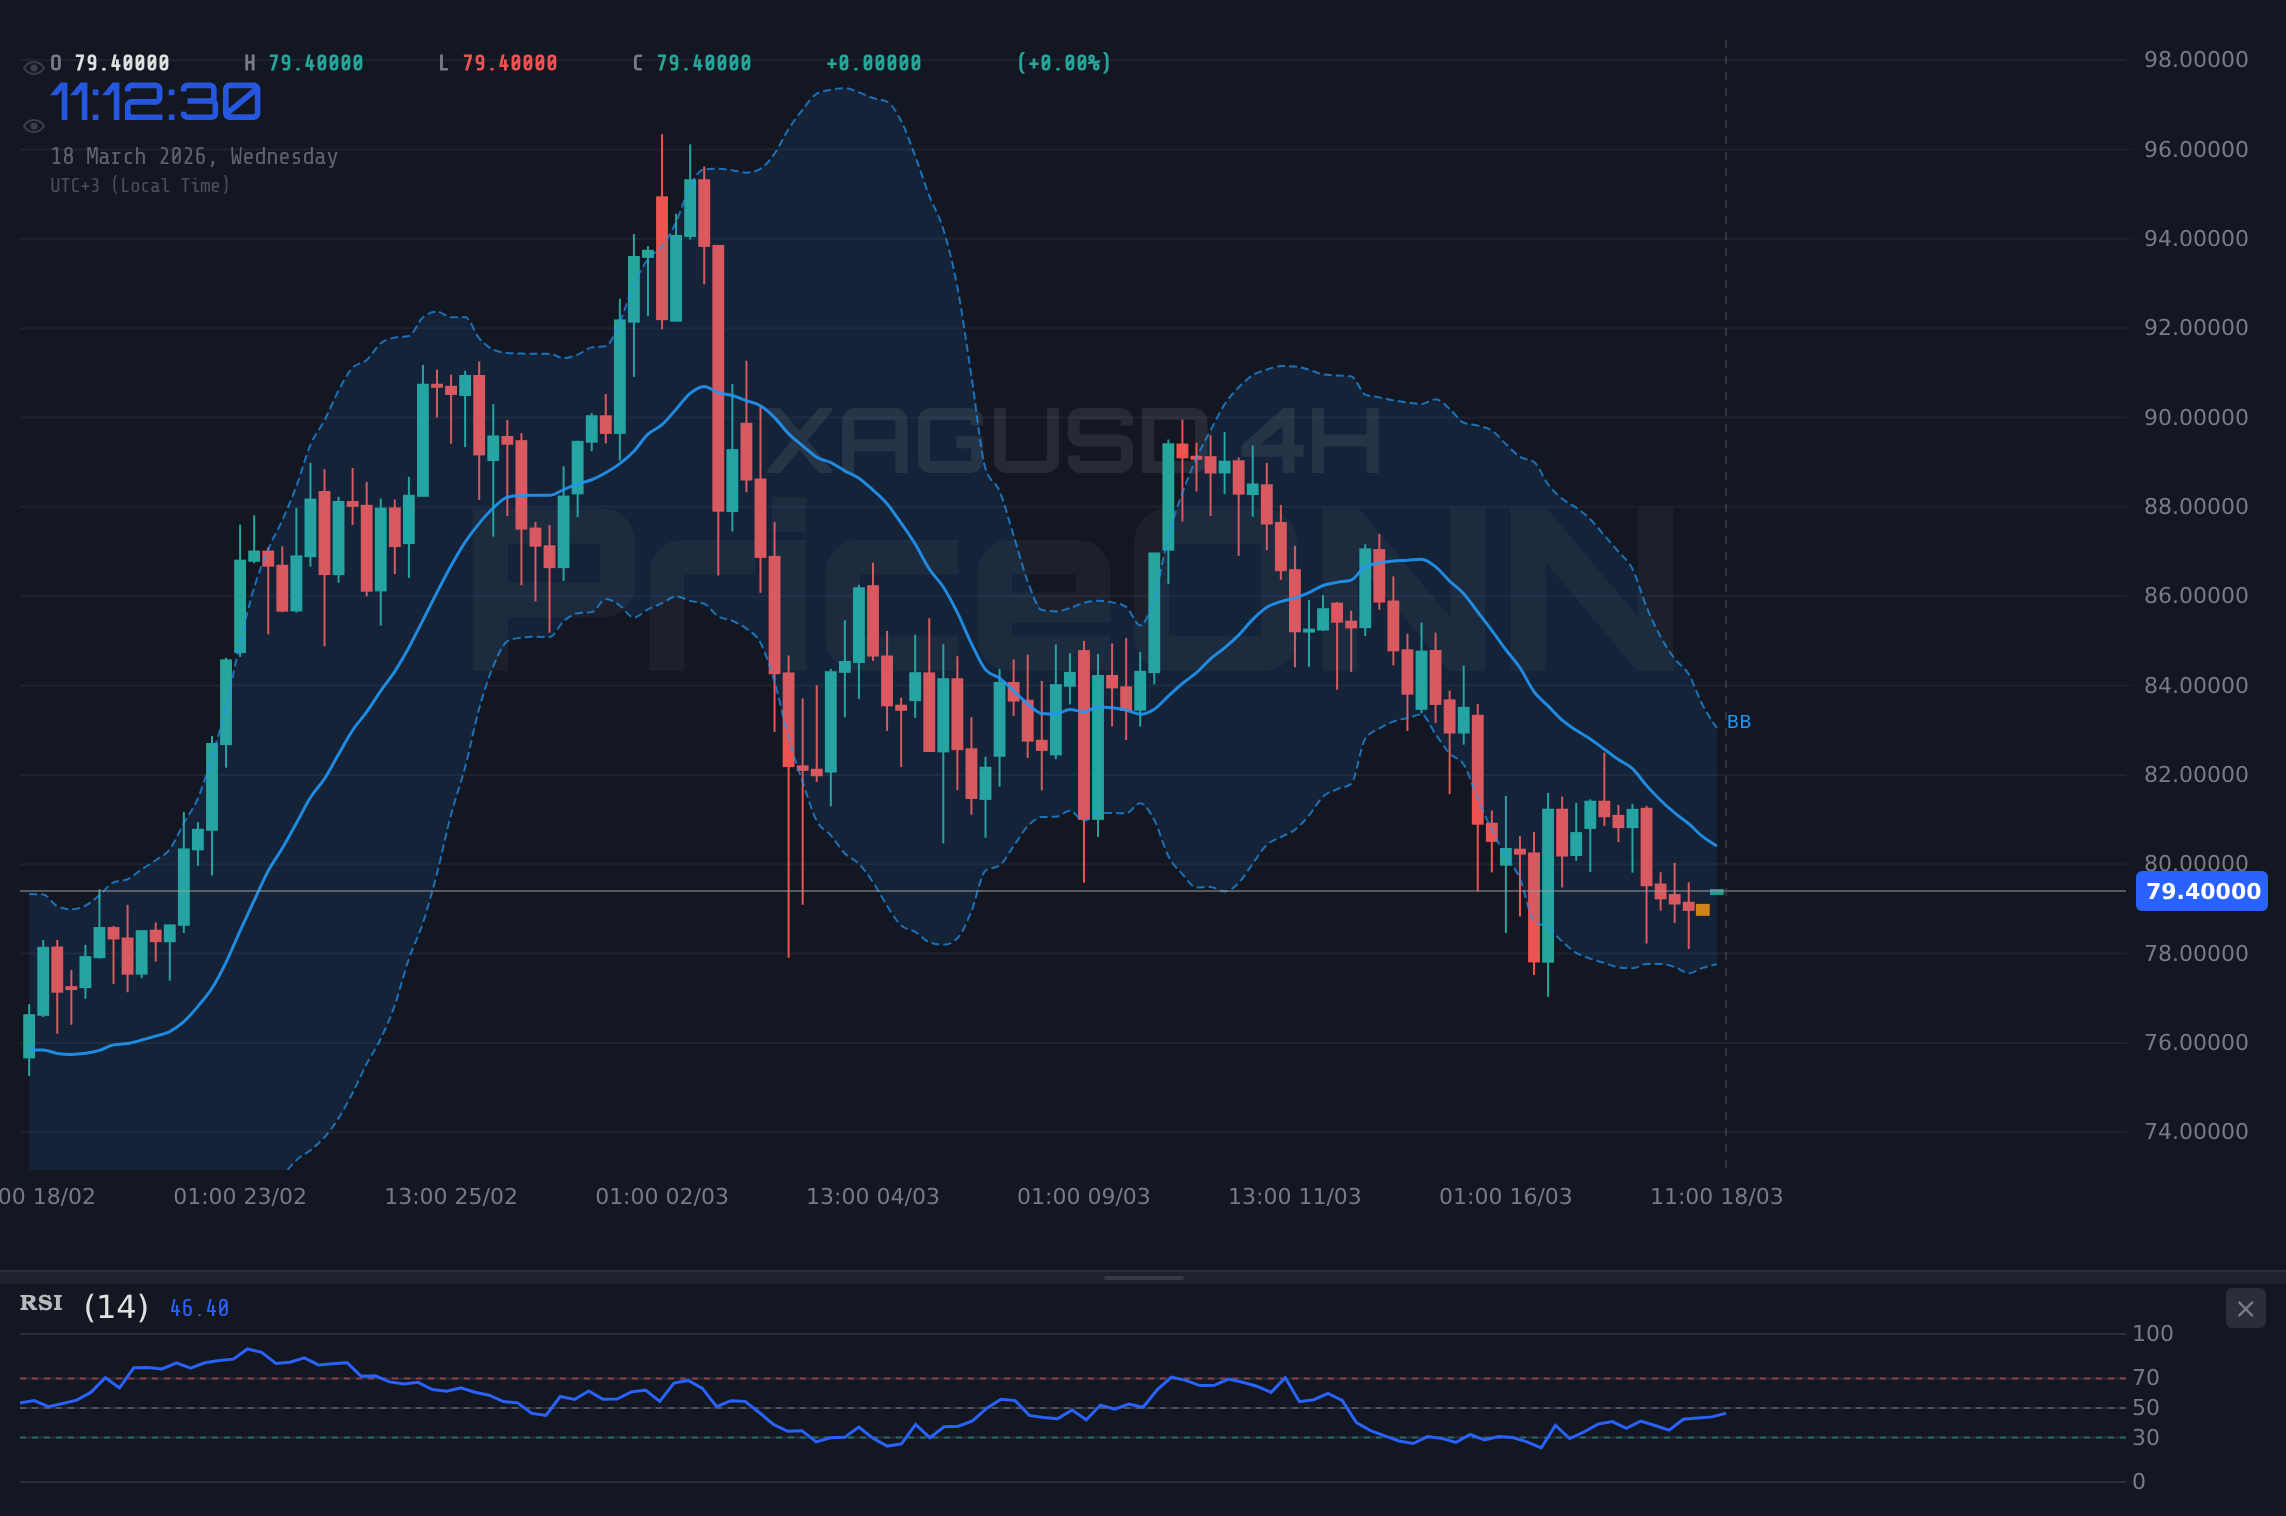
The current market sentiment presents a fascinating dichotomy for silver. On one hand, the persistent strength in the US Dollar Index (DXY), currently at 99.41 and showing a strong daily uptrend, typically exerts downward pressure on dollar-denominated commodities like silver. Historically, a rising dollar often means higher costs for holders of other currencies, dampening demand. Furthermore, the 4-hour chart for XAGUSD paints a picture of a strong downtrend with an ADX reading of 46.59, suggesting significant momentum behind the sellers. This technical backdrop, combined with a general cautiousness in global risk sentiment, could easily push silver lower.
However, to dismiss the bullish case entirely would be a mistake. The daily chart, while neutral in trend strength, shows RSI at 46.25, which, while leaning bearish, is still within a range that could precede a reversal. Moreover, the 1-hour Stochastic indicator is showing a bullish signal (%K > %D), hinting at potential short-term buying interest. In the grand scheme, central banks continue to be significant buyers of gold, and while silver's drivers are more industrial, its safe-haven appeal cannot be entirely discounted, especially if inflation fears resurface or geopolitical tensions escalate further. The news feed also shows conflicting signals, with one report mentioning Silver holding above $79 amid Fed policy wait, while another notes a 2% slide as oil surged. This divergence highlights the indecision in the market.
The Bullish Case: Silver's Resilience Amidst Uncertainty
Demand Drivers: Beyond the Charts
The underlying demand for silver remains robust, providing a fundamental floor that could support prices even amidst short-term bearish technical signals. While industrial demand is a significant component, the growing interest in silver as a store of value, particularly in an environment where central bank gold accumulation continues at record paces, cannot be overlooked. Although not a direct proxy, the persistent central bank buying of gold ($79.45 is the current price for XAGUSD, not gold) signals a broader trend of de-dollarization and a search for tangible assets. This macro trend creates a favorable long-term backdrop for silver. Furthermore, the increasing adoption of silver in technology, from EVs to renewable energy infrastructure, ensures sustained industrial consumption. If these demand drivers gain prominence, they could easily overwhelm short-term bearish pressures.
Technical Tidbits Supporting the Bulls
While the overall trend indicators lean bearish on shorter timeframes, there are glimmers of hope for the bulls. The 1-hour Stochastic oscillator, with K=48.24 and D=31.36, clearly indicates a bullish crossover, suggesting that momentum may be shifting upwards in the very short term. This could be the start of a retracement, especially if silver can hold above the immediate support level of $79.15. On the daily chart, although the ADX is low at 13.43, suggesting a weak trend, this can also mean that the current downward move lacks conviction. A sustained push above the 1-hour resistance at $80.28 could signal a short-covering rally, potentially testing higher levels. The fact that the daily RSI is at 46.25 means it is not yet deeply oversold, leaving room for a bounce.
The Bearish Case: Dollar Strength and Technical Headwinds
The Dominance of the US Dollar
The most significant headwind for silver currently is the strength of the US Dollar Index (DXY). With the DXY at 99.41 and exhibiting a powerful 1-hour uptrend with an ADX of 31.45, the greenback is showing considerable strength. This poses a direct challenge to silver prices. When the dollar strengthens, assets priced in dollars, like silver, become more expensive for holders of other currencies. This typically leads to reduced demand and, consequently, lower prices. The correlation is clear: as DXY pushes higher, XAGUSD faces downward pressure. This dynamic is a primary reason why many analysts are cautious about silver's immediate prospects. The daily chart for DXY shows a strong uptrend (92% strength), reinforcing this bearish outlook for silver.
Technical Signals Pointing Downward
The technical indicators, particularly on the longer timeframes, present a strong bearish argument. The 4-hour chart shows a dominant downtrend with an ADX of 46.59, indicating a firmly established trend. The RSI(14) at 37.62 on this timeframe is well within the neutral-to-bearish zone, suggesting ample room for further declines before silver becomes oversold. The MACD on both the 1-hour and 4-hour charts is showing negative momentum, with the MACD line below its signal line, confirming the selling pressure. Furthermore, the Bollinger Bands on the 4-hour and daily charts are positioned below the middle band, indicating that the price is trading within the lower half of its recent range, a classic sign of bearish dominance. The overall signal across multiple timeframes leans heavily towards 'SELL', with the 1-hour and 4-hour charts both showing 7 'Sell' signals against only 1 'Buy' signal.
Intermarket Dynamics and Macroeconomic Crosscurrents
Correlations and Contradictions
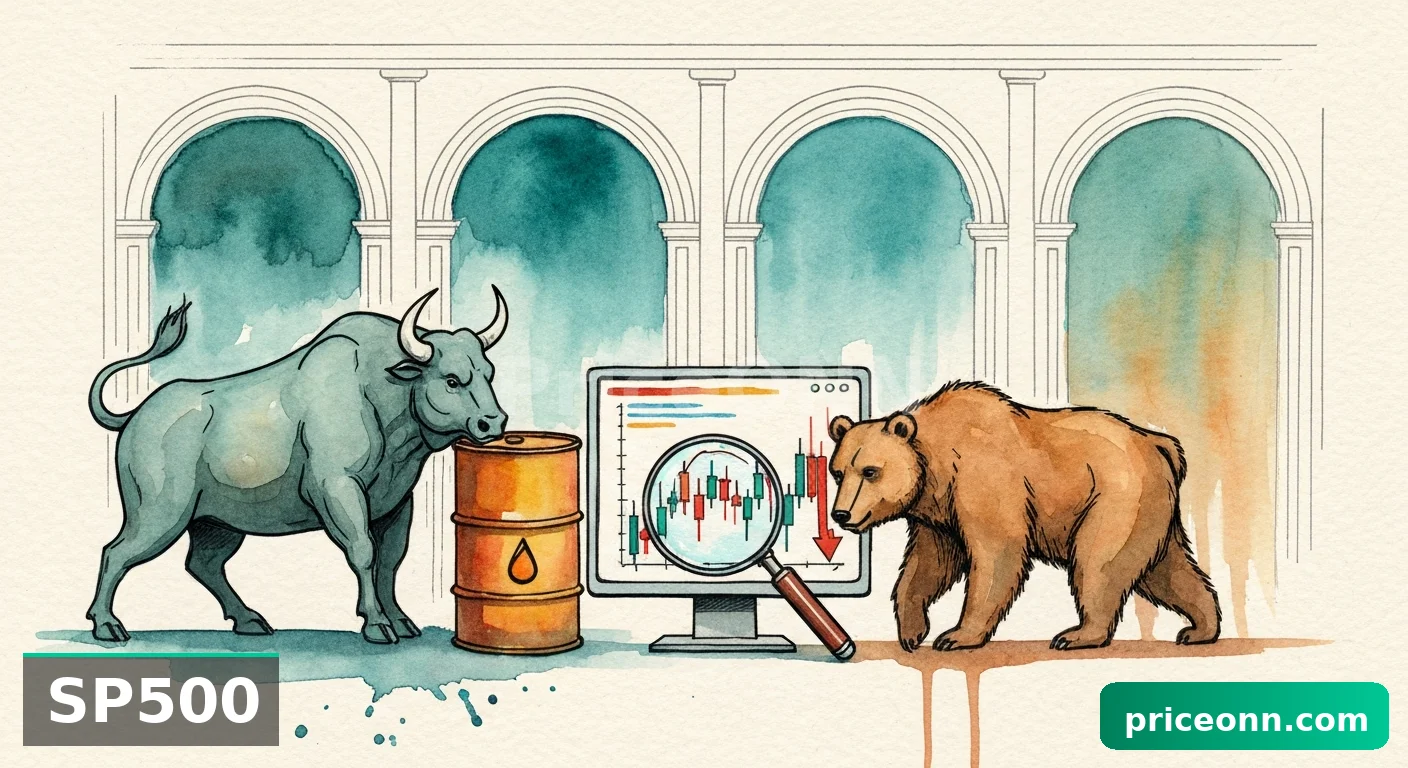
Silver's price action is intricately linked to broader market movements. The current strength in the DXY at 99.41 is a major factor, suggesting that as the dollar strengthens, silver faces headwinds. Conversely, if risk sentiment were to sour dramatically, we might expect to see a flight to safety, which could benefit silver. However, the S&P 500 (SP500) is currently showing a strong upward trend (100% strength on 1H, 6752.95 price), indicating a 'risk-on' environment. This is somewhat contradictory to a strong safe-haven bid for silver, though not entirely. The Nasdaq100 also shows a strong upward trend. This suggests that while institutional money might be flowing into equities, potentially pulling funds away from safe havens, the underlying geopolitical risks could still create pockets of demand for precious metals. The WTI crude oil price at $93.99, despite a recent dip, has shown significant strength recently, which can be a double-edged sword for silver: higher oil prices can fuel inflation, traditionally a bullish factor for silver, but they can also signal geopolitical instability that might initially benefit the dollar as a safe haven, thus pressuring silver.
Central Banks and Inflation Fears
The narrative around central bank policy and inflation remains a critical backdrop. While the market data doesn't provide explicit central bank commentary for this specific moment, the general expectation is that central banks are wary of persistent inflation. This caution usually translates into a hawkish bias, keeping interest rates higher for longer, which is generally bearish for non-yielding assets like silver. However, if inflation proves more stubborn than anticipated, or if economic growth falters, central banks might pivot, potentially leading to rate cuts and a weaker dollar. Such a scenario would be fundamentally supportive for silver. The recent news also mentions that Silver prices are consolidating near the $79.00 mark, showing a lack of decisive direction as traders await the Federal Reserve. This waiting game highlights the sensitivity of silver to monetary policy expectations.
The Trade Plan: Navigating the $79.45 Crossroads
Scenario A: Bullish Breakout
For the bulls to gain the upper hand, silver needs to convincingly break through the immediate resistance levels. The 1-hour resistance is at $80.28, followed by $80.76. A sustained move and close above $80.76, particularly on increased volume, would invalidate the short-term bearish signals. The daily resistance level at $81.75 becomes the next significant hurdle. If this level is breached, it could trigger a cascade of short-covering, potentially targeting the next resistance at $84.26. The ADX on the 1-hour chart is 27.08, suggesting a trend is present, and a breakout above resistance could see this strengthen.
Scenario B: Bearish Continuation
The bears have a clear path if silver fails to hold its ground around the current $79.45 level. The immediate support on the 1-hour chart is $79.15, followed by $78.50. A decisive break below $78.50, especially if it happens with strong volume and negative momentum confirmed by MACD, would reinforce the bearish trend seen on the 4-hour chart (ADX 46.59). The daily support at $77.48 becomes the next logical target. A failure to hold this level could accelerate the decline towards $75.72. The Stochastic on the 4-hour chart shows %K at 30.64 and %D at 54.64, a bearish crossover confirming the downward pressure.
Trade Execution Strategy
Given the strong ADX of 46.59 on the 4-hour chart, a clear trend is in play. The confluence of bearish signals on the 4-hour and daily charts, despite some conflicting short-term indicators, suggests a higher probability for a bearish continuation. The DXY strength at 99.41 further supports this view. Therefore, a strategy focused on the downside appears more prudent at this juncture.
Trade Plan: Bearish Continuation
65% ProbabilityIt is crucial to manage risk effectively. The invalidation level at $80.28 represents a significant resistance, and a sustained move above it would negate the bearish thesis. Traders should consider position sizing carefully, especially given the volatility indicated by the recent news of silver sliding 2% as oil surged, despite other reports suggesting it was holding above $79. This conflicting news flow underscores the need for disciplined trade execution.
The Verdict: Bears Have the Edge, But Watch for Volatility
Analyzing the confluence of factors – the strong dollar, bearish technicals on multiple timeframes, and the prevailing risk sentiment – it appears the bears currently hold a slight advantage. The ADX at 46.59 on the 4-hour chart is a strong indicator of a defined trend, and the signals align for further downside. The key support level at $77.48 on the daily chart is the next major battleground. However, the presence of conflicting signals, such as the 1-hour Stochastic crossover and the potential for geopolitical events to shift sentiment rapidly, means that caution is paramount. The news that silver is consolidating around $79.00, awaiting Fed policy, highlights this indecision. Silver's price is a complex interplay of industrial demand, safe-haven appeal, and macroeconomic forces, making it susceptible to sharp moves in either direction.
The bullish case hinges on a sustained break above resistance levels like $80.28 and ultimately $81.75, coupled with a weakening dollar and a resurgence in risk appetite. Should inflation fears resurface or geopolitical tensions escalate significantly, silver could find renewed strength as a safe haven. The daily RSI at 46.25 still offers room for a bounce, and the presence of strong underlying demand from both industrial and investment sectors provides a fundamental backstop.
Ultimately, the immediate path for XAGUSD appears tilted towards the downside, targeting support levels around $77.48. However, the market is dynamic. The $79.45 level is a crucial pivot. A break below it could accelerate the sell-off, while holding it might lead to a test of higher ground. Traders should remain vigilant, monitor the DXY closely, and be prepared for volatility. The price action around the $79.15 support will be key in the short term.
Frequently Asked Questions: XAGUSD Analysis
What happens if XAGUSD breaks below the $79.15 support level?
A break below $79.15 on the 1-hour chart, confirmed by negative MACD momentum, would likely trigger further selling pressure. This could lead to a test of the next significant support at $78.50, with the daily support at $77.48 becoming the primary target for the bears.
Should I consider buying XAGUSD at current levels around $79.45 given the mixed signals?
Buying at current levels is risky due to the strong bearish signals on the 4-hour chart (ADX 46.59) and the strong DXY at 99.41. A more prudent approach would be to wait for a confirmed break above resistance like $80.28, or for a clear bounce off the $77.48 daily support level, which would offer a better risk-reward ratio.
Is the RSI at 46.25 on the daily chart a sell signal for XAGUSD?
An RSI of 46.25 on the daily chart is considered neutral to bearish, indicating that while the price is not oversold, the momentum is leaning towards the downside. It doesn't act as a direct sell signal but suggests caution and aligns with the bearish outlook, especially when combined with other indicators like MACD and ADX.
How will the upcoming Fed policy decisions affect XAGUSD this week?
The market is awaiting Fed policy decisions, and any hawkish signals (higher rates for longer) would likely strengthen the DXY and put further downward pressure on XAGUSD. Conversely, dovish signals or hints of rate cuts could weaken the dollar, potentially supporting silver prices and leading to a test of resistance levels above $80.
"Volatility creates opportunity - those prepared will be rewarded."
Track markets in real-time
AI-powered analysis, technical indicators and real-time price data.
Join Our Telegram Channel
Breaking market news, AI analysis and trading signals instantly.
Join Channel