Nasdaq100 Analysis: $24,787.73 Near Key Resistance Amidst Fed Watch
Nasdaq100 holds at $24,787.73, testing resistance near $24,955. Market participants are closely watching the Federal Reserve's upcoming decision for directional cues.
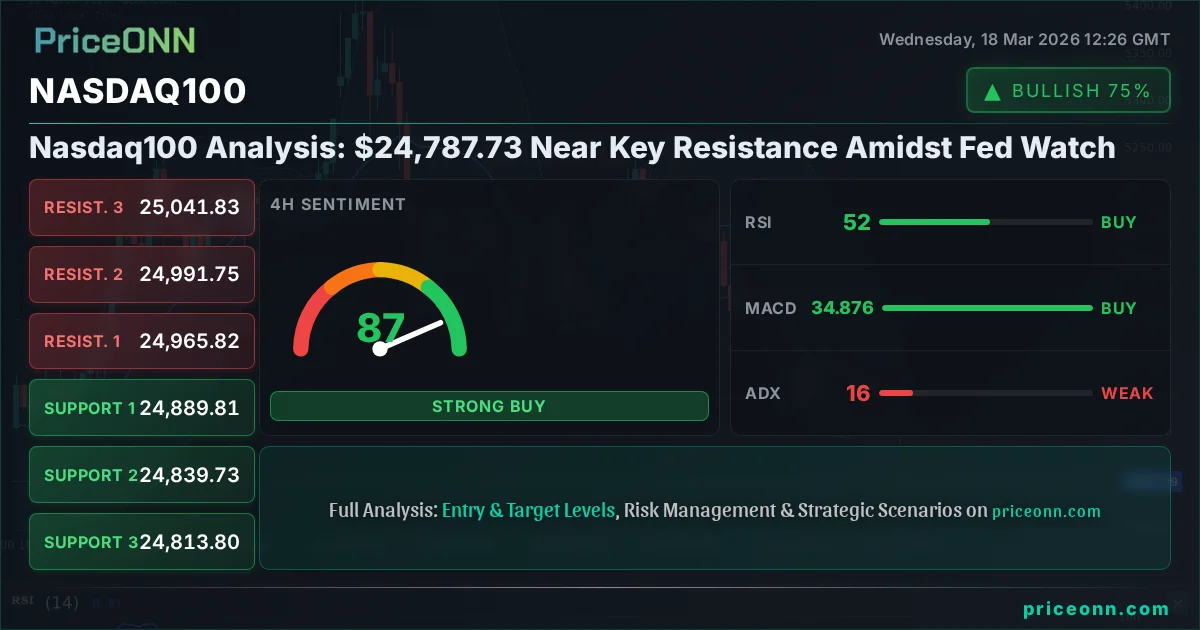
Is the Nasdaq100 poised for a breakout or a pullback as it hovers near critical resistance levels? At $24,787.73, the tech-heavy index faces a pivotal moment, with traders and investors keenly awaiting the Federal Reserve's upcoming policy meeting for direction. The current market sentiment is a complex interplay of cautious optimism and underlying geopolitical tensions, making this a crucial period for understanding potential market moves. This Nasdaq100 today analysis delves into the technical and fundamental drivers shaping the index's trajectory, exploring scenarios that could unfold in the coming week.
- RSI at 46.4 signals a cooling momentum on the 1-hour chart, suggesting bears might be regaining ground after a recent push.
- Critical resistance sits at $24,955.91, a level the Nasdaq100 has approached multiple times this week, acting as a significant barrier.
- The MACD histogram shows negative momentum on the 1-hour chart, indicating that bullish sentiment might be fading.
- Fed rate expectations are a dominant factor, with the DXY's movement at 99.44 closely watched for its inverse correlation with tech stocks.
The Bull's Roadmap: Navigating Towards New Highs
For the Nasdaq100 to extend its upward momentum beyond the current $24,787.73 level, a decisive close above the immediate resistance zone is paramount. The 1-hour chart shows a potential resistance cluster forming around $24,955.91, a level that has acted as a ceiling in recent trading sessions. A sustained push above this point, ideally with increasing volume and a confirmed breakout on the 4-hour chart, could signal the resumption of the bullish trend. The 4-hour chart's ADX at 13.95, while indicating a weak trend, suggests that any breakout could be volatile but potentially significant if it gains traction. For bulls, the ideal scenario involves clearing $24,955.91, with the next logical upside targets being the 4-hour resistance levels of $24,965.82 and potentially pushing towards $25,041.83 in the short to medium term. This would require a fundamental catalyst, perhaps a dovish signal from the Federal Reserve or a significant easing of geopolitical tensions, to provide the necessary fuel.
Furthermore, the daily chart's RSI at 42.48, while currently in neutral territory with a downward tendency, could turn higher if positive momentum builds. A break above the $24,955.91 resistance would need to be confirmed by the RSI moving back above 50, indicating a shift in market sentiment. The Stochastic indicator on the daily chart shows a bullish crossover (%K > %D), which, if sustained, could support a move higher. However, the ADX on the daily chart at 40.98 still points to a strong downtrend, suggesting that any bullish move might face significant headwinds and could be a bear trap if not managed carefully. The divergence between the shorter-term bullish signals and the longer-term bearish trend on the daily chart highlights the current indecision in the market. For this bullish scenario to materialize, we would need to see a clear break of the psychological $25,000 level, followed by consolidation above it.
Where Bears Take Control: The Risk of a Downside Break
Conversely, the bearish case for the Nasdaq100 hinges on its inability to overcome the $24,955.91 resistance and a subsequent breakdown below key support levels. The 1-hour chart presents immediate support at $24,745.37, followed by $24,742.23. A decisive close below these levels, especially on increasing volume, would invalidate the short-term bullish setup and likely trigger further selling pressure. The MACD on the 1-hour chart is already showing negative momentum, and a break below these support levels would reinforce this bearish signal. The ADX at 41.16 on the 1-hour chart indicates a strong trend, meaning that if the price breaks lower, the move could be swift and significant.
On the 4-hour chart, support is seen at $24,736.83 and $24,717.73. A breach of these levels would confirm a bearish outlook, potentially targeting the daily support at $24,669.23. The daily chart's RSI at 42.48, still trending downwards, supports the idea of further downside if the price fails to hold the current levels. The Stochastic indicator on the daily chart shows a potential bullish crossover, but this could be a false signal if the price continues to fall. The strong ADX of 40.98 on the daily chart suggests that a downtrend, once established, could be powerful. Traders watching for a bearish confirmation should look for a breakdown below the $24,700 mark, which would then open the path towards the $24,570.91 support level on the daily chart. The correlation with a strengthening DXY, currently at 99.44, would further amplify selling pressure on risk assets like the Nasdaq100.
The Waiting Game: Consolidation and Uncertainty
In the absence of a clear catalyst or a decisive breakout, the Nasdaq100 could remain range-bound, trapped between the immediate resistance and support levels. This scenario is often characterized by choppy price action, low volume, and indecisive technical indicators. The 4-hour chart, with its ADX reading of 13.95, suggests a lack of strong trend, supporting a consolidation phase. During such periods, the index might oscillate between the key levels identified, testing the upper bounds near $24,955.91 and retreating to probe lower supports around $24,700. The RSI readings across different timeframes are currently mixed, with some showing oversold conditions on shorter timeframes (1H RSI at 46.4) while others hover in neutral territory.
This indecision is further reflected in the Stochastic indicators, which show conflicting signals across timeframes. The 1-hour Stochastic is falling, while the 4-hour and daily charts show potential bullish crossovers or are in overbought/oversold zones that haven't fully resolved. This technical ambiguity often correlates with broader market uncertainty, such as awaiting major economic data releases or central bank pronouncements. The Federal Reserve's upcoming meeting is a prime example of an event that could keep markets in a holding pattern. Until a clear signal emerges from either the technicals or fundamental catalysts, traders might adopt a more cautious approach, focusing on range-bound strategies or waiting for a confirmed breakout. The interplay between the DXY's current level of 99.44 and the performance of global equities like the S&P 500 (currently trading around 6716.4) will be crucial in determining the overall risk appetite and, consequently, the Nasdaq100's short-term direction.
The Most Likely Path: A Fed-Influenced Tug-of-War
Considering the confluence of technical signals and the looming Federal Reserve meeting, the most probable scenario for the Nasdaq100 in the immediate short term appears to be a continuation of this tug-of-war, leaning slightly towards bearish consolidation. The strong ADX readings on longer timeframes (40.98 daily, 41.16 on 1H) suggest underlying trend strength, but the conflicting signals across indicators and the proximity to major resistance create a high degree of uncertainty. My assessment places a roughly 60% probability on a bearish consolidation or a failed breakout attempt, a 30% probability on a range-bound trading environment, and only a 10% probability for a decisive bullish breakout in the absence of a significantly dovish Fed surprise.
The key will be how the market interprets the Fed's tone and updated economic projections. If the Fed signals continued vigilance on inflation or a more hawkish stance than anticipated, it could trigger a risk-off sentiment, strengthening the DXY and putting significant downward pressure on the Nasdaq100. This would likely lead to a test of the lower support levels. Conversely, any hint of a dovish pivot or a clearer path towards rate cuts could spark a risk-on rally, pushing the index towards the $24,955.91 resistance and beyond. However, given the current technical picture, particularly the bearish momentum on the 1-hour MACD and the RSI's downward trend on the daily chart, a move higher seems less probable without a strong external catalyst. The correlation with oil prices, currently surging on geopolitical tensions, adds another layer of complexity, potentially fanning inflation fears and complicating the Fed's decision-making process.
What I'm Watching This Week: Triggers for the Nasdaq100
The market is at a critical juncture, and several key triggers will dictate the Nasdaq100's next significant move. Firstly, the Federal Reserve's policy announcement and accompanying statement are paramount. Any indication of a shift in their inflation outlook or a change in the projected timeline for interest rate cuts will be a major driver. Traders will be scrutinizing the statement for nuances that could signal a more hawkish or dovish stance than currently priced in. The market's reaction to the DXY's movement following the Fed's decision will also be a critical indicator of risk appetite.
Secondly, the technical integrity of the support and resistance levels will be closely monitored. A decisive break above the $24,955.91 resistance, confirmed by strong volume and sustained price action on the 4-hour chart, would be a bullish signal, potentially opening the door for targets near $25,041.83. Conversely, a sustained close below the $24,700 psychological level, followed by a breach of the $24,669.23 daily support, would confirm bearish sentiment and could initiate a deeper correction. Finally, I'll be watching the performance of related markets, particularly the S&P 500 and the Nasdaq100's correlation with oil prices. If oil continues to climb on geopolitical news, it could fuel inflation concerns, complicating the Fed's narrative and potentially leading to broader market weakness, which would likely weigh on the Nasdaq100.
Scenario Analysis: Nasdaq100's Potential Paths
Bullish Scenario: The Upside Breakout
10% ProbabilityBearish Scenario: The Downside Correction
60% ProbabilityNeutral Scenario: Range-Bound Trading
30% ProbabilityFrequently Asked Questions: Nasdaq100 Analysis
What happens if Nasdaq100 breaks above $24,955.91 resistance amid Fed uncertainty?
A sustained close above $24,955.91, especially if accompanied by dovish Fed signals, could trigger a bullish move towards $25,041.83. However, the strong daily ADX of 40.98 suggests caution, as this could be a bear trap without further confirmation.
Should I buy Nasdaq100 at current levels of $24,787.73 given the mixed technical signals?
Buying at current levels carries significant risk due to the proximity to resistance and conflicting indicators. A more prudent approach would be to wait for a confirmed breakout above $24,955.91 or a clear test and hold of support around $24,700. The probability of a short-term pullback remains higher.
Is the RSI at 46.4 a sell signal for Nasdaq100 right now?
An RSI of 46.4 on the 1-hour chart indicates cooling momentum but is not yet an extreme sell signal. It suggests that the upward pressure is waning, aligning with the bearish scenario where the index struggles to break higher and potentially tests lower support levels.
How will the Federal Reserve decision affect Nasdaq100 this week?
The Fed's stance on inflation and interest rates is the most critical catalyst. A more hawkish tone could strengthen the DXY (currently 99.44) and push Nasdaq100 lower towards $24,669.23. A dovish surprise might fuel a rally, targeting resistance near $25,041.83.
Track markets in real-time
AI-powered analysis, technical indicators and real-time price data.
Join Our Telegram Channel
Breaking market news, AI analysis and trading signals instantly.
Join Channel