AUDUSD Tests Key Resistance at $0.70864 Amidst Mixed Signals
AUDUSD faces a critical juncture at $0.70864. Bullish momentum battles bearish indicators as traders await crucial economic data and DXY movements.
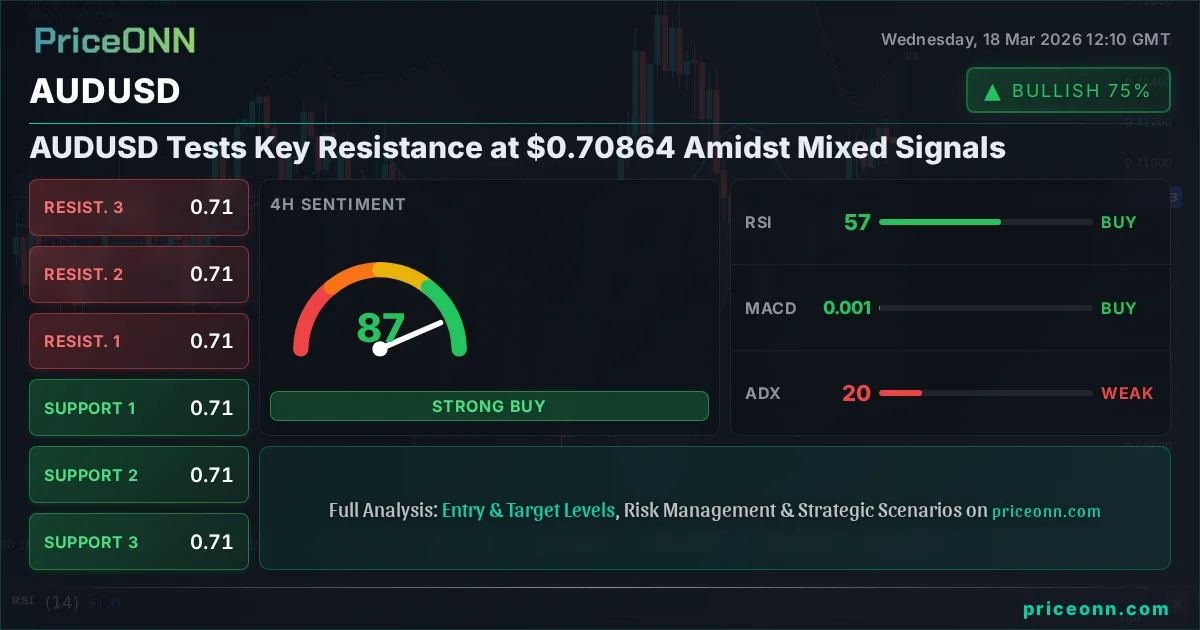
AUDUSD today analysis shows the pair hovering precariously around the $0.70864 mark, a level that has become a battleground between lingering bullish sentiment and growing bearish pressures. This critical juncture demands close attention as multiple technical indicators flash conflicting signals, while broader market correlations with the US Dollar Index (DXY) and risk appetite dynamics add layers of complexity. The question on every trader's mind is whether the current price action represents a fleeting pause before a renewed ascent or a precursor to a more significant pullback. Understanding the interplay of these factors is paramount for navigating the immediate future of the Australian dollar.
- RSI at 49.19 on the 1H chart suggests a neutral to slightly bearish leaning, indicating a lack of strong buying conviction.
- The critical support level to watch is $0.70897, which has been tested multiple times this week, with a decisive break below potentially opening the door for further declines.
- MACD histogram shows negative momentum on the 1H chart, indicating bearish pressure is building, contrasting with some higher timeframe bullish signals.
- The DXY at 99.4 is showing signs of strength, which typically exerts downward pressure on risk-sensitive currencies like AUDUSD.
The Bull Case: Resilience Despite Headwinds
A Foundation Built on Higher Timeframes
The argument for AUDUSD extending its gains, despite the immediate headwinds, rests significantly on the signals from the daily timeframe. The daily chart paints a picture of a nascent bullish trend, with the ADX at 21.47 suggesting a moderately strengthening trend, albeit one that has yet to fully commit. The RSI(14) at 54.42 sits comfortably in neutral territory, leaning slightly bullish, which historically has provided a fertile ground for further upside before hitting overbought conditions. Furthermore, the Stochastic Oscillator on the daily chart shows %K at 57.13 and %D at 56.15, indicating a bullish crossover and a potential continuation of upward momentum. This suggests that while the 1-hour and 4-hour charts might be showing signs of consolidation or even weakness, the longer-term picture still holds potential for the bulls.
Momentum and Stochastic: Glimmers of Hope
Looking deeper into the technicals, the 4-hour chart offers some support for the bullish narrative, albeit with caveats. While the ADX at 19.87 indicates a choppy, ranging market rather than a strong trend, the MACD is showing positive momentum, with the MACD line above the signal line. This can sometimes precede a breakout, especially if other oscillators align. The Stochastic Oscillator on the 4-hour chart is particularly noteworthy: %K stands at 92.05, and %D at 90.76. This places the pair deep into overbought territory, which can be a double-edged sword. In a strong uptrend, this can signal continued strength, but in a less defined trend, it often precedes a sharp reversal or a period of consolidation. The fact that the MACD is showing positive momentum here, despite the extreme Stochastic readings, suggests that some underlying strength might still be present, waiting for a catalyst.
Correlation and Sentiment: Seeking a Risk-On Environment
The bull case also hinges on a shift in broader market sentiment and a potential weakening of the US Dollar Index (DXY). Currently, the DXY is trading at 99.4, showing a slight upward bias on the 1-hour chart (ADX 27.63) and a neutral stance on the 4-hour (ADX 20.06), but a strong bullish trend on the daily (ADX 34.21). This strength in the dollar is a natural headwind for AUDUSD. For the AUDUSD to sustainably move higher, we would ideally need to see the DXY falter, perhaps due to shifting Fed rate expectations or a general move towards risk-on sentiment globally. A decline in global risk aversion, supported by positive equity market performance (SP500 currently at 6728.4, Nasdaq at 24836.26, both showing slight gains today), could provide the necessary tailwind for the Australian dollar, which is often sensitive to global growth prospects.
The Bear Case: Technical Weakness and Macro Pressures
1-Hour Chart Signals Concern
The immediate picture painted by the 1-hour chart is predominantly bearish, and this is where short-term traders are likely focusing their attention. The ADX at 19.05 suggests a weak trend, which can often precede a sharp move in either direction, but the confluence of other indicators leans negative. The RSI(14) is at 49.19, indicating a slight bearish lean as it hovers below the 50 mark, suggesting a lack of buying conviction. More concerning is the MACD, which is showing negative momentum on this timeframe, with the MACD line below the signal line. This points to selling pressure building in the short term. Furthermore, the Stochastic Oscillator shows %K at 32.9 and %D at 56.14, a clear bearish crossover and a signal that momentum is fading to the downside. The price also sits below the middle Bollinger Band on the 1-hour chart, indicating bearish pressure.
Daily Chart Divergence and the DXY Factor
While the daily chart might offer some solace to the bulls, there are bearish undercurrents even on longer timeframes. The daily ADX at 13.83 indicates a very weak trend on the gold chart (XAUUSD at 4917.09), which can sometimes spill over into broader commodity and currency markets, though the direct correlation isn't always strong. However, the daily DXY's strong upward trend (ADX 34.21) remains a significant concern. If the DXY continues to climb, it will likely drag AUDUSD lower. The daily RSI at 42.99, while not deeply oversold, is trending downwards, suggesting that momentum is shifting away from buyers even on the daily scale. The daily Stochastic also shows %K at 9.34 and %D at 22.26, indicating a bearish signal and a move towards oversold territory, reinforcing the idea that the upside may be limited.
Commodity Weakness and Geopolitical Uncertainty
The AUDUSD's correlation with commodity prices, particularly gold (XAUUSD at 4917.09, down 1.76% today) and silver (XAGUSD at 78.57, down 0.85%), cannot be ignored. The sharp decline in precious metals today, despite some geopolitical tensions (as noted in news about the Strait of Hormuz and Iraq/Kurdistan oil exports), suggests a risk-off move or a strong dollar effect is currently dominating. This weakness in commodities, which often act as a proxy for broader commodity currencies like the AUD, adds another layer to the bearish argument. Geopolitical tensions, while typically a driver for safe-haven assets, are currently being overshadowed by broader macroeconomic concerns and the strength of the US dollar, creating an environment where risk assets, including AUD, struggle to find consistent footing.
The Technical Crossroads: What the Indicators Are Saying
Short-Term vs. Long-Term Conflict
The most striking aspect of the current AUDUSD technical setup is the divergence between timeframes. The 1-hour chart is flashing multiple bearish signals: RSI below 50, negative MACD momentum, and a bearish Stochastic crossover. This suggests immediate selling pressure and potential for a move towards the nearest support at $0.70897. However, the 4-hour chart presents a mixed bag, with Stochastic deep in overbought territory but MACD showing positive momentum. The daily chart, while showing a weak trend overall (ADX 13.83), does offer some longer-term bullish undertones with RSI leaning positive and Stochastic having recently made a bullish crossover, albeit from very low levels. This conflict means that any move is likely to be choppy until one timeframe's signals dominate the other.
The Role of ADX and Trend Strength
The Average Directional Index (ADX) provides crucial context for interpreting these conflicting signals. On the 1-hour chart, ADX is at 19.05, indicating a weak trend. On the 4-hour, it rises to 19.87, still suggesting a lack of strong directional conviction. However, the daily ADX sits at 13.83, confirming a very weak trend overall. This low ADX reading across multiple timeframes is key. It suggests that the market is not yet committed to a strong directional move. Therefore, signals from oscillators like RSI and Stochastic should be interpreted with caution. A bearish signal on the 1-hour might not hold if the underlying trend strength is absent, and conversely, a bullish signal on the daily could be easily drowned out by short-term selling pressure. This low ADX environment is precisely why the market is currently in a 'WATCH_ZONE' – it's a period of consolidation and indecision.
Price Action as the Ultimate Arbiter
Ultimately, price action will be the decider. The key level to watch remains around $0.70897, which serves as the first significant support on the 1-hour chart. A decisive break below this level, especially on increasing volume, would likely invalidate any immediate bullish hopes and could trigger a cascade towards the next support at $0.70847. Conversely, if AUDUSD can hold above $0.70897 and then push higher, the resistance at $0.71091 becomes the immediate target. A break and hold above this resistance level, confirmed by a rising ADX and bullish signals from oscillators across multiple timeframes, would strengthen the bull case significantly and potentially open the door for a move towards the $0.7200 target mentioned in emerging queries.
The Verdict: Cautious Optimism Tempered by Short-Term Risk
Why AUDUSD is Currently in a 'WATCH_ZONE'
The current technical landscape for AUDUSD is best described as a 'WATCH_ZONE'. The daily chart hints at underlying strength and potential for a bullish trend continuation, supported by a moderately strengthening ADX and bullish Stochastic crossover. However, this is significantly contradicted by the immediate bearish signals on the 1-hour chart, including negative MACD momentum and a bearish Stochastic crossover, coupled with the persistent strength of the DXY. The low ADX readings across timeframes reinforce the idea that the market is not yet exhibiting strong directional conviction. This choppy, indecisive environment makes aggressive trades risky. The key is to wait for clearer signals and confirmation.
The Bullish Scenario: Breaking the Consolidation
For the bullish scenario to gain traction, AUDUSD needs to decisively break above the immediate resistance at $0.71091. This would require overcoming the current bearish sentiment on the 1-hour chart and potentially seeing a pullback in the DXY. A daily close above $0.71091, especially if accompanied by an increase in ADX and bullish alignment across multiple timeframes, would be a strong signal. The 'aud usd 0.7200 target' mentioned in emerging queries would then become a more plausible objective. The trigger for this scenario would be a sustained move above $0.71091, with invalidation occurring on a close below $0.70897. Target 1 could be $0.71152, and Target 2 could extend towards $0.71438, aligning with higher timeframe resistance levels.
The Bearish Scenario: Support Failure
Conversely, the bearish scenario hinges on the failure of the current support levels. The immediate level to watch is $0.70897. A break below this, particularly on the 1-hour chart with increasing volume and bearish confirmation from RSI and MACD, could signal the start of a more significant downtrend. The DXY's strength further supports this potential downside. Invalidation of this bearish thesis would occur on a firm break and hold above $0.71091. The trigger for the bearish move would be a break below $0.70897, with Target 1 at $0.70847 and Target 2 potentially reaching $0.70770, which aligns with the 4-hour support levels. The 'audusd fundamentals' aspect also plays a role; any negative surprises in Australian economic data could accelerate this move.
What Needs to Happen for a Clear Trade Setup
Currently, the market is too mixed for a high-conviction trade. The ADX readings across 1H, 4H, and 1D (19.05, 19.87, 13.83 respectively) clearly indicate a lack of strong trend. While the daily chart offers some long-term bullish potential, the immediate 1-hour signals are bearish, and the DXY's upward momentum cannot be ignored. For a valid trading setup to emerge, we need to see either a decisive breakout above the key resistance zone around $0.71091-$0.71152, supported by bullish confirmation across multiple timeframes and a weakening DXY, or a clear breakdown below the support at $0.70897-$0.70847, with bearish confirmation and sustained dollar strength. Until then, patience and risk management are key. The market is providing clues, but not yet a clear directive.
Navigating the Uncertainty: Strategy and Outlook
The Importance of Confirmation
In such a 'WATCH_ZONE' environment, confirmation is king. Traders should not be tempted to pre-empt the market's next move based on conflicting signals. Waiting for a clear break of either the established support around $0.70897 or the resistance near $0.71091 is crucial. Confirmation should ideally come from multiple sources: a decisive price action (e.g., a strong daily candle close above resistance or below support), alignment of indicators across at least two timeframes (e.g., 1-hour and 4-hour, or 4-hour and daily), and a clear directional bias from the DXY. Without this confluence, any trade entered now carries a higher risk of whipsaws and false signals. The 'aud usd 0.7200 target' remains a possibility, but only if the current consolidation breaks to the upside with conviction.
Considering the Macro Backdrop
The fundamental backdrop adds another layer of complexity. Upcoming economic data releases, particularly those influencing the US Federal Reserve's policy stance, will be critical. Any hints of persistent inflation or a strong labor market could bolster the DXY, putting pressure on AUDUSD. Conversely, signs of economic cooling could lead to a weaker dollar and support for AUD. Geopolitical developments also remain a background risk; while tensions around the Strait of Hormuz and oil exports from Iraq/Kurdistan are present, their immediate impact on AUDUSD seems muted compared to the dollar's strength and technical positioning. However, any escalation could shift risk sentiment rapidly, benefiting or penalizing AUDUSD depending on the safe-haven flows.
Risk Management is Paramount
Given the current indecision and the conflicting signals, a disciplined approach to risk management is non-negotiable. Traders should be prepared for volatility and potential choppy price action. Entries should only be considered when a clear setup emerges, and stops should be placed judiciously to protect capital. For those looking for a bullish setup, waiting for a confirmed break above $0.71091 with appropriate risk management would be prudent. For bearish traders, a confirmed break below $0.70897 would be the signal. For now, observing the market's reaction at these key levels is the most sensible strategy. The 'audusd fundamentals' analysis suggests that upcoming data will be crucial in determining the next directional move, making patience a virtue.
Scenario Analysis: Mapping Potential Paths
Bearish Scenario: Support Breakdown
55% ProbabilityNeutral Scenario: Range-Bound Consolidation
30% ProbabilityBullish Scenario: Resistance Breakout
15% Probability| Indicator | Value | Signal | Interpretation |
|---|---|---|---|
| RSI (1H) | 49.19 | Neutral | Slightly bearish lean, lacks conviction |
| MACD (1H) | -0.0001 | Bearish | Negative momentum building |
| Stochastic (1H) | K:32.9, D:56.14 | Bearish Crossover | Momentum fading downside |
| ADX (1D) | 13.83 | Weak Trend | Market lacks strong directional commitment |
| DXY (1D) | 99.4 | Bullish Trend | Dollar strength poses a headwind |
Frequently Asked Questions: AUDUSD Analysis
What happens if AUDUSD breaks below the $0.70897 support level?
A break below $0.70897, particularly on a daily close, would invalidate short-term bullish hopes and trigger a bearish move. This could lead to further declines towards the $0.70847 level, with a secondary target at $0.70770 as the market assesses broader risk sentiment and dollar strength.
Should I buy AUDUSD at current levels around $0.70864 given the mixed signals?
Entering a trade at current levels around $0.70864 is not recommended due to the conflicting signals and weak trend strength (ADX 13.83 daily). A high-probability setup would require waiting for a confirmed break above $0.71091 resistance or below $0.70897 support, with confirmation from multiple timeframes and clearer macro drivers.
Is the RSI at 49.19 a bearish signal for AUDUSD right now?
An RSI of 49.19 on the 1-hour chart indicates a slight bearish lean, suggesting a lack of strong buying conviction in the immediate short term. While not definitively bearish on its own, it contributes to the overall picture of caution, especially when viewed alongside negative MACD momentum.
How will the upcoming DXY strength at 99.4 affect AUDUSD this week?
The current DXY strength, trading at 99.4 with a bullish daily trend, typically exerts downward pressure on AUDUSD. If the dollar index continues to climb, it could be a significant catalyst for a bearish move in AUDUSD, potentially pushing it towards the lower support levels discussed.
Track markets in real-time
AI-powered analysis, technical indicators and real-time price data.
Join Our Telegram Channel
Breaking market news, AI analysis and trading signals instantly.
Join Channel