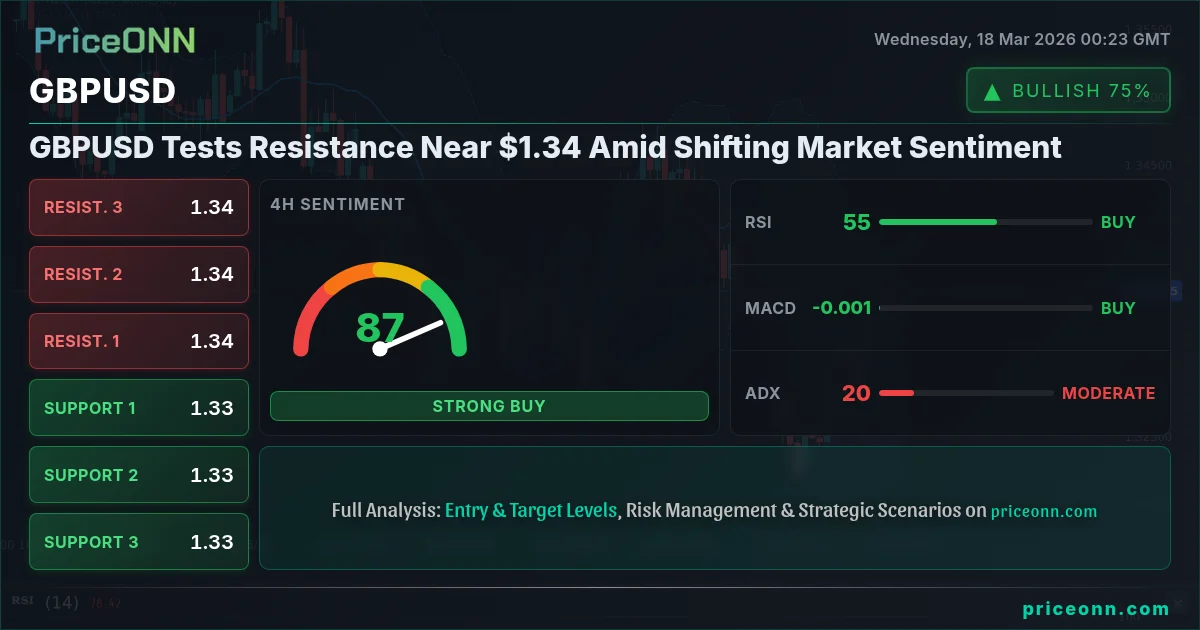
GBPUSD Tests Resistance Near $1.34 Amid Shifting Market Sentiment
GBPUSD hovers near $1.34 as traders weigh mixed signals from the BoE and a cautious DXY. Key levels to watch.
The currency markets are a delicate dance of correlation and divergence, and right now, GBPUSD is performing a complex routine. While the pair currently trades around the $1.34 mark, the underlying technical signals and broader market context paint a picture of cautious indecision. Having tracked GBPUSD through the recent volatility, it's clear that the path forward isn't a straight line. The current price action suggests a tug-of-war between bullish momentum and bearish headwinds, making it crucial to dissect the data and understand what's truly driving the Sterling's next move. This isn't just about one currency pair; it's about deciphering the risk appetite across global markets, from the strength of the US Dollar Index (DXY) to the price of oil and the sentiment in major equity indices like the S&P 500 and Nasdaq.
- GBPUSD is trading near $1.34, with resistance eyed at $1.33627 and support at $1.33530.
- The DXY is consolidating near 99.11, indicating a pause in dollar strength that offers some respite to GBPUSD.
- Mixed signals from technical indicators like RSI (64.3 on 1H) suggest caution, despite a generally positive short-term trend.
- Geopolitical factors and upcoming central bank decisions (BoE, SNB) are key drivers for the Sterling's outlook.
Navigating the Sterling's Tightrope Walk
The GBPUSD pair is currently exhibiting a fascinating interplay of forces. On the 1-hour chart, the trend is technically neutral, but the ADX at 23.28 indicates a moderately strong trend is trying to assert itself. The RSI reading of 64.3 suggests there's still room for upside, but it's getting into territory where bulls might start to feel the heat. Crucially, the Stochastic oscillator, while showing a potential pullback with %K at 77.51 below %D at 81.45, is coming from an overbought condition. This often precedes a consolidation or a minor retracement. The MACD is in positive territory, signaling bullish momentum, but it’s the subtle divergences and the confluence of signals that demand attention. The price is hovering just below the resistance level at $1.33627, a critical point that will likely dictate the short-term direction.
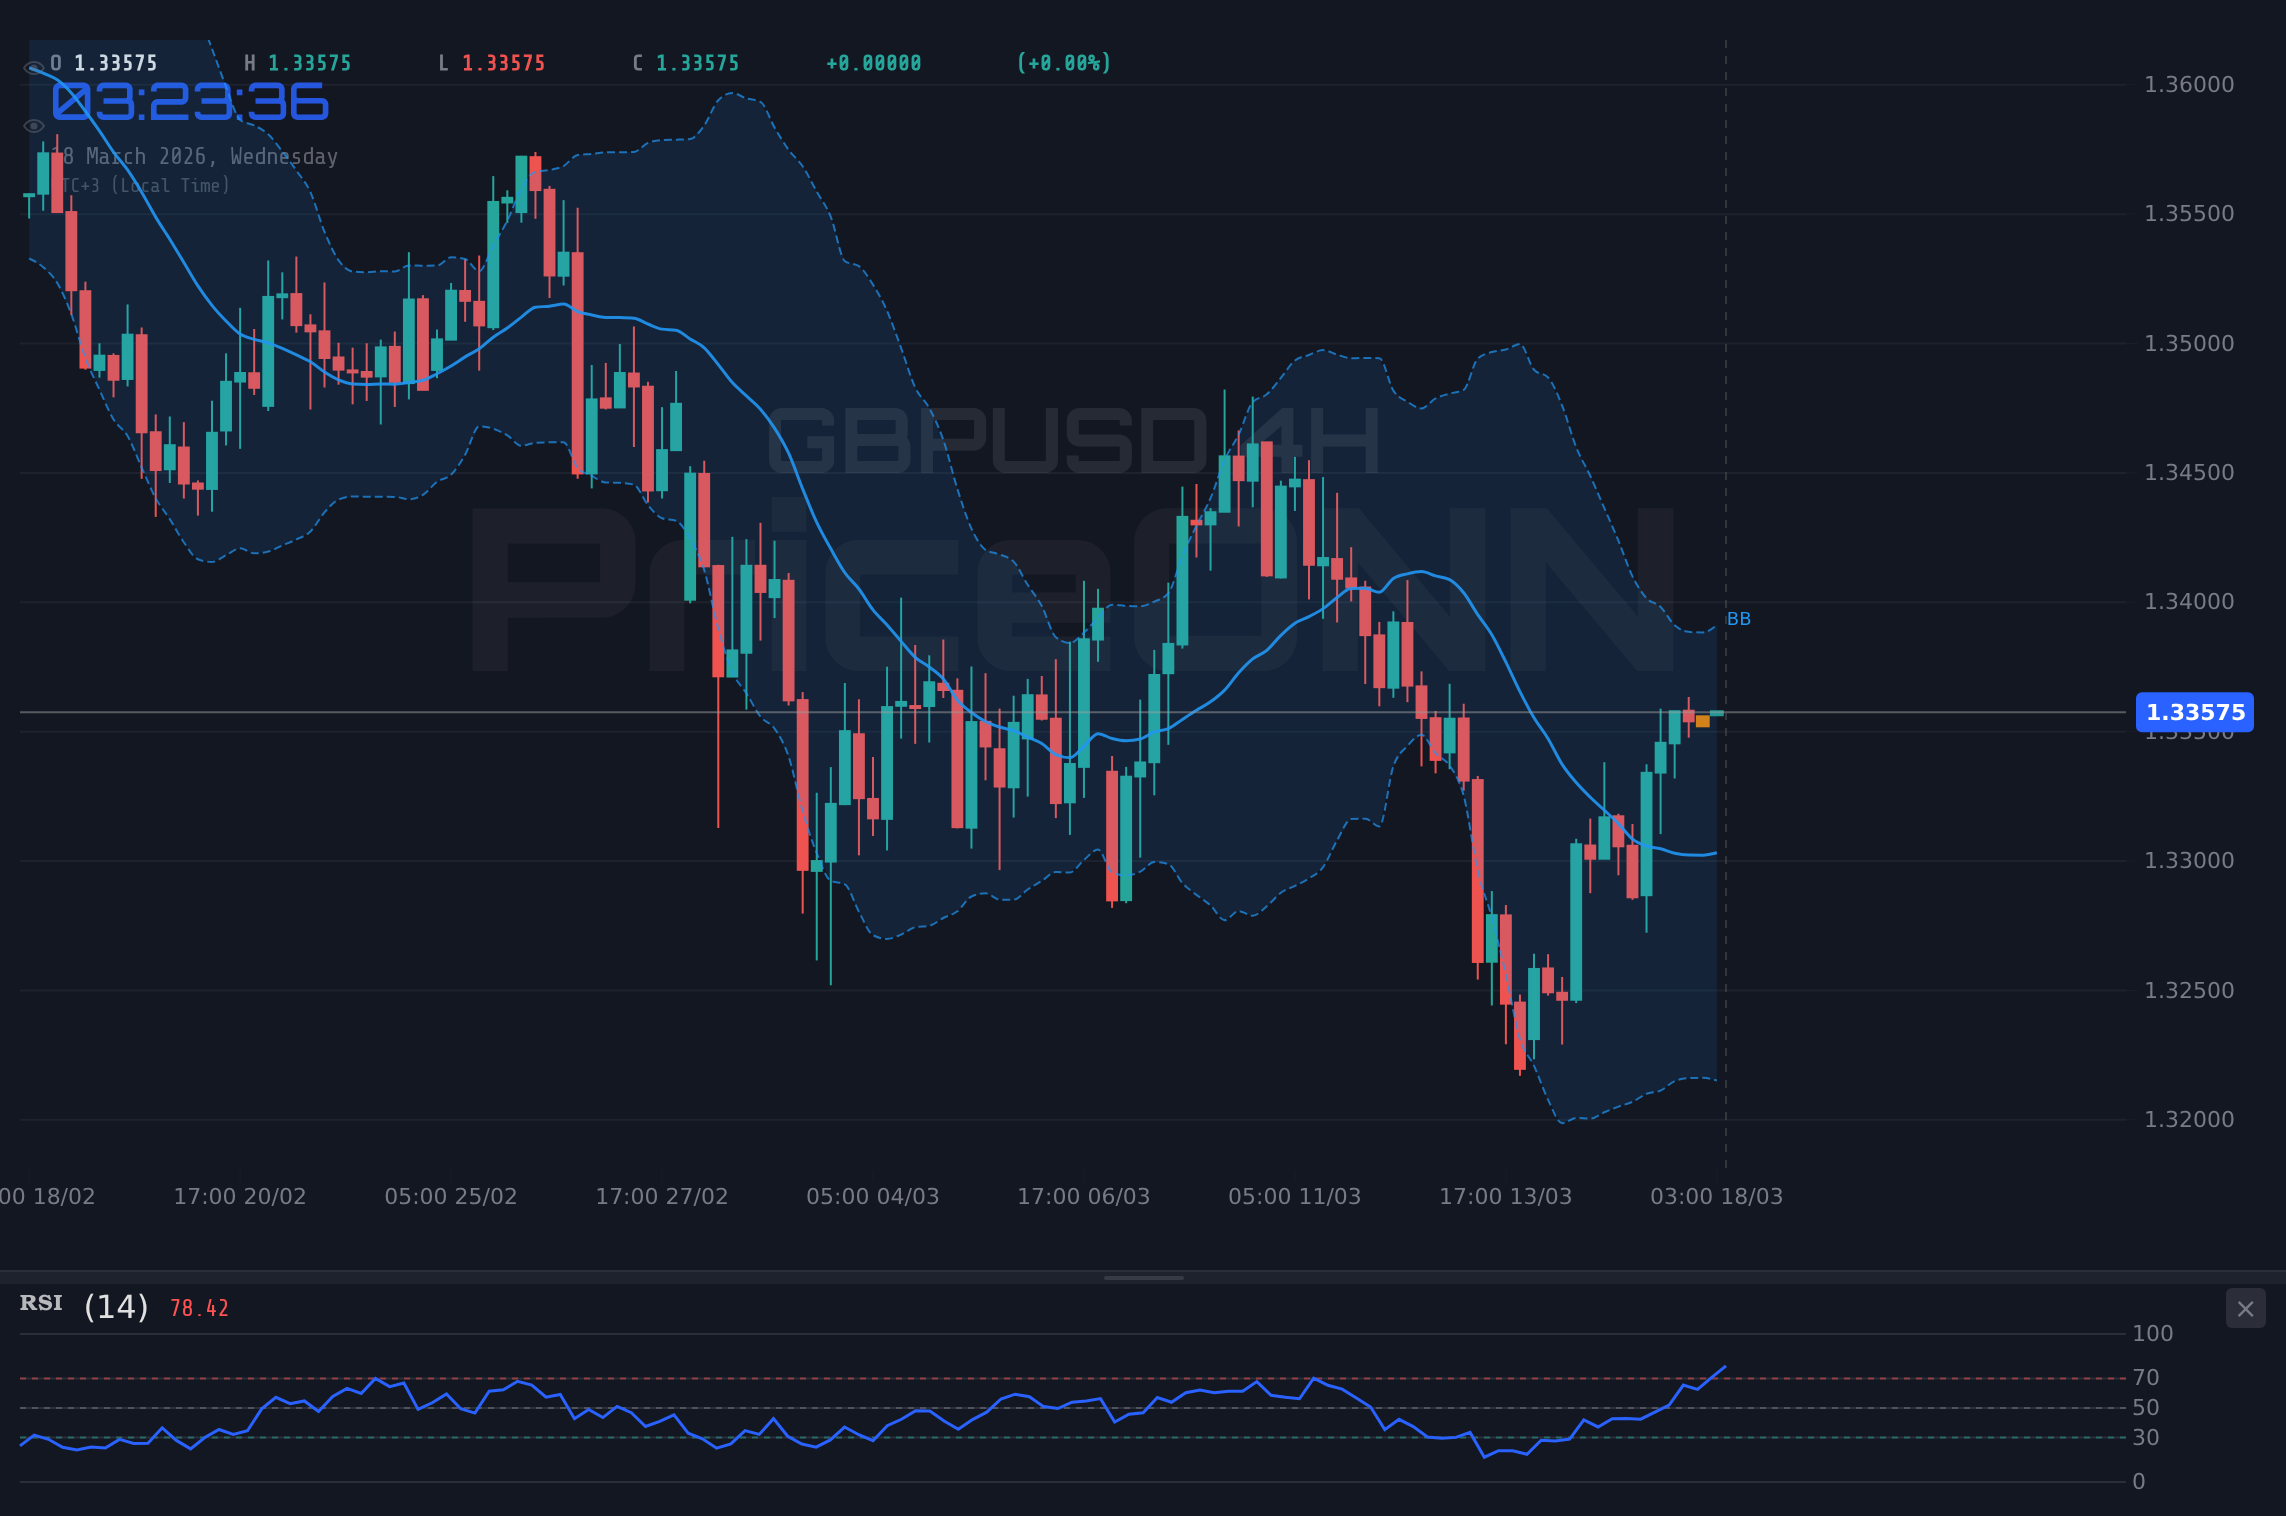
Looking at the 4-hour timeframe, the picture becomes a bit more nuanced. The trend is still categorized as neutral, with the ADX softening slightly to 20.29, suggesting that the conviction behind the current move might be waning. The RSI at 54.69 is comfortably in the neutral zone, offering no strong directional bias. However, the Stochastic oscillator here is deeply in overbought territory, with %K at 93.7 and %D at 82.05. This is a significant warning sign for immediate upside continuation. While the MACD maintains positive momentum, the high Stochastic readings on this timeframe suggest that any further upside could be met with sharp profit-taking. The price is currently trading above the 4-hour middle Bollinger Band, which is generally bullish, but the overbought Stochastic is a red flag that cannot be ignored. This divergence between the trend-following indicators and the momentum oscillators warrants a cautious approach.
On the daily chart, the longer-term perspective shows a different story. The trend is decidedly bearish, with an ADX of 31.03 indicating a strong downtrend is still in play. The RSI at 43.66 is firmly in the neutral-to-bearish territory, and the MACD is showing negative momentum, with the histogram below the signal line. The price is trading below the middle Bollinger Band, reinforcing the bearish bias. The Stochastic oscillator, with %K at 30.12 and %D at 40.55, is signaling a potential bounce, but it's still in the lower half of its range, suggesting any upward move might be corrective rather than a reversal. The overall signal from the daily timeframe leans heavily towards 'SELL', a stark contrast to the more mixed signals on the shorter timeframes. This multi-timeframe analysis highlights the critical juncture GBPUSD finds itself in; short-term optimism is battling a longer-term bearish trend.
The Dollar's Shadow: DXY's Influence
No analysis of GBPUSD is complete without a keen eye on the US Dollar Index (DXY). Currently consolidating around 99.11, the DXY is showing signs of a pause in its recent uptrend. On the 1-hour chart, the ADX at 27.71 still points to a strong downtrend, with RSI at 44.07 and MACD in negative territory. This suggests the dollar might be finding some temporary footing or entering a period of consolidation. The Stochastic oscillator is showing a bullish signal (%K > %D), but from a low base, indicating potential for a short-term bounce rather than a sustained rally. On the 4-hour chart, the trend is also neutral with a strong downtrend indicated by ADX 23.55. RSI is at 49.21, and MACD remains negative. The Stochastic is in oversold territory, signaling a potential upward correction for the dollar. The daily DXY chart, however, paints a different picture with a strong bullish trend (ADX 33.05), RSI at 61.95, and positive MACD momentum. This divergence between the short-term neutral/downtrend signals and the longer-term bullish trend on the DXY is crucial. A continued dip in the dollar, especially if it breaks below the 1-hour support at 99.12, could provide further tailwinds for GBPUSD, potentially pushing it towards the $1.33627 resistance. Conversely, any resurgence in dollar strength, particularly if it breaks above the 4-hour resistance at 99.28, would likely put renewed pressure on the Sterling.
Broader Market Context: Risk Sentiment and Commodities
The global risk sentiment is a key determinant of currency movements, and currently, it appears to be in a state of flux. The S&P 500, trading around 6719.6, shows a daily trend that is bearish, despite a recent uptick. The 1-hour chart shows a bullish trend with RSI at 56.5, but the 4-hour chart is neutral and the daily is strongly bearish (ADX 40.19). This mixed picture suggests caution among equity investors. Similarly, the Nasdaq 100, currently at 24818.25, shows a similar pattern: bullish on shorter timeframes but a bearish trend on the daily (ADX 32.28). This underlying weakness in major US indices suggests that while there might be short-term bounces, the broader risk appetite might be fragile. This environment typically favors safe-haven assets, but the conflicting signals make it difficult to establish a clear risk-on or risk-off narrative.
Commodities offer another lens through which to view market sentiment. Brent crude is surging, currently trading at $103.77, with a strong bullish trend indicated by the daily ADX at 59.72 and RSI at 81.73. This sharp rise in oil prices, driven by geopolitical tensions and supply concerns, can fuel inflation expectations. Higher inflation could, in theory, lead to more hawkish central bank policies, which would typically support currencies like the USD. However, the current dynamics are more complex. While WTI is also showing a strong bullish trend (ADX 53.97, RSI 73.51), the conflicting signals on the 1-hour and 4-hour charts suggest some hesitation. The surge in oil prices, while bullish for energy assets, could also dampen global growth prospects, creating a mixed bag for risk assets and potentially leading to a flight to safety.
Silver, on the other hand, has experienced a significant tumble, falling to $79.47. The daily chart shows a strong bearish trend (ADX 15.87, though weak, the overall signal is sell). The 4-hour chart also indicates a strong bearish trend (ADX 40.92). This sharp decline in silver, despite a weaker dollar and falling yields, as noted in recent market commentary, is perplexing and suggests underlying selling pressure or a shift in investor sentiment away from precious metals, at least temporarily. This divergence between oil and silver adds another layer of complexity to the overall market picture, making it harder to establish a cohesive risk sentiment narrative that directly translates into a clear directional bias for GBPUSD.
Central Bank Watch: BoE and Beyond
The Bank of England's (BoE) stance on monetary policy remains a pivotal factor for GBPUSD. While the provided data doesn't include specific BoE meeting outcomes or forward guidance, recent market commentary suggests a holding pattern for rates. If the BoE maintains a cautious tone, emphasizing data dependency and potentially signaling a pause in tightening cycles, it could limit Sterling's upside potential, especially if other central banks, like the Fed, maintain a hawkish bias. The market is constantly pricing in future rate expectations, and any deviation from anticipated policy paths can trigger significant currency moves. Traders will be scrutinizing any hints about inflation outlook and economic growth from the BoE. The fact that GBPUSD is currently testing resistance near $1.33627, coupled with a bearish daily trend, suggests that a hawkish surprise from the BoE would be needed to break this longer-term pattern, while a dovish stance could exacerbate the downside.
The Swiss National Bank (SNB) is also on the radar, with USD/CHF showing a similar pattern of paring earlier gains and awaiting decisions. While not directly impacting GBPUSD as much as the BoE or Fed, the SNB's actions can influence the broader forex market sentiment and the strength of the US Dollar itself. If the SNB were to surprise with a more dovish stance, it could indirectly support GBPUSD by weakening the USD. Conversely, a more hawkish SNB could add to dollar strength, pressuring GBPUSD. The interplay between these central banks, especially when juxtaposed against the Federal Reserve's anticipated policy decisions, creates a complex environment. The market's interpretation of these central bank communications, particularly regarding inflation and growth forecasts, will be critical in determining whether GBPUSD can sustain any upward momentum or succumbs to the prevailing bearish trend.
Trade Scenarios and Risk Management
Given the mixed signals across different timeframes and the critical resistance level at $1.33627, a prudent approach is warranted. The 1-hour and 4-hour charts show some bullish momentum, but the daily chart remains bearish, and the Stochastic oscillator on the 4-hour chart is deeply overbought. This suggests that while a short-term bounce is possible, the risk of a reversal is significant.
Scenario A: Bullish Breakout
40% ProbabilityScenario B: Bearish Rejection
60% ProbabilityThe higher probability scenario, based on the dominant bearish trend on the daily chart and the overbought conditions on the 4-hour Stochastic, favors a rejection at the current resistance levels. However, the short-term bullish signals and the pause in DXY strength cannot be entirely dismissed. Traders should exercise caution and wait for clear confirmation before entering any positions. Risk management is paramount; setting tight stop-losses and clearly defining entry and exit points based on the levels provided is essential.
Upcoming central bank decisions from the Bank of England and the Swiss National Bank, coupled with key economic data releases, could introduce significant volatility. Traders should be prepared for potential whipsaws and ensure their risk management strategies are robust.
FAQ Section
What happens if GBPUSD breaks above the $1.33627 resistance level?
A sustained break above $1.33627, confirmed by RSI moving above 70 and positive MACD momentum, could signal a move towards the next resistance levels at $1.33926 and potentially $1.34076. This would indicate a shift in short-term sentiment, possibly driven by a weaker DXY or a hawkish surprise from the BoE.
Should I buy GBPUSD at current levels around $1.34 given the mixed signals?
Buying at current levels around $1.34 is risky due to the strong bearish trend on the daily chart and overbought Stochastic signals on the 4-hour timeframe. A higher-probability setup would involve waiting for a confirmed breakout above $1.33627 with bullish confirmation, or a clear rejection and close below $1.33530, signaling a move towards lower support levels.
Is the RSI at 64.3 on the 1-hour chart a sell signal for GBPUSD?
An RSI of 64.3 on the 1-hour chart is not inherently a sell signal; it indicates rising bullish momentum but is not yet in overbought territory (typically above 70). However, combined with the overbought Stochastic on the 4-hour chart and the bearish daily trend, it suggests that further upside may be limited and caution is advised before chasing further gains.
How will the upcoming central bank decisions affect GBPUSD this week?
Upcoming decisions from the BoE and SNB, alongside Fed commentary, are critical catalysts. A dovish BoE or SNB stance could weaken GBP and CHF respectively, potentially boosting GBPUSD if the DXY weakens. Conversely, any hawkish signals or stronger-than-expected US economic data could strengthen the DXY and pressure GBPUSD downwards, especially given its current bearish daily trend.
| Indicator | Value | Signal | Interpretation |
|---|---|---|---|
| RSI (14) | 64.3 | Neutral | Rising momentum, watch for overbought zone |
| MACD Histogram | +0.002 | Bullish | Positive momentum building |
| Stochastic (%K/%D) | 77.51 / 81.45 | Bearish | Overbought, potential pullback signal |
| ADX | 23.28 | Bullish | Moderate trend strength, favoring direction |
| Bollinger Bands | Middle Band Breakout | Bullish | Price above middle band suggests upward pressure |
Track markets in real-time
AI-powered analysis, technical indicators and real-time price data.
Join Our Telegram Channel
Breaking market news, AI analysis and trading signals instantly.
Join Channel