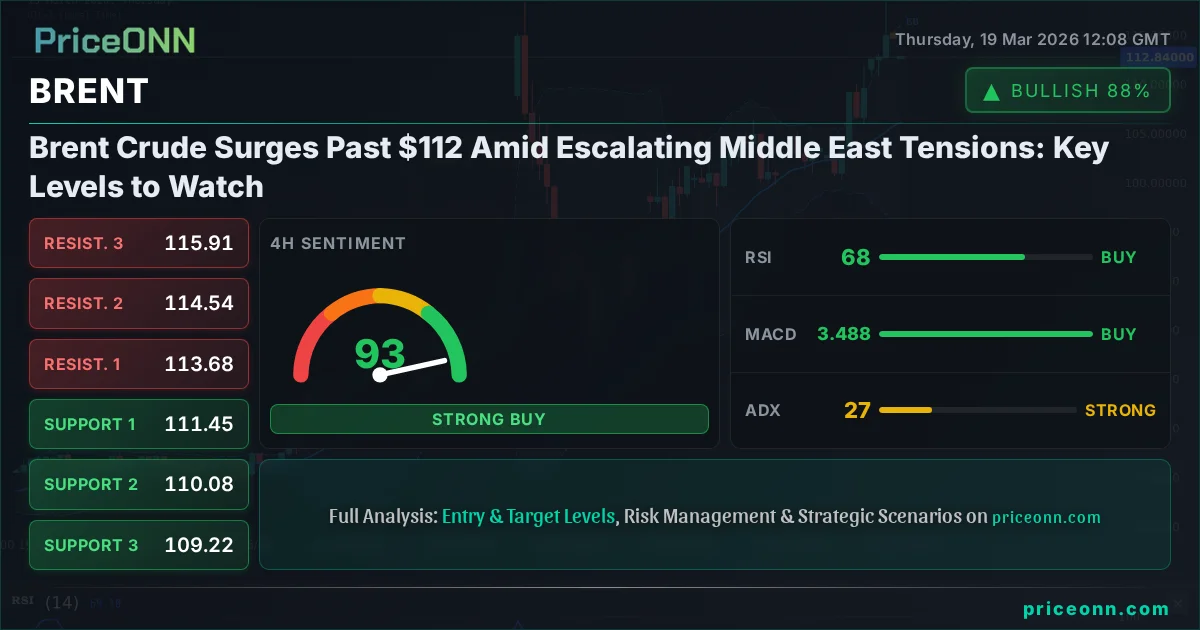
Brent Crude Surges Past $112 Amid Escalating Middle East Tensions: Key Levels to Watch
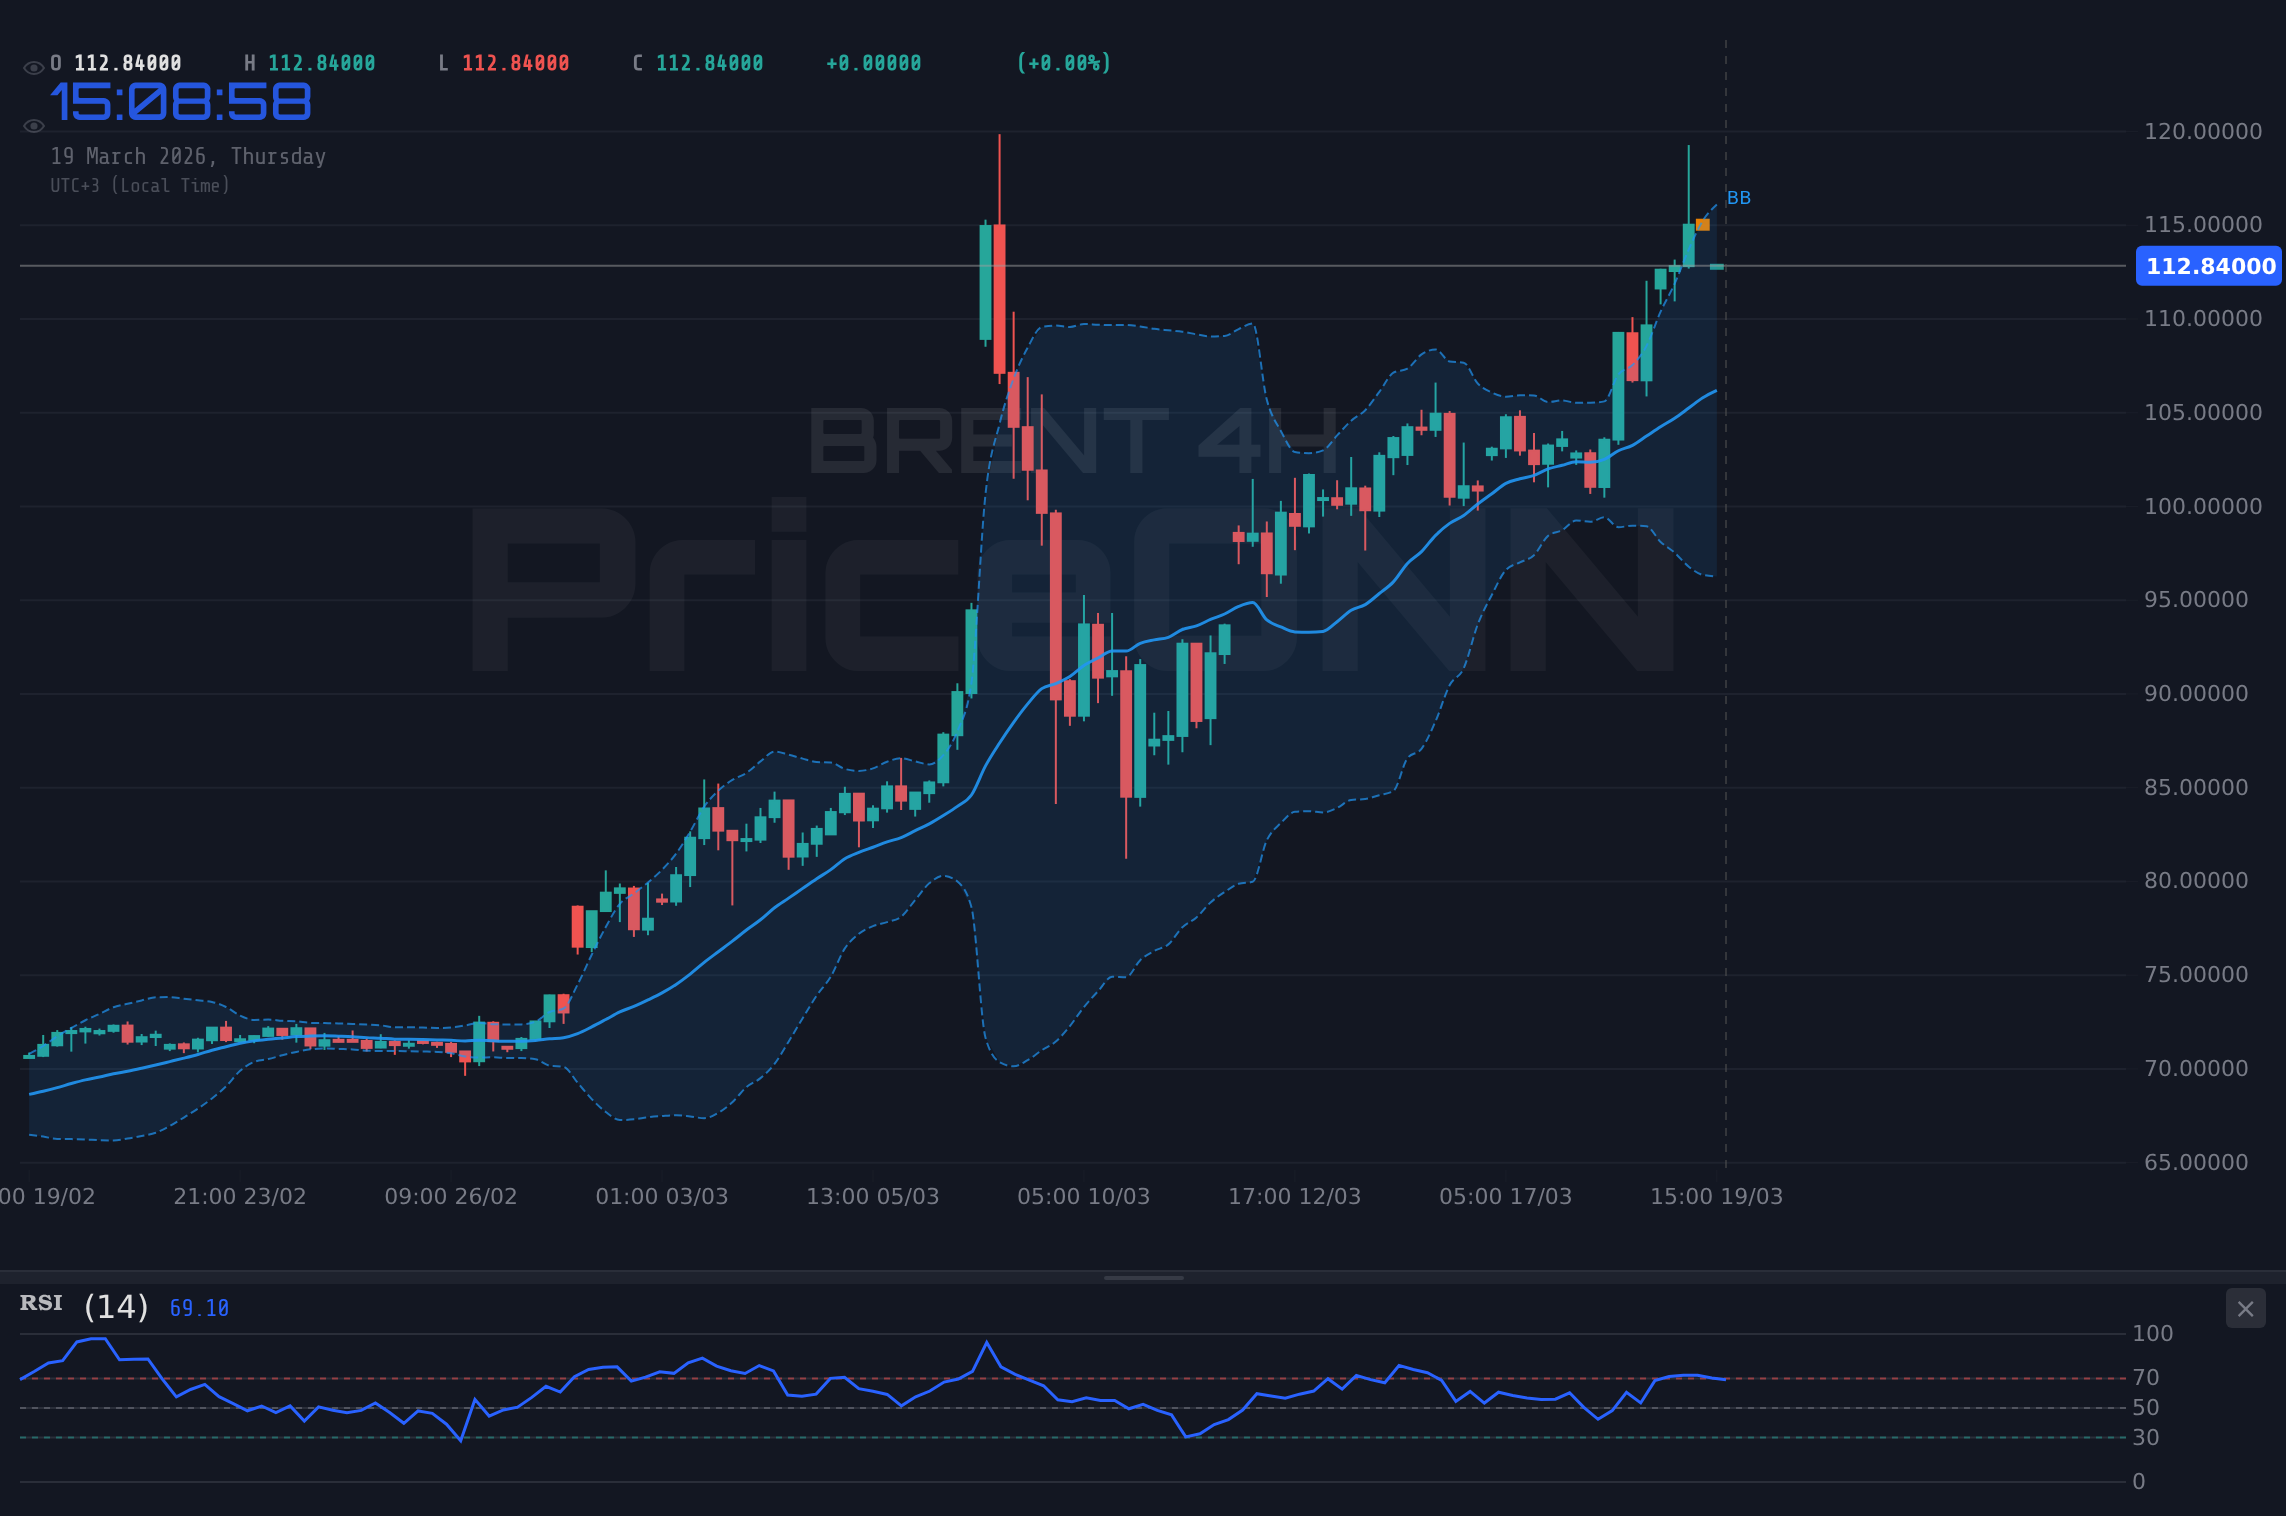
Brent crude oil is trading at $112.80, up 2.86% as geopolitical risks surge. Key levels to watch include resistance at $117.24 and support at $111.96.
The escalating conflict in the Middle East has sent shockwaves through the energy markets, with Brent crude oil prices surging past the critical $112 per barrel mark. This geopolitical flare-up, driven by heightened tensions between Iran and Israel, is injecting significant uncertainty and volatility into the global oil supply outlook. As traders scramble to price in the potential for supply disruptions, understanding the key technical levels and broader market correlations becomes paramount for navigating this turbulent environment. The current price action, coupled with strong directional signals on multiple timeframes, suggests that oil markets are entering a phase of heightened sensitivity to geopolitical developments.
- Brent crude is trading at $112.80, reflecting a significant 2.86% daily gain driven by geopolitical tensions.
- The 1-hour RSI at 59.49 suggests upward momentum, while the 1-day RSI at 85.91 indicates extreme overbought conditions, signaling potential for a pullback.
- Key resistance is eyed at $117.24, with crucial support found at $111.96 on the 1-hour chart.
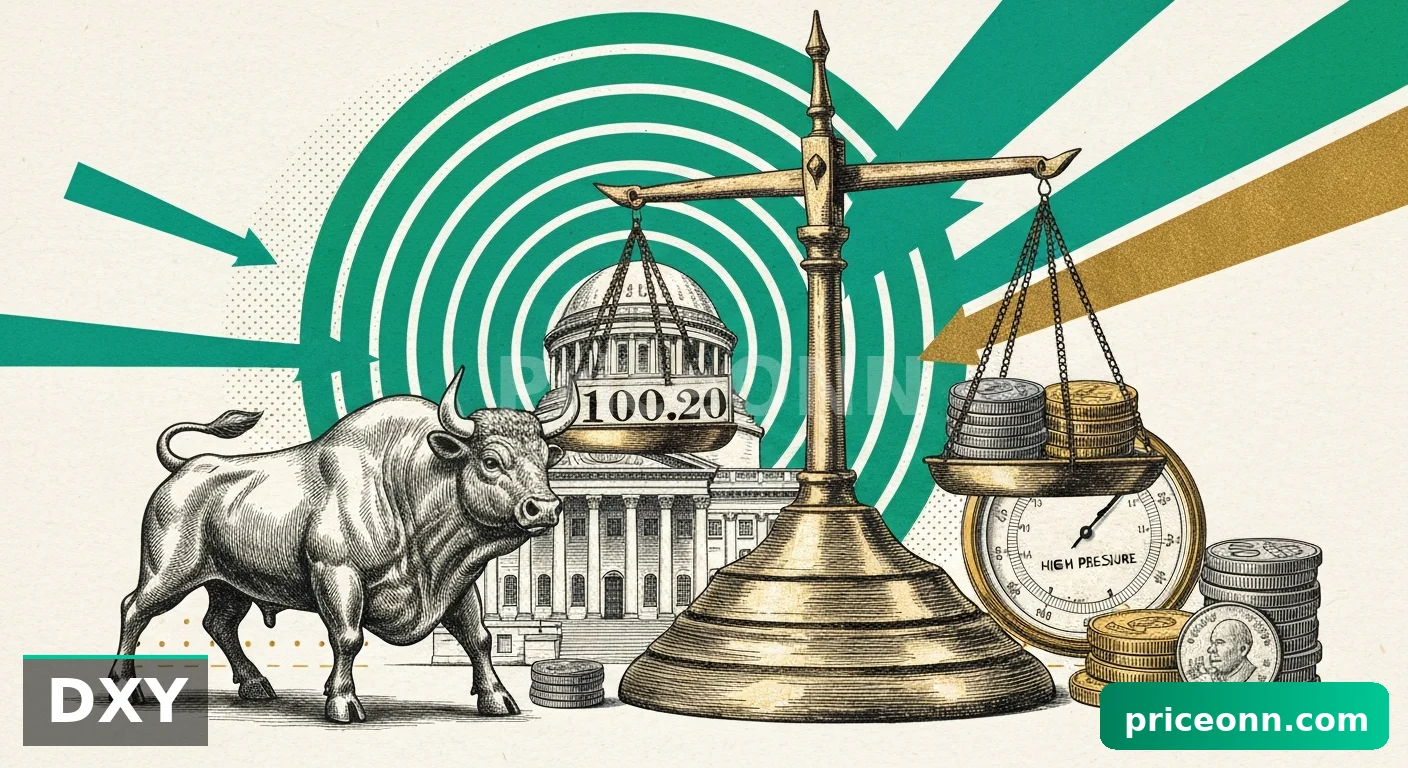
- The DXY at 99.84 shows a strong upward trend on the daily chart, which typically exerts downward pressure on commodities like oil, creating a complex intermarket dynamic.
The recent surge in Brent crude, now trading at $112.80 per barrel, is a stark reminder of how geopolitical events can rapidly reshape commodity landscapes. The conflict, involving strikes on gas fields and escalating tensions between Iran and Israel, has immediately impacted market sentiment, pushing oil prices higher as traders price in the risk of potential supply disruptions. This geopolitical premium is a significant factor, overriding some of the more typical demand-side considerations we might see in a different market environment. The daily change of +2.86% ($3.14) underscores the immediate market reaction to these unfolding events, demonstrating a clear risk-on sentiment specifically within the energy sector, even as broader risk appetite indicators may show mixed signals.
Navigating the Geopolitical Storm
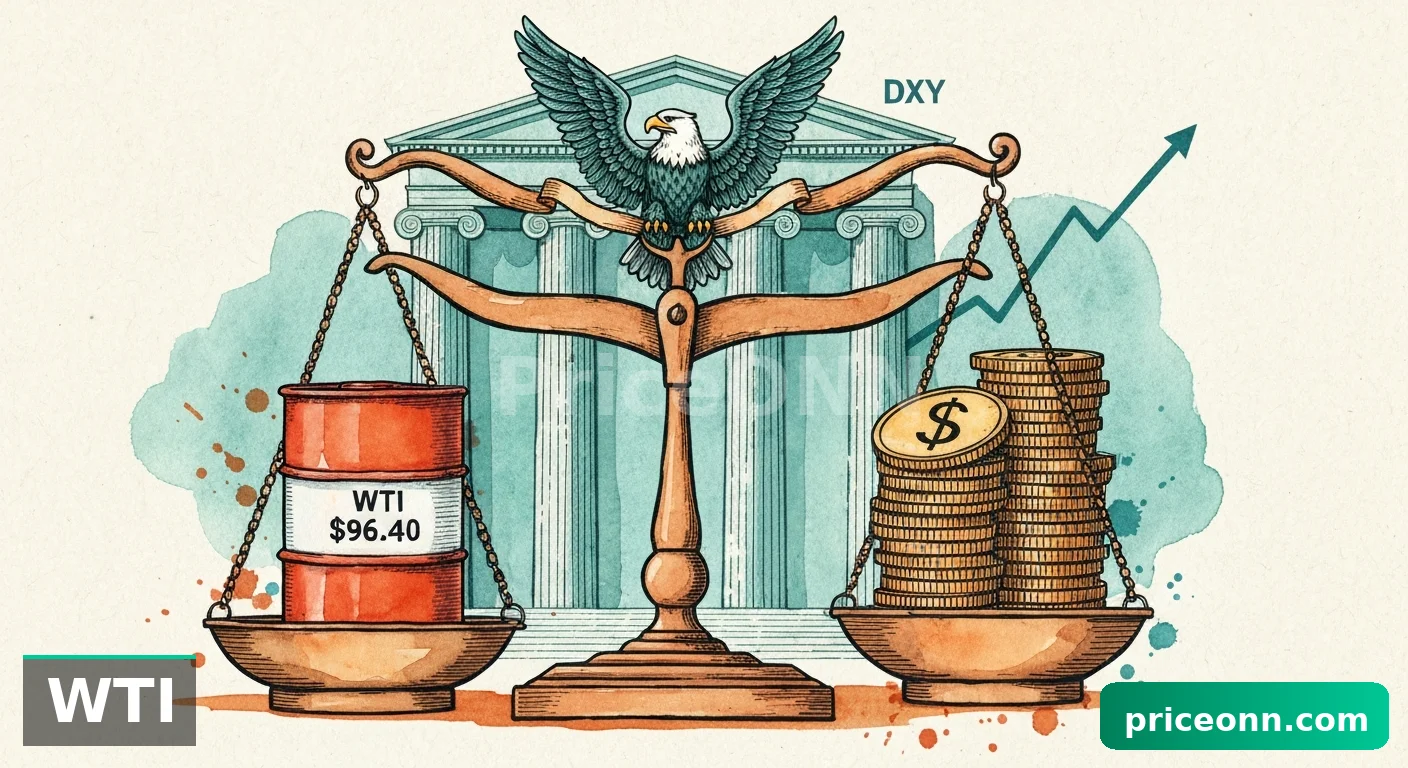
The narrative surrounding oil prices has been heavily influenced by the escalating conflict in the Middle East. Reports from sources like Reuters and Bloomberg highlight the severity of the situation, with Iran and Israel engaging in direct strikes. This is not merely a regional dispute; its implications ripple through global energy markets due to the strategic importance of the Strait of Hormuz and the surrounding production areas. The immediate effect is a classic supply risk premium being added to crude prices. Traders are not just looking at current inventories or demand forecasts; they are now factoring in the possibility of prolonged disruptions, which could significantly tighten the global oil balance. The fact that WTI crude, despite a daily retreat of 3% to $96.42, is also subject to these geopolitical forces, indicates a broad-based upward pressure on crude prices, even with some internal market divergences.
This geopolitical backdrop is crucial for understanding the current strength in Brent. While the daily gains are significant, the underlying trend indicators on the 1-hour and 4-hour charts show strong bullish momentum (100% power). This suggests that the market is actively pricing in the supply risk. The ADX values of 45.03 (1H) and 27.47 (4H) confirm that the trend is robust and gaining strength, making it difficult for counter-trend moves to gain significant traction in the short to medium term. However, the daily RSI at 85.91 is a flashing red light, indicating that the market is deeply overbought and ripe for a correction, regardless of the geopolitical narrative. This divergence between short-term bullish strength and long-term overbought conditions is where the real trading challenge lies.
Intermarket Dynamics: DXY and Equities
The correlation between oil prices and the US Dollar Index (DXY) is a key consideration. Currently, the DXY is trading at 99.84, showing a strong upward trend on the daily chart (98% power) and a robust ADX of 35.89. Historically, a strengthening dollar tends to put downward pressure on dollar-denominated commodities like Brent crude, as it makes them more expensive for holders of other currencies. However, in the current environment, the geopolitical risk premium appears to be overriding this usual inverse correlation. While the dollar is strong, Brent is also rising, suggesting that the 'risk-on' sentiment in energy markets due to conflict is more potent than the 'risk-off' sentiment typically associated with a strong dollar. This unusual correlation warrants close observation.
Similarly, the performance of major equity indices like the S&P 500 (trading at 6603.1, down 0.11%) and Nasdaq 100 (at 24311.01, down 0.28%) provides context on overall risk appetite. Both indices are showing slight weakness, which would normally suggest a move towards safe-haven assets. However, the surge in Brent complicates this picture. Investors might be rotating capital into oil as a hedge against inflation and geopolitical uncertainty, even as they reduce exposure to riskier equities. This suggests a bifurcated market sentiment, where specific commodity-driven risks are taking precedence over broader market risk aversion. The fact that the S&P 500 and Nasdaq are experiencing modest declines while Brent is rallying highlights a potential decoupling, driven by unique supply-side factors in the energy complex.
Technical Picture: Short-Term Strength vs. Long-Term Caution
Looking at the technical indicators, the 1-hour chart for Brent presents a bullish picture, albeit with some cautionary signals. The trend is strongly bullish (100% power), with ADX at 45.03 confirming a strong trend. The RSI(14) at 59.49 is in neutral territory, indicating room for upward movement, and the MACD is positive, with the histogram above the signal line. Stochastic K (37.54) and D (75.23) are showing a crossover that might suggest a pullback, but the overall short-term momentum is upwards. The immediate resistance is identified at $115.48, followed by $116.39 and $117.24. These levels will be crucial in determining if the upward momentum can be sustained.
However, the longer-term outlook, particularly on the daily chart, presents a more cautious view. The RSI(14) is at an extreme 85.91, deep within overbought territory. This level historically precedes significant price corrections. The ADX on the daily chart is 63.48, indicating a very strong trend, but such strong trends are often unsustainable at extreme RSI levels. The Stochastic K (71.07) and D (58.39) are showing a bullish crossover, but with K still below 71, it suggests that while the trend is strong, the immediate upward thrust might be losing steam, or a consolidation phase is imminent before any potential reversal. The daily support levels at $102.74, $95.82, and $91.17 represent significant downside potential if a correction materializes.
The Bollinger Bands also offer insights. On the 1-hour chart, price is above the middle band, supporting the bullish short-term view. On the 4-hour chart, price is also above the middle band, with an ADX of 27.47 indicating a solid uptrend. However, the daily chart shows price above the middle band, but the extremely high RSI suggests that a move back towards the middle band or even the lower band is a distinct possibility. The key takeaway is that while the short-term trend is bullish and driven by geopolitical events, the longer-term technicals are flashing warnings of an overextended market.
Supply Side Dynamics: OPEC+ and Beyond
While geopolitical tensions are the immediate catalyst, the underlying supply-demand balance remains critical for Brent's future trajectory. OPEC+ has been managing supply through production cuts, and their decisions continue to be a major influence. Recent reports suggest that the group is maintaining its strategy of gradual increases, but any deviation or unexpected announcement could significantly impact prices. Saudi Arabia's role in managing the market, often through voluntary cuts, is always under scrutiny. The current geopolitical situation might embolden producers to maintain tighter supply controls, especially if they perceive a genuine risk to global supply routes.
Furthermore, non-OPEC supply, particularly from the US shale sector, plays a vital role. While WTI crude experienced a dip today, its production levels have been robust. However, the focus remains on whether producers can significantly ramp up output to offset potential disruptions from the Middle East. The current price environment, especially if sustained above $100, could incentivize more production. But the immediate concern is not so much about future supply growth as it is about the security of existing supply flows. Inventory levels, both crude and refined products, will also be closely watched. Drawdowns in crude oil inventories, especially if larger than expected, would further support the bullish case, while builds would add pressure on prices, potentially accelerating any correction.
The Path Forward: Scenarios and Risk Management
Given the confluence of geopolitical drivers and technical signals, forecasting Brent's exact path is challenging. However, we can outline several scenarios. The bullish scenario hinges on the continued escalation of Middle East tensions, leading to sustained supply fears. In this case, prices could push towards the $117.24 resistance level and potentially higher. The trigger for this would be further concrete supply disruptions or broader regional conflict. Invalidation of this bullish thesis would occur if diplomatic efforts de-escalate tensions significantly or if a surprisingly large inventory build is reported, pushing prices back below the $111.96 support level.
Conversely, a bearish scenario could unfold if the geopolitical situation de-escalates rapidly, or if the market decides the current price action has overshot, especially given the extremely overbought daily RSI. A close below the $111.96 support on the 1-hour chart could signal the start of a correction, targeting the next support at $110.78 (based on the daily range) or even lower towards the $102.74 daily support. The invalidation for this bearish view would be a decisive break and hold above the $115.48 resistance.
A neutral or consolidation scenario is also possible, particularly if the immediate geopolitical news flow subsides, or if the market digests the current price levels. In this case, Brent might trade within a range, likely between the $111.96 support and the $115.48 resistance. This would allow technical indicators, especially the daily RSI, to cool off from their extreme levels, setting the stage for a more sustainable move in either direction later on. Patience and risk management are key here, as the market navigates these competing forces.
Bearish Scenario: Correction Beckons
60% ProbabilityConsolidation Scenario: Range-Bound Action
25% ProbabilityBullish Scenario: Geopolitics Drive Higher
15% ProbabilityFrequently Asked Questions: Brent Analysis
What happens if Brent crude breaks below $111.96 support amid de-escalation?
A break below the $111.96 support level could trigger a bearish correction, especially if geopolitical tensions ease rapidly. This would likely target the $110.78 level, potentially extending towards the $102.74 daily support as the market unwinds the geopolitical risk premium.
Should I buy Brent at current levels of $112.80 given the strong daily RSI at 85.91?
Buying at current levels is risky due to the extremely overbought daily RSI of 85.91. While short-term momentum is bullish, the probability of a pullback is high. A more prudent approach might involve waiting for a pullback towards support levels like $111.96 or confirmation of a trend continuation above $115.48, with a 60% probability favoring a correction.
Is the ADX at 45.03 on the 1-hour chart a definitive buy signal for Brent?
An ADX of 45.03 indicates a strong trend, which is currently bullish on the 1-hour chart. However, it doesn't confirm a buy signal on its own. It signifies strong trend momentum. Combined with other bullish indicators and a geopolitical catalyst, it supports upward movement, but the high daily RSI tempers outright buying enthusiasm.
How will the DXY's strength at 99.84 affect Brent crude prices this week?
The DXY at 99.84 is showing a strong upward trend, which typically pressures dollar-denominated commodities like Brent. However, the current geopolitical risk premium in oil is overriding this inverse correlation. Expect Brent to potentially move higher despite dollar strength, though a significant dollar rally could eventually cap oil gains.
The current surge in Brent crude oil, driven by escalating geopolitical tensions, presents a complex trading landscape. While short-term technicals suggest further upside potential, the extremely overbought conditions on the daily chart serve as a significant warning. Market participants must remain vigilant, closely monitoring geopolitical developments, DXY movements, and key support and resistance levels. Patience and disciplined risk management will be crucial in navigating this volatile environment. Volatility creates opportunity - those prepared will be rewarded.
Track markets in real-time
AI-powered analysis, technical indicators and real-time price data.
Join Our Telegram Channel
Breaking market news, AI analysis and trading signals instantly.
Join Channel