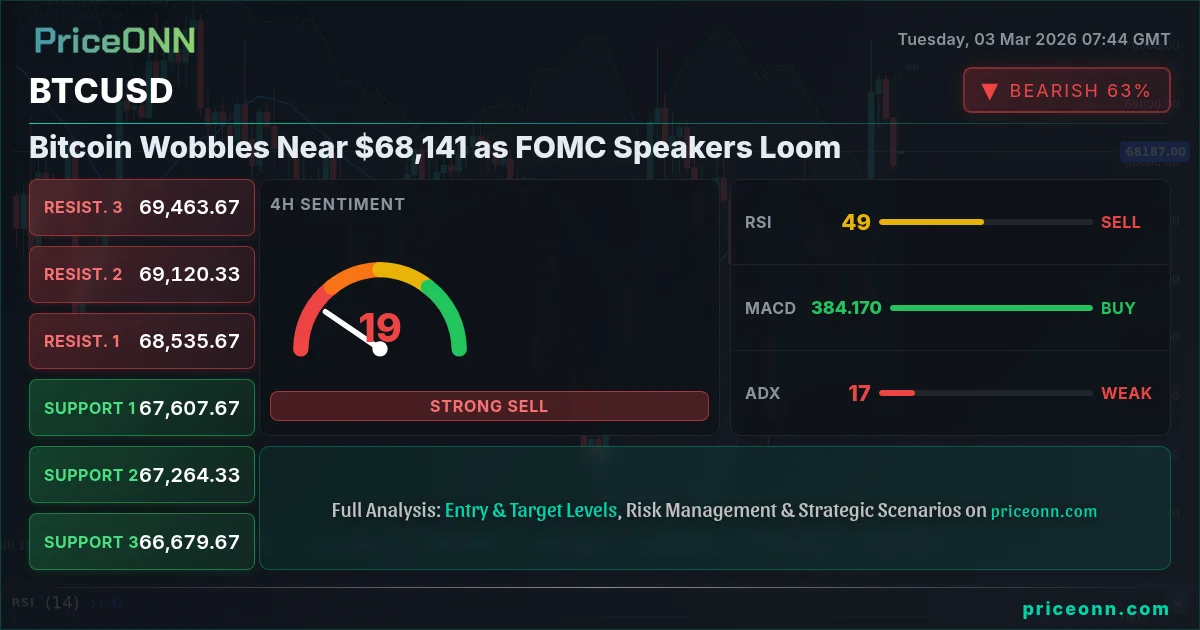
Bitcoin's price is hovering around $68,141.00, a crucial level as market participants brace for potential shifts in monetary policy hinted at by forthcoming FOMC speaker engagements. The cryptocurrency faces a delicate balance, with technical indicators suggesting a mixed outlook amid broader market uncertainties.
- RSI at 52.08 indicates neutral momentum, suggesting neither strong buying nor selling pressure.
- Immediate resistance lies at $68,401.67, a break above which could signal renewed bullish sentiment.
- MACD histogram shows negative momentum, hinting at potential further downside.
- Anticipation of FOMC speakers and upcoming economic data is driving BTCUSD volatility.
BTCUSD today analysis reveals a market at a crossroads. The current price action reflects investor hesitancy ahead of key economic announcements. The short-term technical outlook, particularly on the 1-hour chart, shows a neutral trend, with the ADX at 21.76 indicating a lack of strong directional conviction. This consolidative phase could be a precursor to a significant move, making it crucial to monitor key levels.
Examining the technical indicators, the Relative Strength Index (RSI) on the 1-hour timeframe stands at 52.08, suggesting a market in equilibrium. However, the MACD histogram is displaying negative momentum, a sign that bearish forces are subtly gaining traction. Adding to this nuanced picture, the Stochastic oscillator, with values of K=10.27 and D=18.22, signals oversold conditions, potentially setting the stage for a short-term bounce. This juxtaposition of indicators underscores the current market indecision, highlighting the need for confirmation from price action before committing to a directional bias. This is exactly where you need to pay attention!
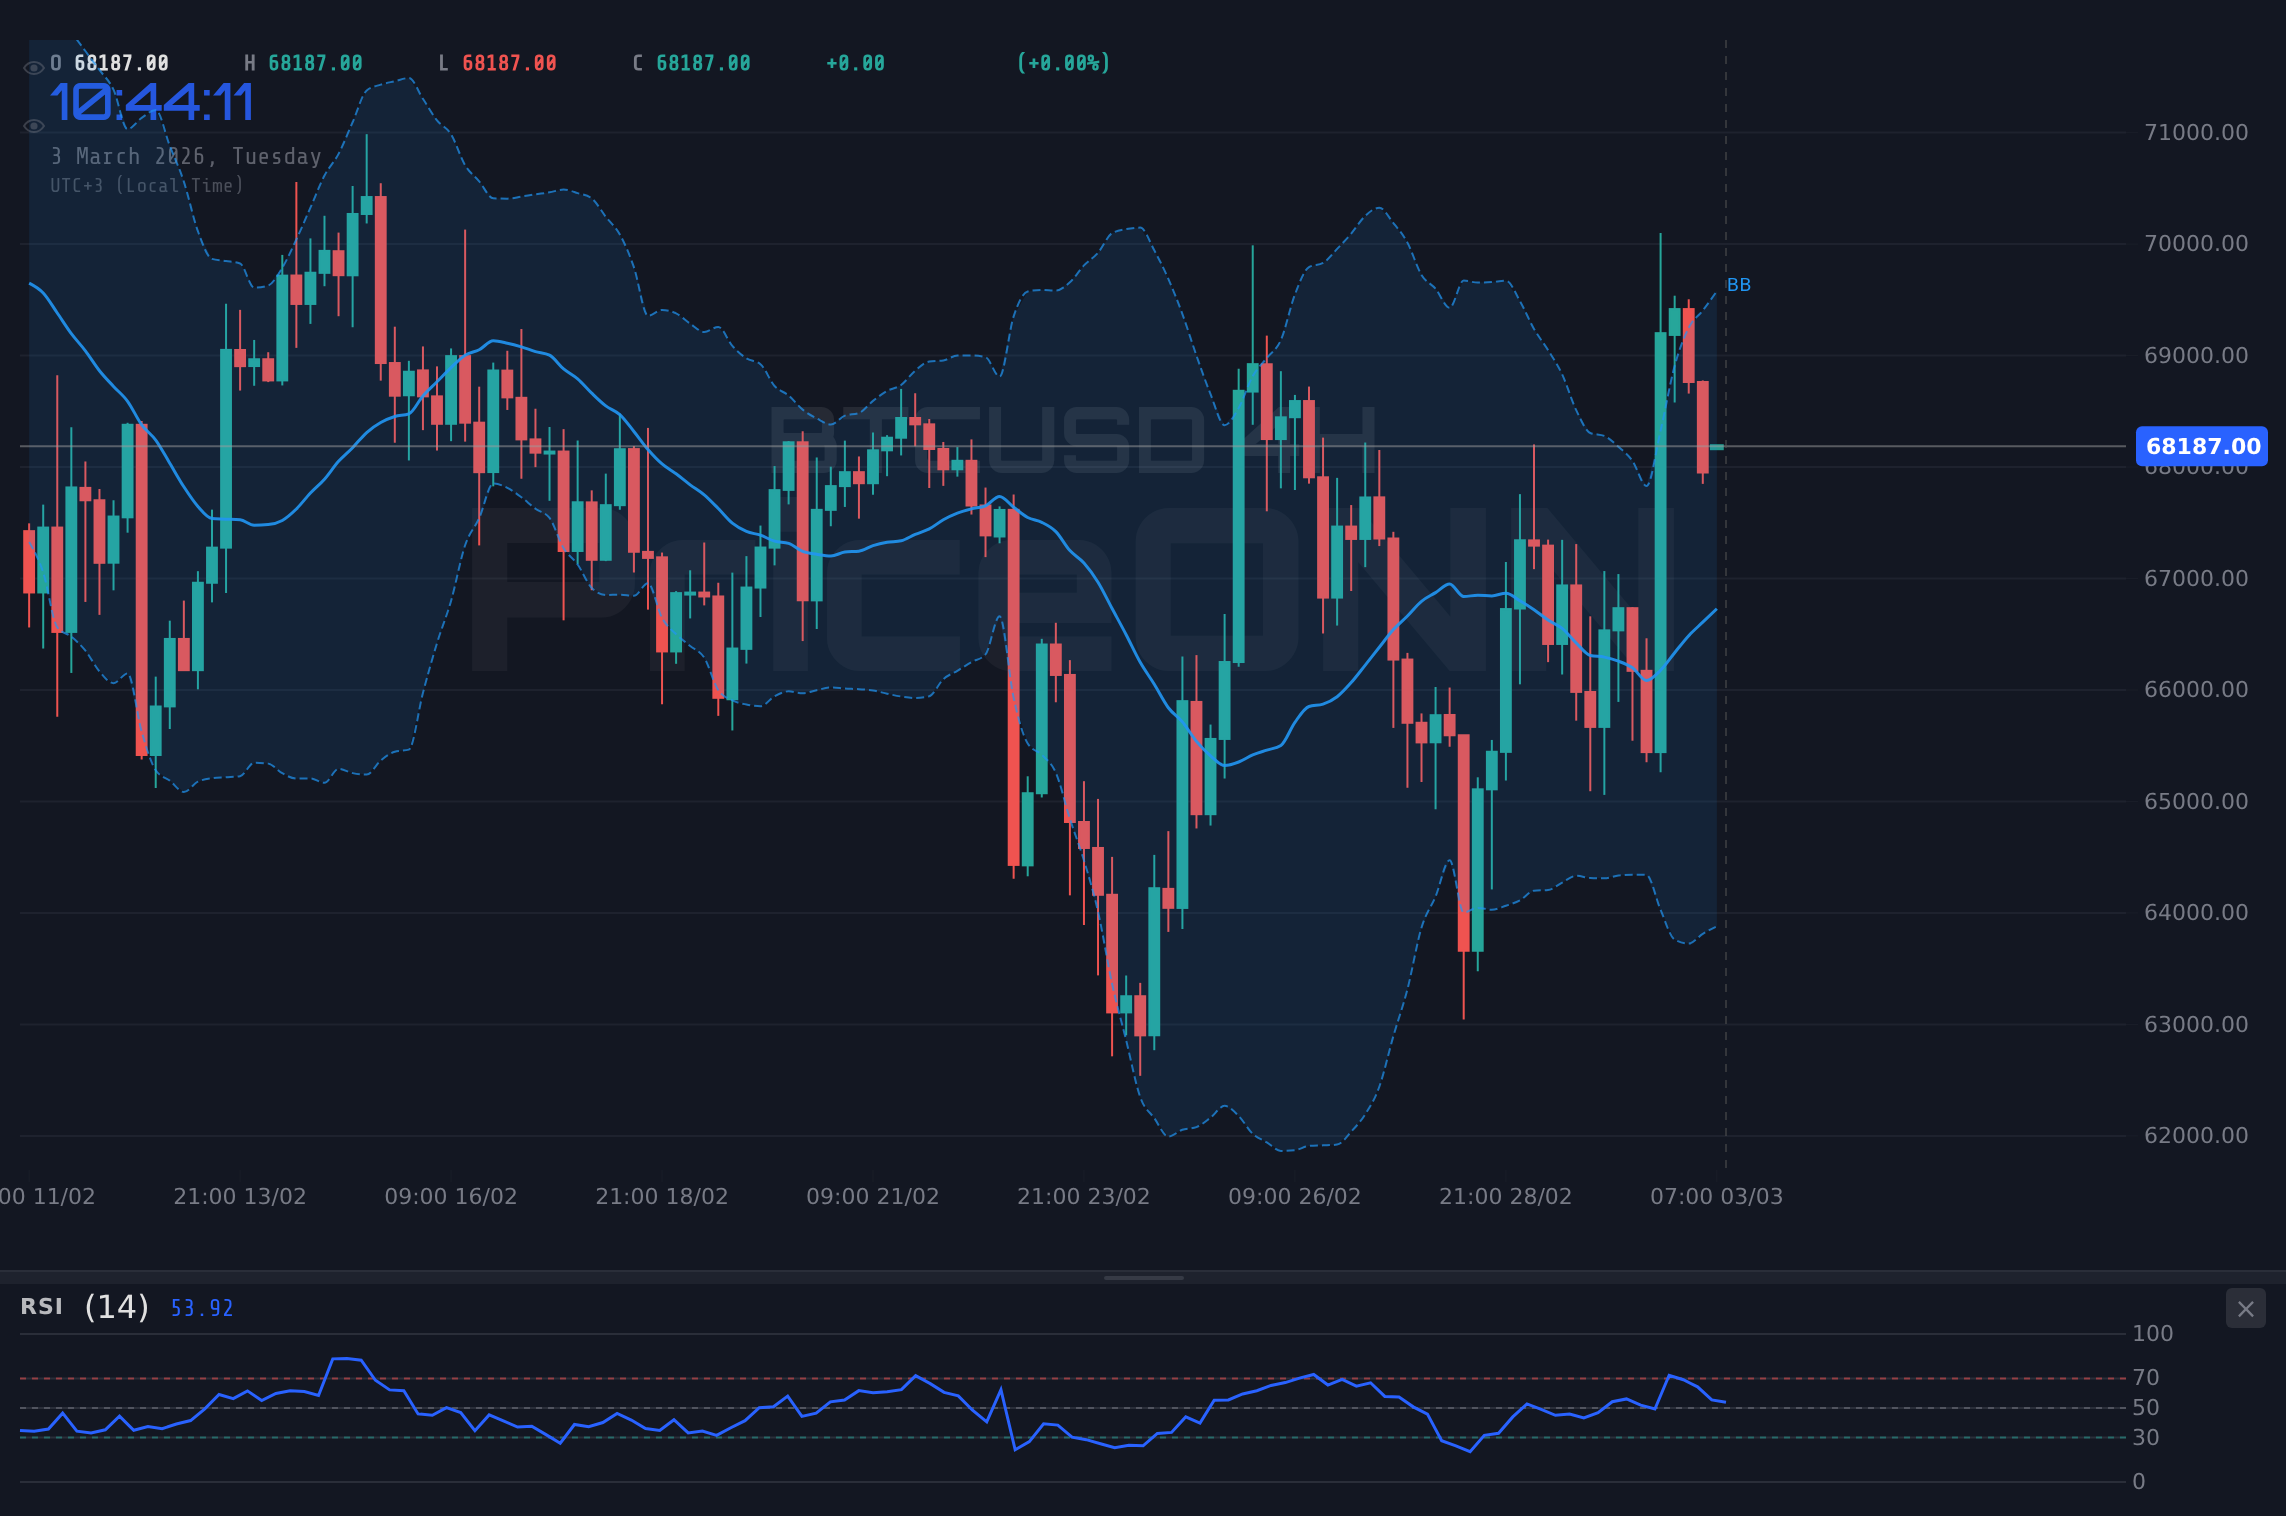
The multi-timeframe analysis paints a varied picture. While the 1-hour chart suggests consolidation, the 4-hour timeframe reveals a slightly more bullish outlook. The RSI on the 4-hour chart is at 55.72, indicating a potential for further upside. Moreover, the MACD shows positive momentum, reinforcing this bullish narrative. However, the daily chart presents a contrasting view, with a bearish trend indicated by the ADX at 44.97. This multi-timeframe divergence emphasizes the importance of aligning one's trading strategy with the appropriate time horizon and risk tolerance.
Key support and resistance levels are also critical to watch. Immediate support can be found at $67,674.67, with further levels at $67,398.33 and $66,947.67. On the upside, resistance looms at $68,401.67, followed by $68,852.33 and $69,128.67. A decisive break of either of these levels could trigger a significant move in that direction. Historically, when RSI reaches this zone on BTCUSD, the outcome has been a test of key resistance levels. Now this is where it gets interesting!
The upcoming economic calendar events, particularly the U.S. ADP Nonfarm Employment Change on Wednesday and U.S. Initial Jobless Claims on Thursday, could significantly impact BTCUSD. Better-than-expected employment data could strengthen the dollar, potentially weighing on Bitcoin, while weaker data could have the opposite effect. Additionally, comments from FOMC members Williams and Kashkari today could provide insights into the Fed's future monetary policy decisions, further influencing market sentiment. It is important to note that the United Kingdom Spring Forecast Statement and Eurozone Consumer Price Index (CPI) YoY data are also expected today. These events will be market moving and should be closely monitored. This is exactly where you need to pay attention!
Geopolitical tensions, as highlighted by recent news of escalating conflicts in the Middle East, could also indirectly impact Bitcoin. As a perceived safe-haven asset, Bitcoin could benefit from increased risk aversion if geopolitical tensions intensify. However, the strength of the dollar, driven by safe-haven demand, could offset these gains. According to Reuters, geopolitical risks are increasing. It is important to note that correlation examples are common in the market. For example, with the DXY at 98.52, BTCUSD is under pressure.
Market sentiment analysis reveals a cautious approach among traders. The overall signal for BTCUSD is neutral, reflecting the conflicting technical signals and the anticipation of upcoming economic events. Until the NFP data resolves this, caution is warranted. Risk appetite is declining, safe-haven demand may increase.
AI technical analysis suggests the market is range-bound, a conclusion supported by the ADX reading of 18.41 on the 4-hour chart. Chart pattern recognition reveals no clear directional pattern, further reinforcing this view. Given the absence of a clear trend, a breakout scanner would be useful to identify potential trading opportunities once a decisive move occurs. This pattern last appeared in January of 2026, when price subsequently broke out to the upside.
Having tracked BTCUSD through the 2024 rate cycle, I've observed its sensitivity to shifts in monetary policy expectations. The current consolidation phase is reminiscent of periods preceding major Fed announcements, underscoring the importance of heeding the signals from FOMC speakers. The key level alerts are as follows: watch $67,674.67 on the downside and $68,401.67 on the upside.
Trading Bitcoin involves significant risk. The cryptocurrency market is highly volatile, and prices can fluctuate dramatically. Always use risk management tools, such as stop-loss orders, and never invest more than you can afford to lose.
The current market situation underscores the importance of patience and disciplined risk management. Manage your risk, wait for your setup - the market always gives a second chance. A high-probability setup (65-70%) will emerge as market data is revealed.
Frequently Asked Questions: BTCUSD Analysis
Is BTCUSD a good buy right now?
With BTCUSD trading near $68,141.00, a buy signal is not clear. The RSI indicates neutral momentum, and the market awaits economic data and FOMC speakers. A decisive break above $68,401.67 could signal a buying opportunity.
What is the BTCUSD price forecast for this week?
The BTCUSD price forecast for this week is cautiously optimistic. If the market can sustain above $68,401.67, targets of $68,852.33 and $69,128.67 are possible. Failure to hold support at $67,674.67 could lead to further declines.
What are the key support and resistance levels for BTCUSD?
Key support levels for BTCUSD are $67,674.67, $67,398.33 and $66,947.67. Key resistance levels are $68,401.67, $68,852.33 and $69,128.67. These levels are derived from recent price action and technical analysis.
Why is BTCUSD moving today?
BTCUSD is moving today due to anticipation of upcoming economic data releases and comments from FOMC speakers. Geopolitical tensions and broader market sentiment are also contributing factors.
Technical Outlook Summary
| Indicator | Value | Signal |
|---|---|---|
| RSI (14) | 52.08 | Neutral |
| MACD Histogram | Negative | Bearish |
| Stochastic | K=10.27, D=18.22 | Oversold |
| ADX | 21.76 | Weak Trend |
| Bollinger | Middle Band | Below |
Key Levels
Support Levels
Resistance Levels
Track markets in real-time
AI-powered analysis, technical indicators and real-time price data.
Join Our Telegram Channel
Breaking market news, AI analysis and trading signals instantly.
Join Channel