BRENT at $65.73: Will Crude Oil's Rally Sustain?
BRENT crude surges to $65.73 amid tight supply. Is this a breakout or a bull trap?
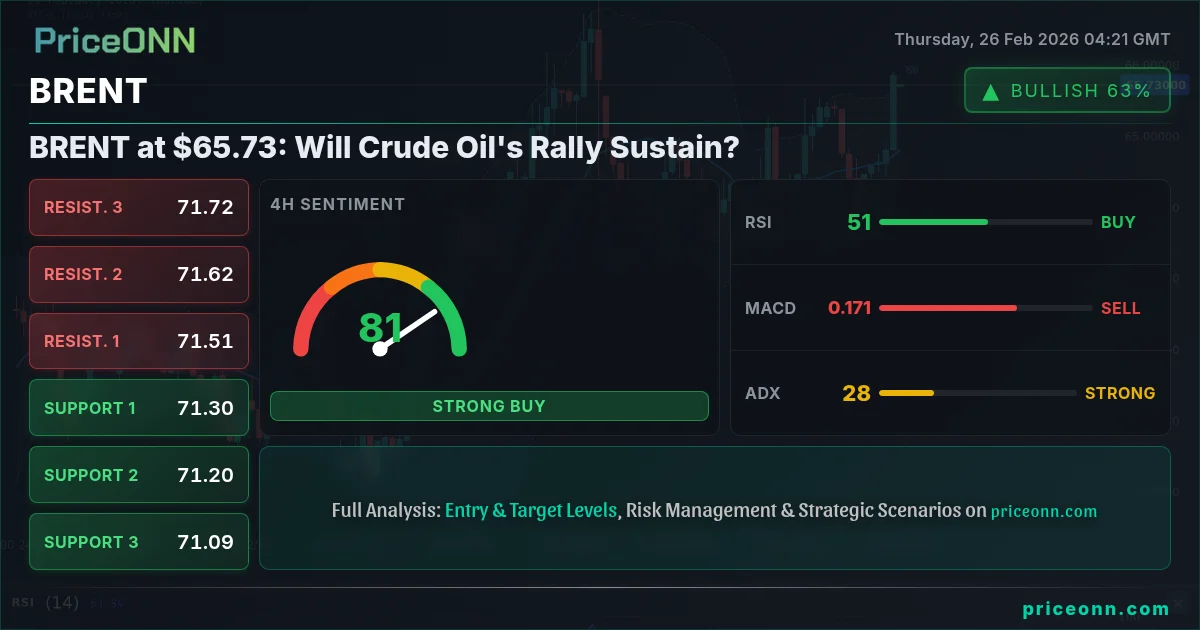
BRENT crude oil is currently trading at $65.73, marking a 1.96% daily gain. The question now is whether this rally has legs, or if it's a temporary surge before a potential pullback. The energy market is sensitive to geopolitical tensions and economic data, and BRENT's price action reflects this volatility.
- RSI at 71.16 suggests overbought conditions on the 1H chart.
- Immediate resistance looms at $65.42, a key level to watch for a breakout.
- Stochastic on the 1H chart is in overbought territory (%K: 90.49, %D: 81.87), signaling potential for a short-term correction.
- Geopolitical factors and potential supply disruptions are underpinning BRENT's correlation with risk assets.
Let's delve into the technical factors influencing BRENT's price action. On the hourly chart, the Relative Strength Index (RSI) reads 71.16, indicating that the market may be overbought and vulnerable to a near-term correction. However, the Moving Average Convergence Divergence (MACD) on the same timeframe shows positive momentum, with the MACD line above the signal line. This suggests that while the price may be stretched, the underlying trend remains bullish. The Stochastic oscillator, with %K at 90.49 and %D at 81.87, confirms overbought conditions, further reinforcing the possibility of a pullback. The Average Directional Index (ADX) stands at a relatively weak 19.03, suggesting the current trend is not particularly strong, and therefore may be susceptible to reversals.
Key Price Levels to Watch
Looking at the key support and resistance levels, immediate resistance lies at $65.42, followed by $66.36 and $67.23. These levels represent potential areas where the price may encounter selling pressure. On the downside, immediate support can be found at $63.61, with further support at $62.74 and $61.80. These levels could act as potential buying opportunities if the price pulls back.
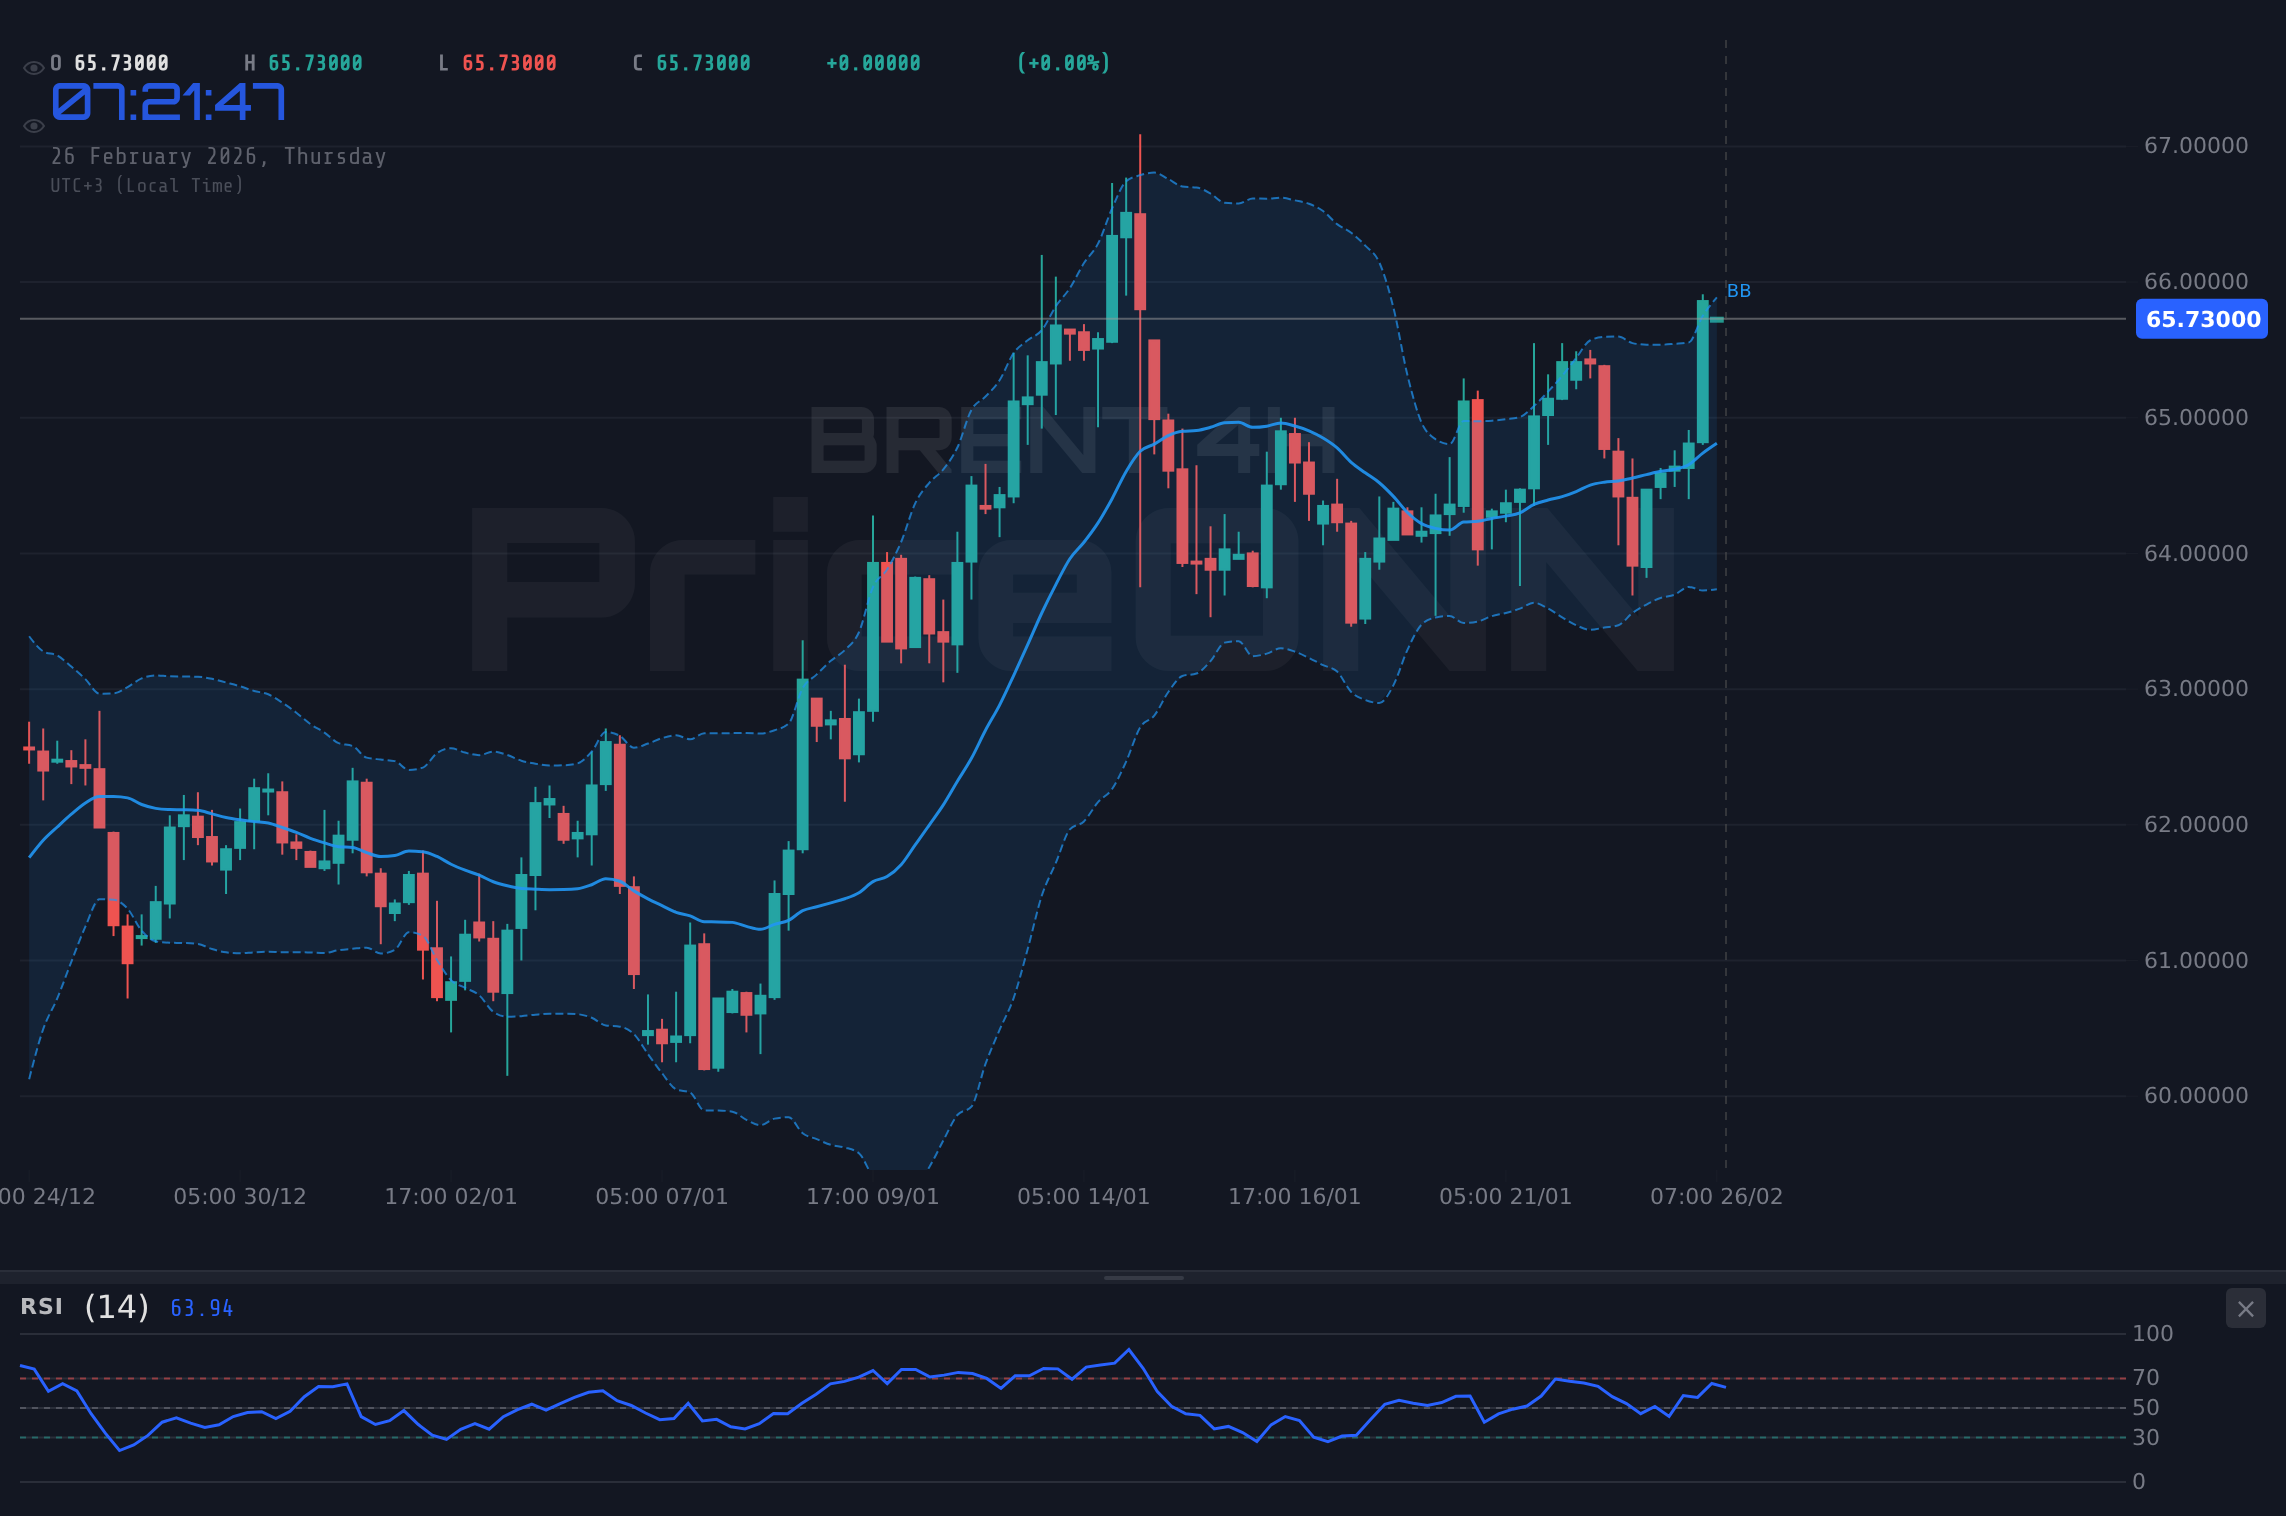
On the 4-hour timeframe, the RSI is at 62.33, which is a more neutral reading compared to the hourly chart. The MACD also shows positive momentum, which aligns with the bullish trend. The Stochastic oscillator shows %K at 68.29 and %D at 44.75, indicating a potential bullish signal. The ADX is at 13.59, suggesting a weak trend on this timeframe as well. This suggests that the market is consolidating before potentially making another move higher.
Macroeconomic and Geopolitical Drivers
BRENT's price is heavily influenced by macroeconomic factors and geopolitical events. The recent rise in BRENT can be attributed to a combination of factors, including supply disruptions and increasing demand. Concerns over geopolitical tensions in the Middle East and Eastern Europe continue to provide a floor for prices, while stronger-than-expected economic data has boosted demand expectations. The DXY (Dollar Index) is currently at 97.32, a slight decrease, which may be providing some support for BRENT as a weaker dollar typically makes commodities more attractive to international buyers.
According to Reuters, OPEC+ is expected to maintain its current production cuts at its upcoming meeting, which could further tighten supply and support prices. Any surprise decision to increase production could put downward pressure on BRENT. Investors should also closely monitor economic data releases, particularly inflation figures and GDP growth, as these can significantly impact demand expectations.
Multi-Timeframe Analysis: Aligning the Signals
A multi-timeframe analysis of BRENT reveals a mixed picture. While the hourly chart suggests overbought conditions and the potential for a pullback, the daily chart points to a more sustained bullish trend. The daily RSI is at 59.99, indicating that there is still room for the price to move higher before reaching overbought territory. The daily MACD also shows positive momentum, and the Stochastic oscillator shows %K at 54.52 and %D at 58.52, indicating a potential bearish signal. The ADX on the daily chart is at 28.64, suggesting a relatively strong trend.
The conflicting signals across different timeframes highlight the importance of patience and careful risk management. Scalpers may look to take advantage of short-term pullbacks, while swing traders may focus on the longer-term bullish trend. Long-term investors should consider averaging into positions over time to mitigate the risk of potential corrections.
Correlation Analysis: Watching the DXY and Equities
BRENT's price is also influenced by its correlation with other asset classes. The DXY (Dollar Index), currently at 97.32, often has an inverse relationship with BRENT. A stronger dollar typically puts downward pressure on BRENT, while a weaker dollar provides support. The SP500, trading at 6936.05, can also influence BRENT's price. A risk-on environment, characterized by rising equity markets, often leads to increased demand for commodities like oil. Conversely, a risk-off environment, with falling equity markets, can lead to decreased demand and lower prices.
The current market sentiment is mixed, with the SP500 showing a slight downturn (-0.37% daily change). This suggests that risk appetite is waning, which could put some downward pressure on BRENT. However, the overall trend in equity markets remains bullish, which should provide some support for oil prices. The Dow Jones Industrial Average (DJIA), currently at 49401.5, is also down slightly (-0.08% daily change), further indicating a cautious market environment.
Economic Calendar: Key Data Releases Ahead
Traders should closely monitor upcoming economic data releases, as these can significantly impact BRENT's price. The US is expected to release data, which could provide insights into the health of the US economy and potential demand for oil. Any positive surprises in these data releases could boost oil prices, while negative surprises could put downward pressure on the market. The EUR is also releasing data, which will provide insights into the Eurozone economy.
The View from Frankfurt
From a European perspective, the BRENT price is a critical factor influencing economic stability. As a major importer of oil, Europe is highly sensitive to fluctuations in energy prices. Higher oil prices can lead to increased inflation and lower economic growth. The ECB (European Central Bank) is closely monitoring energy prices as it considers its monetary policy decisions. Any sustained rise in oil prices could prompt the ECB to take a more hawkish stance, potentially raising interest rates to combat inflation.
Key Considerations for Different Trader Types
Different trader types will have different approaches to the BRENT market. Scalpers may look to take advantage of short-term price fluctuations, while swing traders may focus on the longer-term trend. Long-term investors should consider averaging into positions over time to mitigate the risk of potential corrections.
Scalpers should pay close attention to the hourly chart and key support and resistance levels. Swing traders should focus on the daily chart and monitor macroeconomic and geopolitical events. Long-term investors should consider the overall supply and demand dynamics of the oil market and the potential for future growth.
The Current Technical Picture
The current technical picture for BRENT is mixed, with conflicting signals across different timeframes. The hourly chart suggests overbought conditions and the potential for a pullback, while the daily chart points to a more sustained bullish trend. The market is currently consolidating before potentially making another move higher. Traders should remain patient and wait for confirmation before taking any positions.
Frequently Asked Questions: BRENT Analysis
Is BRENT a good buy right now?
BRENT is currently trading at $65.73. With the RSI signaling overbought conditions on the hourly chart, a short-term pullback is possible. A buy position could be considered if the price retraces to the $63.61 support level and shows signs of rebounding.
What is the BRENT price forecast for this week?
The BRENT price forecast for this week is cautiously bullish. If the price can break above the $65.42 resistance level, it could target the $66.36 and $67.23 levels. However, a failure to break above $65.42 could lead to a pullback to the $63.61 support level.
What are the key support and resistance levels for BRENT?
Key support levels for BRENT are $63.61, $62.74, and $61.80. Key resistance levels are $65.42, $66.36, and $67.23. These levels are based on the hourly and daily charts and represent potential areas of buying and selling pressure.
Why is BRENT moving today?
BRENT is moving higher today due to a combination of factors, including supply disruptions and increasing demand. Geopolitical tensions in the Middle East and Eastern Europe are also providing a floor for prices. A weaker dollar is making commodities more attractive to international buyers.
Technical Outlook Summary
| Indicator | Value | Signal |
|---|---|---|
| RSI (14) | 71.16 | Bearish |
| MACD Histogram | Positive | Bullish |
| Stochastic | 90.49/81.87 | Bearish |
| ADX | 19.03 | Weak |
| Bollinger | Upper Band | Watch |
Key Levels
Support Levels
Resistance Levels
Track markets in real-time
AI-powered analysis, technical indicators and real-time price data.
Join Our Telegram Channel
Breaking market news, AI analysis and trading signals instantly.
Join Channel