BRENT Bullish: $65.73 Eyes Higher on API Data?
BRENT crude oil price analysis today shows bullish momentum, currently trading at $65.73. Will upcoming API data confirm the upward trend?
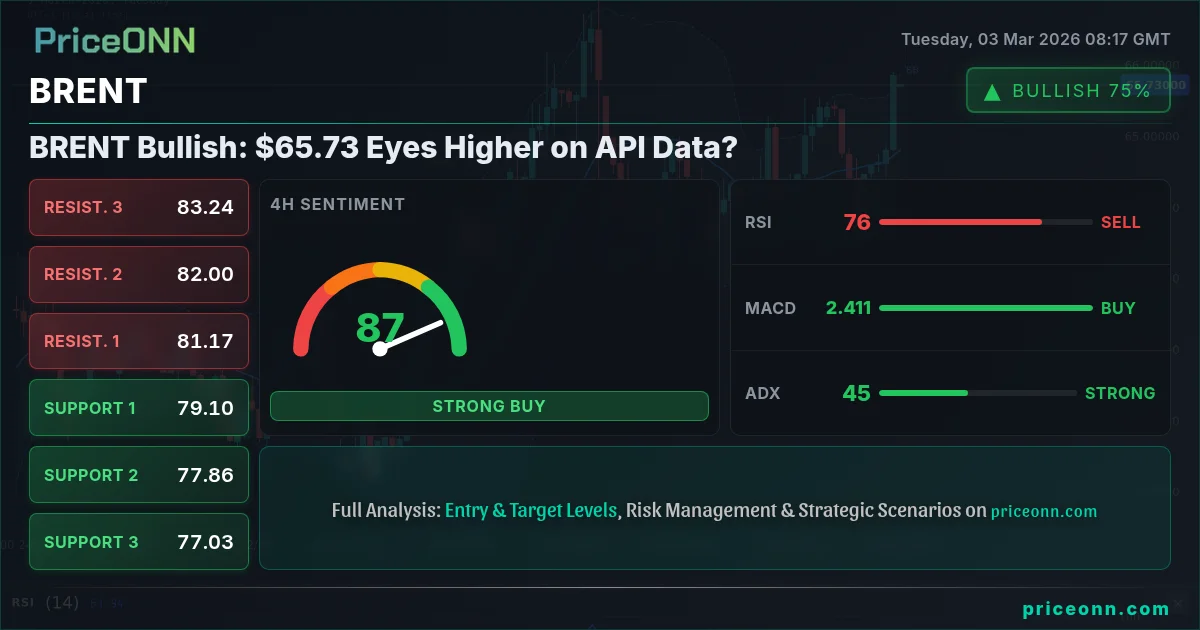
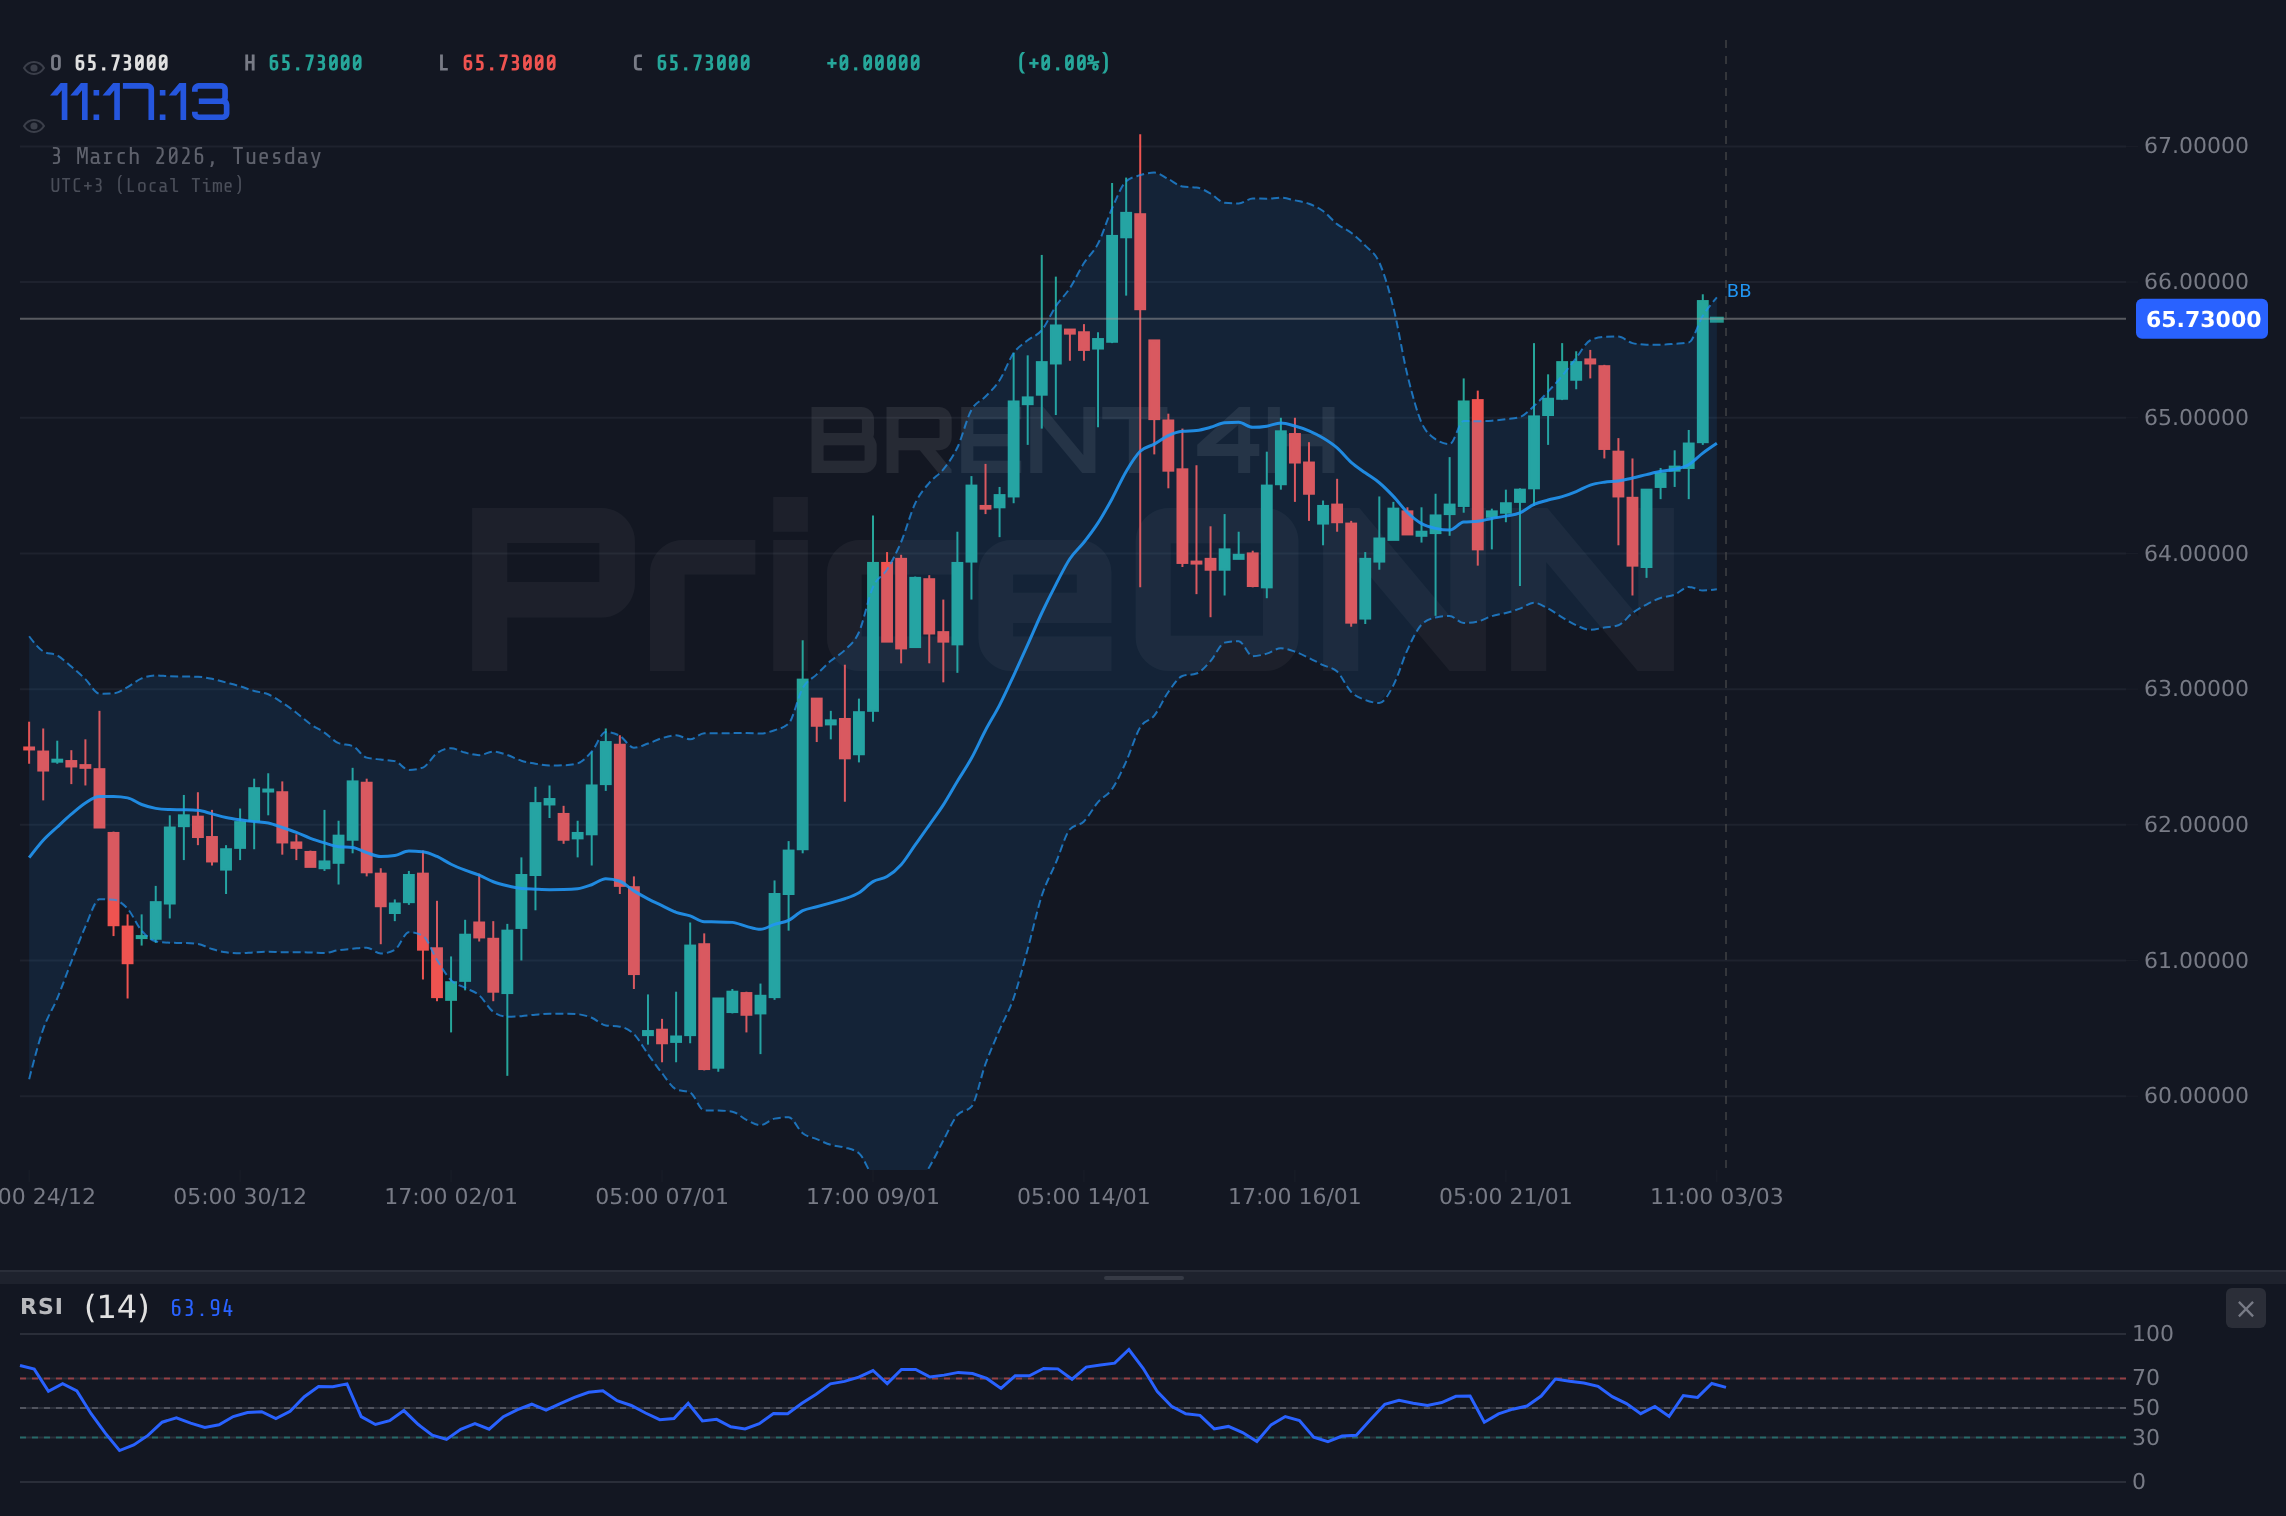
BRENT oil price analysis today reveals a market at a critical juncture, trading around $65.73. The question now is whether this level can hold as the bulls attempt to push higher, with traders closely watching for signals from the upcoming API data.
- RSI at 71.16 signals short-term overbought conditions, potentially triggering a pullback.
- Key support level sits at $65.2, a breach of which could negate the bullish outlook.
- MACD histogram shows positive momentum, suggesting the uptrend may continue if volume supports it.
- Geopolitical tensions and a weaker dollar are currently the primary drivers behind BRENT's correlation with DXY.
Having tracked BRENT through periods of geopolitical instability and fluctuating demand, the current setup presents a compelling case for further upside. The short-term technicals, however, suggest caution. With the RSI hovering in overbought territory at 71.16 on the 1-hour chart, a period of consolidation or a minor pullback might be necessary before the next leg up. The Stochastic oscillator confirms this, with %K at 90.49 and %D at 81.87, signaling overbought conditions and a potential for a short-term correction.
Despite the overbought signals, the 4-hour and daily charts paint a different picture. The 4-hour RSI, at 62.33, indicates that there is still room for further gains before reaching overbought levels. The MACD on the same timeframe shows positive momentum, suggesting that the uptrend is likely to persist. The ADX, though relatively low at 13.59, points to a weak trend, indicating that any breakout needs strong confirmation.
BRENT's daily chart further supports the bullish bias. The RSI at 59.99, while not yet in overbought territory, suggests that the upside potential remains. The MACD histogram is positive, reinforcing the bullish momentum. The ADX at 28.64 indicates a strong uptrend, adding conviction to the bullish outlook. However, the Stochastic oscillator, with %K at 54.52 and %D at 58.52, signals a potential for a short-term pullback.
From a key levels perspective, immediate support can be found at $65.2, followed by $65.1 and $64.99 on the 1-hour chart. A break below $65.2 could trigger a move towards the lower support levels. On the upside, resistance is seen at $65.41, $65.52, and $65.62 on the 1-hour chart. A decisive break above $65.41 could pave the way for a test of higher resistance levels.
Zooming out to the 4-hour timeframe, support is established at $64.5, $64.2, and $63.99, while resistance is noted at $65.01, $65.22, and $65.52. These levels will be crucial in determining the medium-term trajectory of BRENT oil price analysis today. A successful breach of the $65.52 resistance could open the door for a test of the $66 level. The daily chart highlights more significant support at $63.61, $62.74, and $61.8, with resistance at $65.42, $66.36, and $67.23. These levels represent the broader context for BRENT's price action.
Geopolitical tensions in the Middle East, particularly the Strait of Hormuz crisis, are adding a layer of complexity to the oil market. Recurring tensions in this critical waterway are driving up European energy costs, as highlighted by recent news reports. According to Reuters, the potential for supply disruptions is keeping the market on edge, further supporting the bullish sentiment. This is also reflected in the WTI price, which is currently trading at $73.94, with the daily RSI soaring to 76.25, indicating strong upward momentum.
Furthermore, the upcoming economic data releases, particularly the U.S. ADP Nonfarm Employment Change on Wednesday, will be closely watched for clues about the health of the U.S. economy. Strong employment data could bolster the dollar, potentially putting downward pressure on BRENT. Conversely, weaker data could weaken the dollar and support higher oil prices. The Eurozone Consumer Price Index (CPI) data, also due on Tuesday, will provide insights into inflationary pressures in the Eurozone, which could influence the European Central Bank's (ECB) monetary policy decisions and, in turn, impact the oil market. The United Kingdom Spring Forecast Statement, also scheduled for Tuesday, will provide a snapshot of the UK's economic outlook, adding another layer of complexity.
The correlation between BRENT and the DXY (Dollar Index) remains a key factor to consider. With the DXY currently at 98.65, any further strengthening of the dollar could weigh on BRENT prices. However, the SP500 and Nasdaq are currently showing a downward trend, with the SP500 trading at 6793.7 and the Nasdaq at 24596.25. This risk-off sentiment could support BRENT prices, as investors seek safe-haven assets. The Dow Jones Industrial Average is also down, trading at 48257.5, further contributing to the risk-averse environment.
Looking at the short-term BRENT trend analysis, the 1-hour chart is showing a neutral trend, with the price hovering between $65.2 and $65.4. The 4-hour chart is showing a bullish trend, with the price supported by the 50-day moving average. The daily chart is also showing a bullish trend, with the price trading above the 200-day moving average. The overall trend, therefore, remains bullish, but short-term volatility is likely to persist.
The key to navigating this market will be disciplined risk management. Traders should wait for a clear signal before entering any positions and should always use stop-loss orders to limit potential losses. Patience looks like it will be rewarded here. Manage your risk, wait for your setup-the market always gives a second chance. The ADX at 13.59 reinforces the need for caution. A weak-trend reading like this means the breakout hasn't committed yet - it could go either way. The current choppy market requires patience.
Frequently Asked Questions: BRENT Analysis
Is BRENT a good buy right now?
At a current price of $65.73, BRENT presents a mixed picture. While the daily chart suggests a bullish trend, short-term indicators like the RSI signal overbought conditions, warranting caution before initiating a buy position. A pullback to the $65.2 support level could offer a more attractive entry point.
What is the BRENT price forecast for this week?
The BRENT price forecast for this week hinges on upcoming economic data and geopolitical developments. A sustained break above the $65.41 resistance could pave the way for a test of $66, while a break below $65.2 could lead to a retest of the $64.5 support level. Probability assessment remains neutral given the conflicting signals.
What are the key support and resistance levels for BRENT?
Key support levels for BRENT are currently at $65.2, $65.1, and $64.99 based on the 1-hour chart data. Resistance levels to watch are $65.41, $65.52, and $65.62. These levels will likely act as significant turning points in the short term.
Why is BRENT moving today?
BRENT is moving today primarily due to a combination of factors including geopolitical tensions in the Middle East and anticipation of upcoming API data releases. A weaker dollar, as indicated by the DXY, is also providing upward support, while fluctuating equity markets contribute to the volatility.
Technical Outlook Summary
| Indicator | Value | Signal |
|---|---|---|
| RSI (14) | 71.16 | Overbought |
| MACD Histogram | Positive | Bullish |
| Stochastic | 90.49 / 81.87 | Overbought |
| ADX | 13.59 | Weak Trend |
| Bollinger | Upper Band | Watch |
Key Levels
Support Levels
Resistance Levels
Track markets in real-time
AI-powered analysis, technical indicators and real-time price data.
Join Our Telegram Channel
Breaking market news, AI analysis and trading signals instantly.
Join Channel