
Brent Oil Tests $114.49 Resistance as Services Data Looms
Brent crude hovers near $114.49, testing resistance ahead of crucial US services data. Geopolitical tensions and DXY movements add complexity to the oil market outlook.
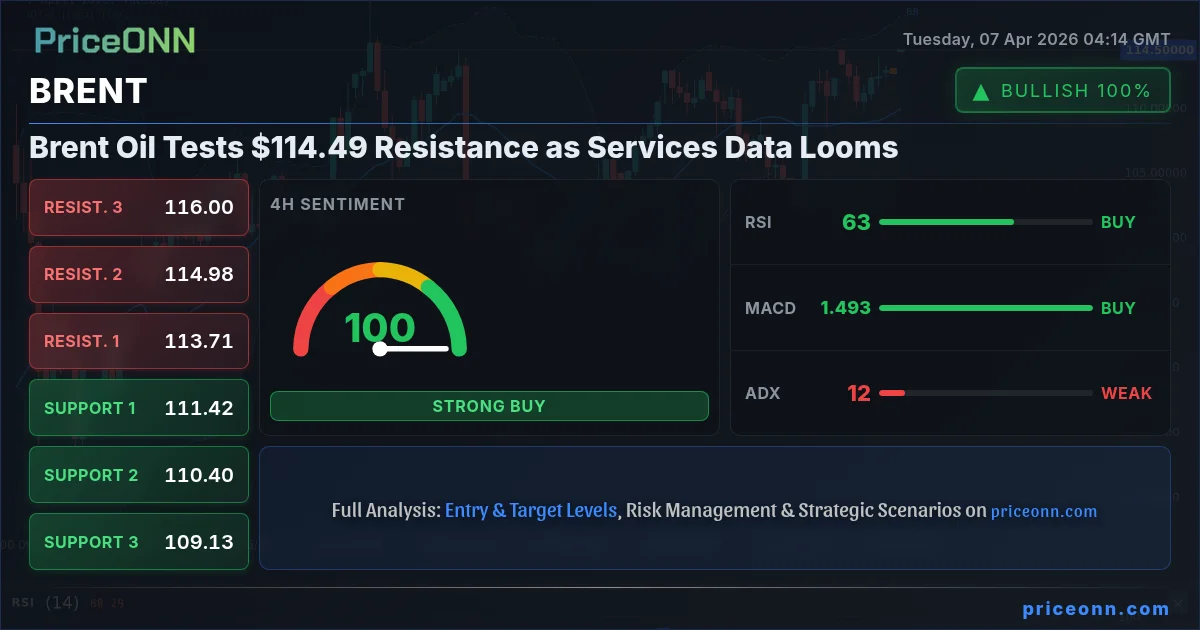
The global economic narrative is increasingly being shaped by the tug-of-war between persistent inflation concerns and the looming threat of geopolitical instability. In this complex landscape, Brent crude oil is currently finding itself at a critical juncture, hovering around the $114.49 mark and testing significant resistance levels. This pivotal moment comes just as markets brace for the release of key US services data, a report that could significantly influence risk appetite and, consequently, the trajectory of oil prices. The interplay between these factors - geopolitical tensions, the strength of the US Dollar, and upcoming economic indicators - creates a volatile environment where understanding the nuances of market sentiment is paramount for any trader navigating the oil markets.
- Brent crude is testing resistance near $114.49, with the 4-hour chart showing a neutral trend (ADX 11.82).
- The 1D RSI at 66.64 indicates a strong uptrend, but nearing overbought territory, suggesting caution.
- Geopolitical tensions and rising DXY (currently at 99.86) are key macro drivers influencing oil prices.
- Upcoming US services data (ISM Services PMI) will be critical for assessing economic health and risk appetite.
The recent surge in oil prices, with Brent crude climbing to its current position around $114.49, has been fueled by a confluence of factors, most notably escalating geopolitical tensions in the Middle East. Reports of suspicious oil trades preceding geopolitical announcements and the broader implications of conflicts in the region continue to underpin supply-side concerns. This narrative, coupled with a generally firming US Dollar Index (DXY) currently trading near 99.86, creates a challenging backdrop for oil. While a stronger dollar typically exerts downward pressure on dollar-denominated commodities like oil, the overriding supply fears have, for now, allowed oil prices to maintain a bullish bias. The market is keenly observing the DXY's next move, as a significant shift in dollar strength could alter the risk calculus for crude.
Looking at the technical picture, the Brent oil market presents a mixed, yet cautiously optimistic, profile across different timeframes. On the 1-hour chart, the trend is described as rising with 83% strength, supported by a positive MACD momentum and Stochastic oscillators showing bullish signals, albeit in overbought territory (K=94.78, D=72.55). However, the ADX value of 16.03 indicates a weak trend, suggesting that the current upward momentum may lack conviction. The RSI at 63.65 sits in neutral territory, leaning towards overbought, which could signal a potential for consolidation or a minor pullback. The proximity of the price to the $114.45 resistance level on this timeframe underscores the immediate challenge.
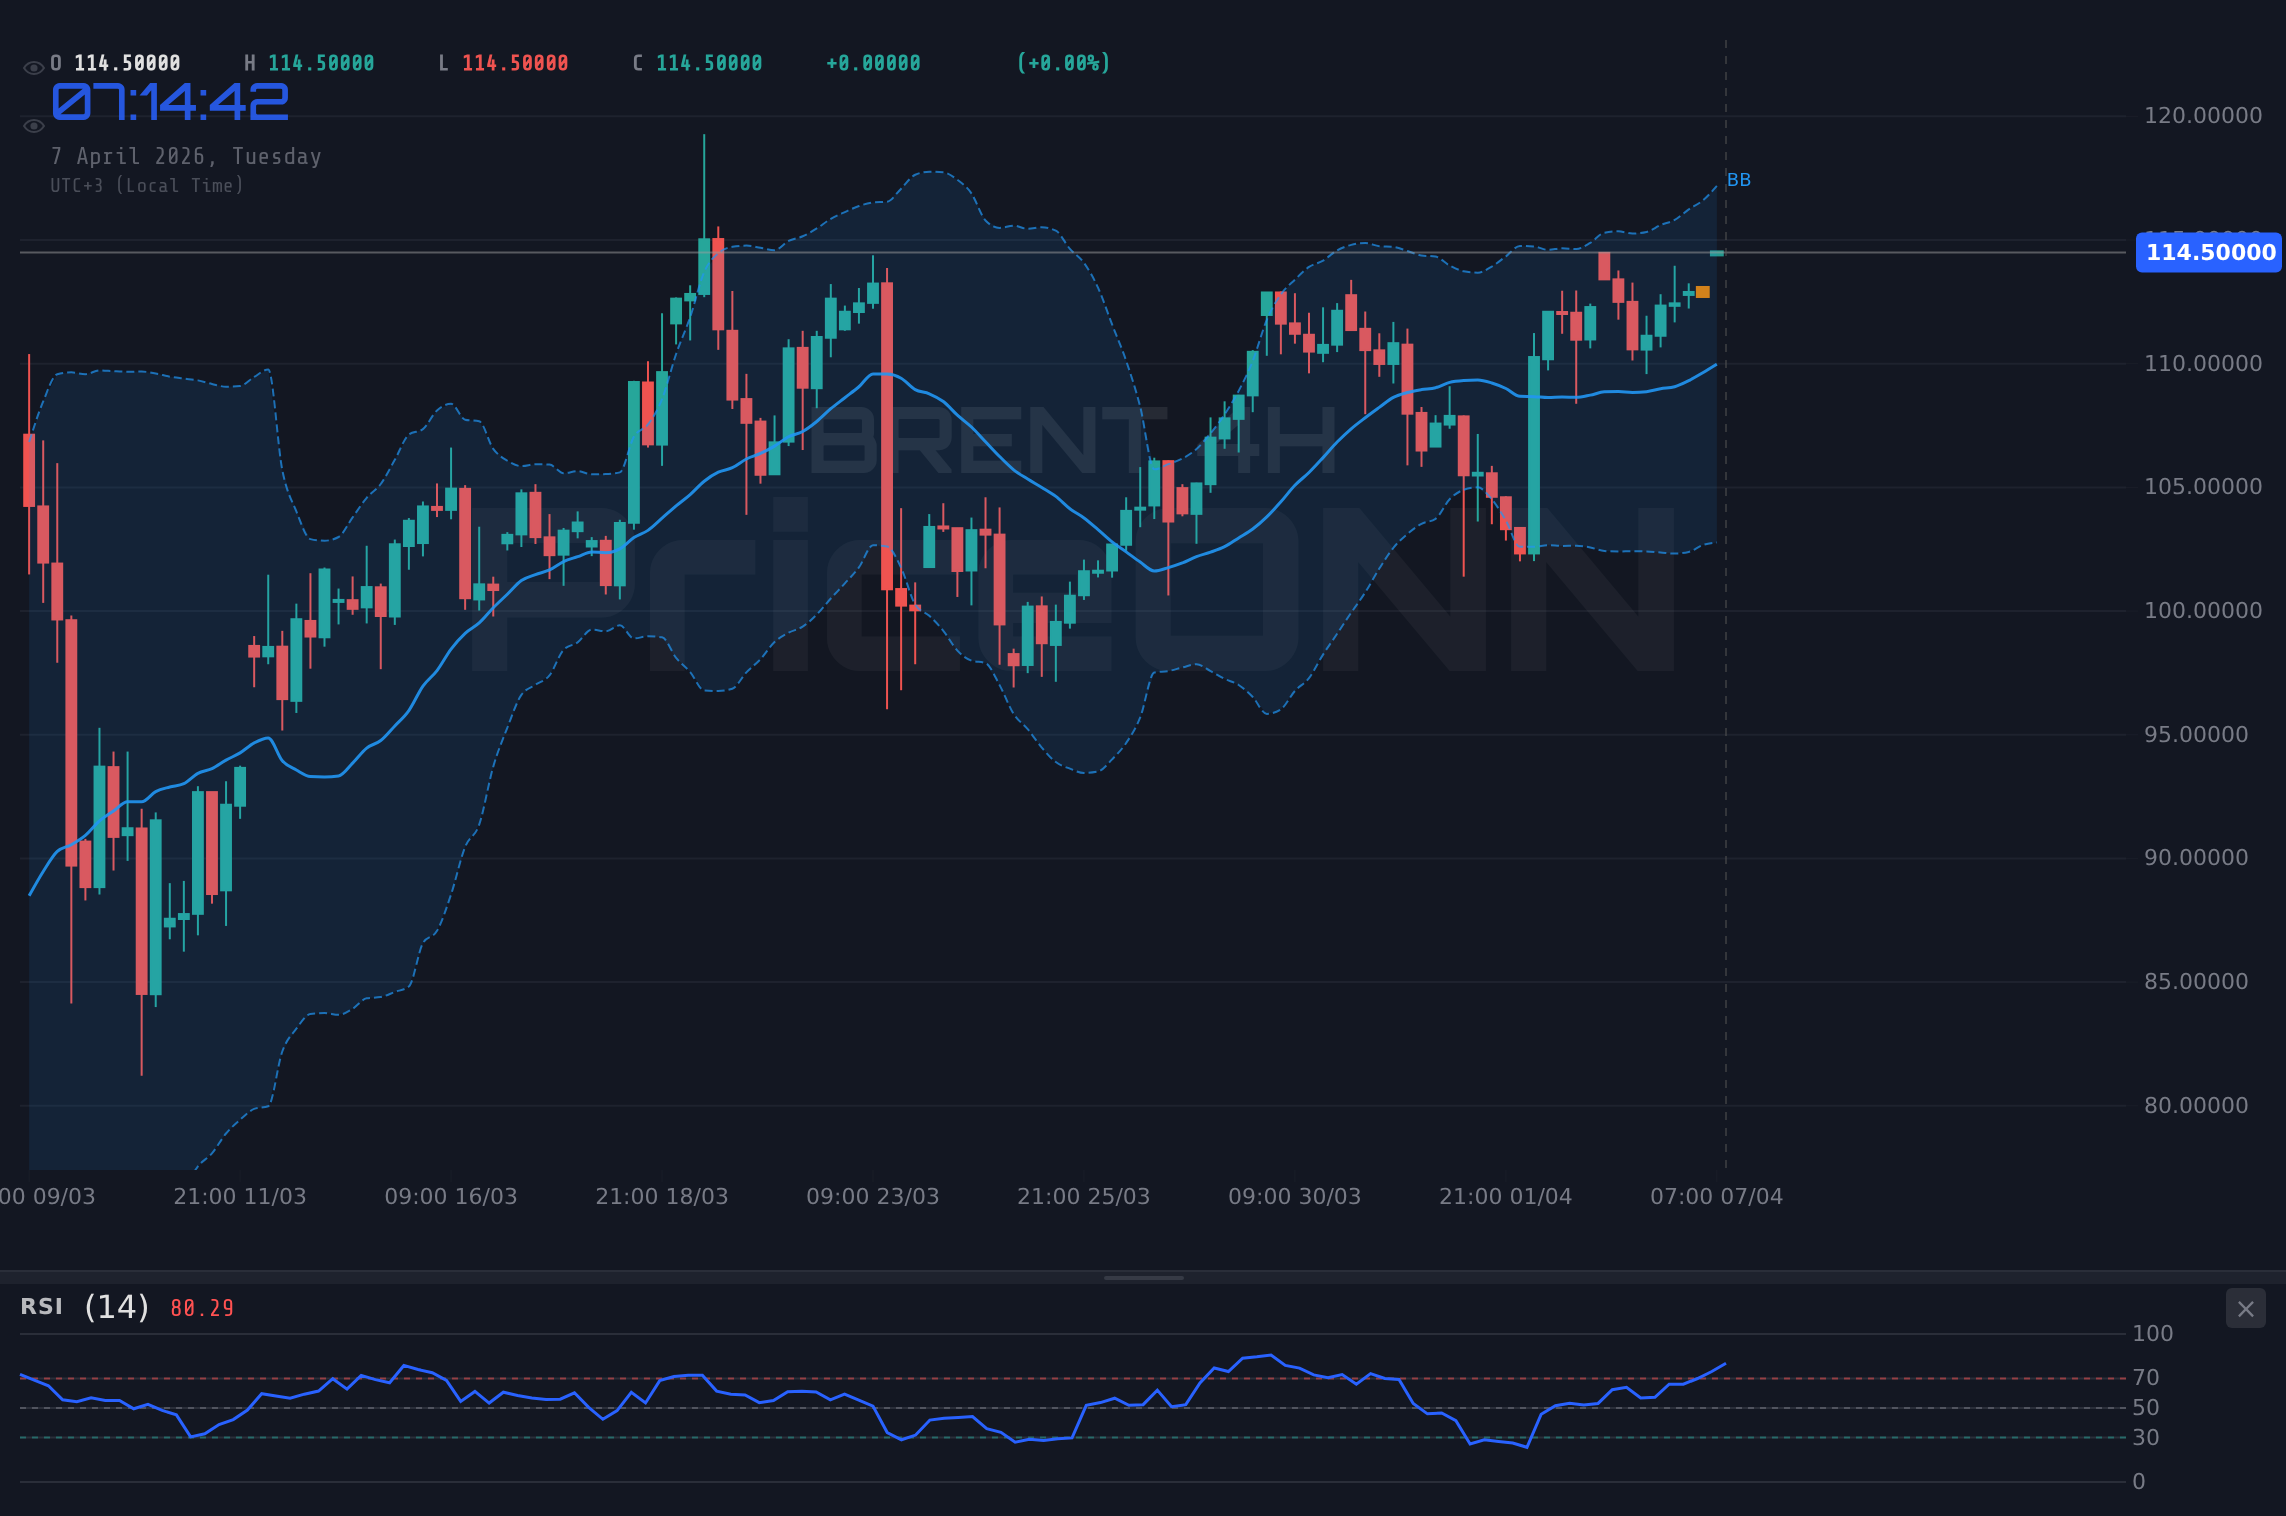
The 4-hour timeframe offers a slightly different perspective, with the trend also classified as rising but with a neutral strength of 50% (ADX: 11.82). Here, the MACD and Stochastic continue to signal buys, and RSI at 62.81 remains in bullish territory. The Bollinger Bands are above the middle band, suggesting an upward bias. Despite these bullish indicators, the low ADX value reinforces the idea of a potentially choppy or range-bound market in the short to medium term. This suggests that while the path of least resistance might be upwards, significant hurdles remain, and a clear directional commitment is yet to be established.
Zooming out to the daily chart, the picture for Brent becomes more robustly bullish, with a 100% strength trend and a very strong ADX of 56.53. The RSI at 66.64 is in the upper half of the neutral zone, indicating strong upward momentum without being excessively overbought. The MACD, though showing negative momentum on this timeframe, is above the signal line, and Stochastic is firmly in overbought territory (K=92.33, D=64.52), pointing to sustained buying pressure. The price action is above the middle Bollinger Band, reinforcing the bullish sentiment. Key resistance levels identified on the daily chart are at 114.75, 117.07, and 119.65. Holding the current price above the $114.49 level is crucial for bulls to aim for these higher targets.
Why Brent is Testing Resistance Around $114.49
The current price action for Brent crude oil, hovering precariously near the $114.49 resistance, is a direct reflection of conflicting market forces. On one hand, persistent geopolitical risks, particularly in the Middle East, continue to inject a premium into oil prices. Reports of potential escalations or disruptions to supply routes are potent drivers, creating a floor beneath crude prices and encouraging a bullish outlook. This supply-side narrative has been strong enough to counteract some of the headwinds typically associated with a strengthening US dollar. The DXY’s current level near 99.86 suggests the dollar is finding some footing, which, under normal circumstances, would make dollar-denominated assets like oil more expensive for holders of other currencies, potentially dampening demand.
However, the market’s sensitivity to upcoming economic data, specifically the US services sector report, adds a layer of caution. The ISM Services PMI, along with other related data, will provide crucial insights into the health of the world's largest economy. Stronger-than-expected data could bolster the Federal Reserve's resolve to maintain a hawkish stance on interest rates, potentially strengthening the dollar further and increasing borrowing costs globally. This, in turn, could curb economic growth and, by extension, oil demand. Conversely, weaker data might prompt a reassessment of the Fed's policy path and lead to a more risk-on sentiment, which could support oil prices by weakening the dollar and signaling a potential economic slowdown that might eventually lead to easier monetary policy.
The technical indicators also highlight this resistance zone. While the daily trend remains strongly bullish (ADX 56.53), the 1-hour RSI at 63.65 and the 4-hour RSI at 62.81 suggest that the market might be approaching levels where profit-taking could emerge. The Stochastic oscillators on the 1-hour chart are in extreme overbought territory, a classic warning sign for a potential pullback or consolidation. This confluence of macro-economic uncertainty and technical resistance around the $114.49 level suggests that a decisive break higher will require a strong catalyst, likely a more hawkish interpretation of the upcoming services data or a significant escalation of geopolitical tensions.
The Macroeconomic Backdrop: Data, Fed, and Dollar Dynamics
The Federal Reserve's monetary policy stance remains a central theme influencing all major markets, including oil. While inflation has shown signs of moderation, it remains stubbornly above the Fed's target. This has led to a cautious approach from policymakers, with market participants closely dissecting every piece of economic data for clues on future rate decisions. The upcoming US services sector data, including the ISM Services PMI, is particularly significant. This sector represents a large portion of the US economy, and its performance is a key indicator of overall economic health. A strong report could reinforce expectations of higher-for-longer interest rates, bolstering the dollar and potentially capping oil's upside. Conversely, a weaker-than-expected report might fuel speculation of earlier rate cuts, weakening the dollar and providing a tailwind for oil prices.
The US Dollar Index (DXY), currently trading around 99.86, is a critical barometer of global risk sentiment and a significant driver for commodities. A rising DXY generally correlates with falling oil prices, as oil becomes more expensive for international buyers. However, the current environment, characterized by elevated geopolitical risks, has shown that this inverse relationship can be temporarily overridden by supply-side fears. Should the US services data come in strong, it would likely support the dollar's upward trajectory, potentially creating headwinds for Brent crude as it tests resistance near $114.49. Traders will be watching for any signs of a sustained move above the 100.00 psychological level for the DXY, which could signal a broader risk-off sentiment shift.
Furthermore, the yield on US Treasury bonds plays a crucial role. Rising yields can indicate expectations of sustained inflation or a stronger economy, both of which can impact commodity demand and the attractiveness of alternative safe-haven assets. The current yield environment, coupled with the Fed's communication, dictates the cost of capital and influences investment flows. For oil, higher yields can increase the cost of storage and financing, potentially weighing on prices, although this effect is often secondary to supply concerns in the current climate.
Geopolitical Undercurrents: The Ever-Present Supply Risk
The ongoing geopolitical landscape continues to be a primary driver for crude oil prices, adding a significant risk premium that cannot be ignored. The Middle East remains a focal point, with any perceived escalation of tensions or disruption to supply lines having an immediate and pronounced effect on oil markets. News reports highlighting unusual trading activity preceding geopolitical announcements related to Iran serve as a stark reminder of how sensitive the market is to supply-side shocks. While direct disruptions are not currently occurring, the *threat* of such events is enough to keep prices elevated and support levels like the $113.55 and $113.37 on the 1-hour chart for Brent.
This geopolitical backdrop is also influencing currency markets, with the USD/JPY pair stalling near 160.00 as haven demand lingers. This suggests that while the dollar is generally strong, there's underlying caution in the market. For oil, this means that any positive news regarding a de-escalation of tensions could lead to a swift unwinding of the geopolitical premium, potentially causing prices to fall sharply from current levels near $114.49. Conversely, any renewed flare-up could send prices surging towards the 114.75 and 117.07 resistance levels identified on the daily chart. The market is essentially pricing in a higher probability of supply disruptions than in typical market conditions.
The broader commodity complex is also showing signs of this geopolitical influence. Gold prices have seen some recovery amid these tensions, acting as a traditional safe-haven asset. While not directly correlated in the short term, a broad move into safe havens due to escalating global risks could eventually spill over into other markets, potentially impacting oil demand if it signals a severe global economic slowdown. For now, however, the direct supply risks associated with oil remain the dominant narrative, keeping prices buoyant despite broader risk-off undertones in other markets.
Intermarket Analysis: Correlations and Divergences
Understanding how Brent crude interacts with other major markets is crucial for a holistic view. The US Dollar Index (DXY) is a primary correlation to watch. With the DXY currently trading near 99.86, a rising trend on the daily chart (ADX 29.17) suggests underlying dollar strength. Historically, a stronger dollar makes oil more expensive, but the current geopolitical premium has somewhat muted this effect. If the DXY breaks decisively above 100.00, it could exert significant downward pressure on Brent, especially if it coincides with weaker economic data. The 1-hour chart shows the DXY RSI at 64.16, nearing overbought, which might signal a temporary pause or pullback in dollar strength, offering some breathing room for oil.
Equity markets, represented by the SP500 and Nasdaq, serve as a gauge for risk appetite. The SP500's daily chart shows a strong downtrend (ADX 47.51), currently trading at 6572.87. This risk-off sentiment typically favors safe-haven assets and can sometimes lead to reduced demand for riskier assets like commodities if a broader economic slowdown is feared. However, oil's unique supply-driven narrative has allowed it to move somewhat independently. If equities were to stage a significant recovery, it would likely coincide with a weakening dollar and potentially higher oil prices, reinforcing the bullish scenario for Brent testing resistance around $114.49.
The correlation with other energy commodities like WTI is naturally very high, given they are benchmarks for the same underlying commodity. WTI is also showing strong bullish signals on multiple timeframes, trading at 116.60, reinforcing the upward trend in the broader energy complex. The fact that both benchmarks are showing strength suggests that the underlying demand and supply factors are robust. However, the divergence in ADX strength (Brent 56.53 daily vs WTI 59.16 daily) indicates slightly different trend commitments, with WTI perhaps having a more committed trend at this moment.
Navigating the Near-Term: Data Dependency and Key Levels
As traders await the crucial US services data, the immediate future for Brent crude around the $114.49 level is likely to be characterized by heightened volatility and sensitivity to headlines. The technical picture offers conflicting signals across timeframes: strong bullish trends on the daily chart are tempered by weaker trend strength and overbought conditions on shorter timeframes. This suggests that a breakout above immediate resistance will require a significant catalyst, either a geopolitical escalation or a surprisingly strong economic data release that reinforces the demand outlook.
The key support levels to watch on the 1-hour chart are 113.55 and 113.37, while resistance is eyed at 114.45 and the slightly higher 114.75 on the daily chart. A failure to hold these immediate supports could see a retracement towards the 4-hour support at 111.42. Conversely, a decisive break above 114.75, fueled by positive news, could open the door to further upside towards the 117.07 and 119.65 levels identified on the daily chart. The ADX values across timeframes (16.03 on 1H, 11.82 on 4H, 56.53 on 1D) paint a picture of a market consolidating on shorter timeframes but showing a strong, committed trend on the daily. This suggests that while short-term chop is likely, the longer-term bias remains bullish.
The market sentiment is currently leaning towards a bullish bias due to supply concerns, but the upcoming data release introduces a significant wildcard. If the ISM Services PMI comes in significantly above expectations, it could trigger a dollar rally and a sell-off in oil, pushing prices back towards the 4-hour support at 111.42. If the data disappoints, it could weaken the dollar and boost risk appetite, potentially sending Brent higher towards its daily resistance targets. The interplay between geopolitical risk and macroeconomic data will dictate the direction in the immediate term.
Bearish Scenario: Data Disappoints, Dollar Surges
35% ProbabilityBullish Scenario: Geopolitical Escalation or Strong Demand Data
55% ProbabilityNeutral Scenario: Consolidation Ahead of Data
10% ProbabilityFrequently Asked Questions: BRENT Analysis
What happens if Brent crude breaks above the $114.75 resistance level?
A decisive break above $114.75, particularly on strong volume and positive geopolitical or demand news, could signal a continuation of the bullish trend. This would likely target the next daily resistance at $117.07, with further upside potential towards $119.65 if momentum persists.
Should I consider selling Brent at the current $114.49 levels given the RSI at 66.64?
While the daily RSI at 66.64 indicates strong bullish momentum, it's not yet in extreme overbought territory. Selling directly at resistance carries risk; it might be prudent to wait for confirmation of a bearish reversal, such as a close below $113.55 on the 1-hour chart, or observe the reaction to the upcoming US services data before committing to a short position.
Is the ADX reading of 56.53 on the daily chart a strong sell signal for Brent?
No, a high ADX reading like 56.53 on the daily chart actually signifies a very strong trend, not necessarily a sell signal. It indicates that the current price movement, which is bullish, is well-supported by momentum. The real sell signal would come from bearish divergence on indicators like RSI or MACD, or a confirmed break below key support levels.
How will the upcoming US services data affect Brent prices around $114.49?
Stronger-than-expected US services data could strengthen the dollar and curb oil demand, potentially pushing Brent below $113.55. Conversely, weaker data might boost risk appetite and weaken the dollar, supporting oil prices to test resistance above $114.75. The market's interpretation of the data in relation to Fed policy expectations will be key.
The path forward for Brent crude oil hinges on the delicate balance between persistent geopolitical supply risks and the macroeconomic outlook shaped by upcoming economic data. While the daily technicals remain strongly bullish, the immediate resistance at $114.49, coupled with shorter-term technicals and the looming US services report, suggests a period of heightened volatility and potential consolidation. Traders must remain vigilant, managing risk diligently and waiting for clear directional signals. Volatility creates opportunity - those prepared with a robust strategy, mindful of both macro drivers and technical levels, will be best positioned to navigate these choppy waters.
Track markets in real-time
AI-powered analysis, technical indicators and real-time price data.
Join Our Telegram Channel
Breaking market news, AI analysis and trading signals instantly.
Join Channel