Brent Surges Past $65.73: Technical Rally or Sustainable Trend?
Brent crude oil price rallies to $65.73, prompting questions about the sustainability of this move. Is it purely technical, or are fundamental factors at play?
The price of Brent crude oil has surged past $65.73, igniting a debate among traders and analysts: Is this rally a purely technical phenomenon, or is it supported by underlying fundamental factors? The battle between bulls and bears is intensifying at this key level, and the next few sessions could determine the direction of the energy market.
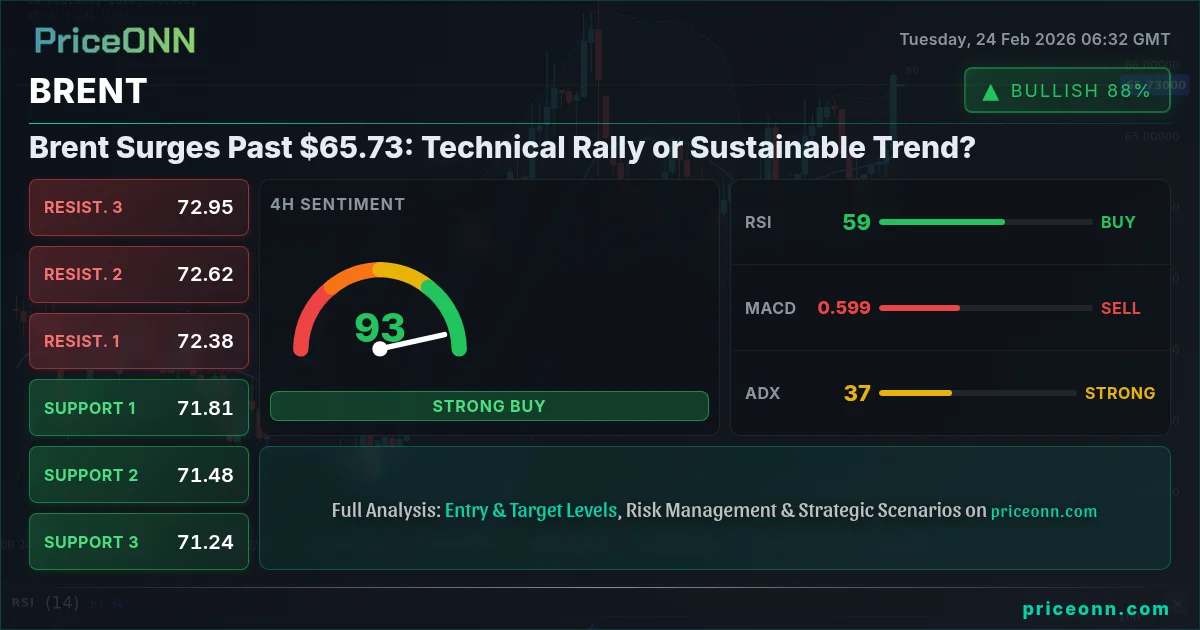
- Brent crude oil currently trades at $65.73, marking a 1.96% daily gain.
- Immediate resistance lies at $65.42, a level to watch for breakout confirmation.
- The ADX indicator at 19.03 on the 1H chart suggests a weak trend, hinting at possible consolidation.
- Geopolitical tensions and supply-side dynamics are key drivers influencing Brent’s price action.
The Bull Case: Momentum and Geopolitical Tailwinds
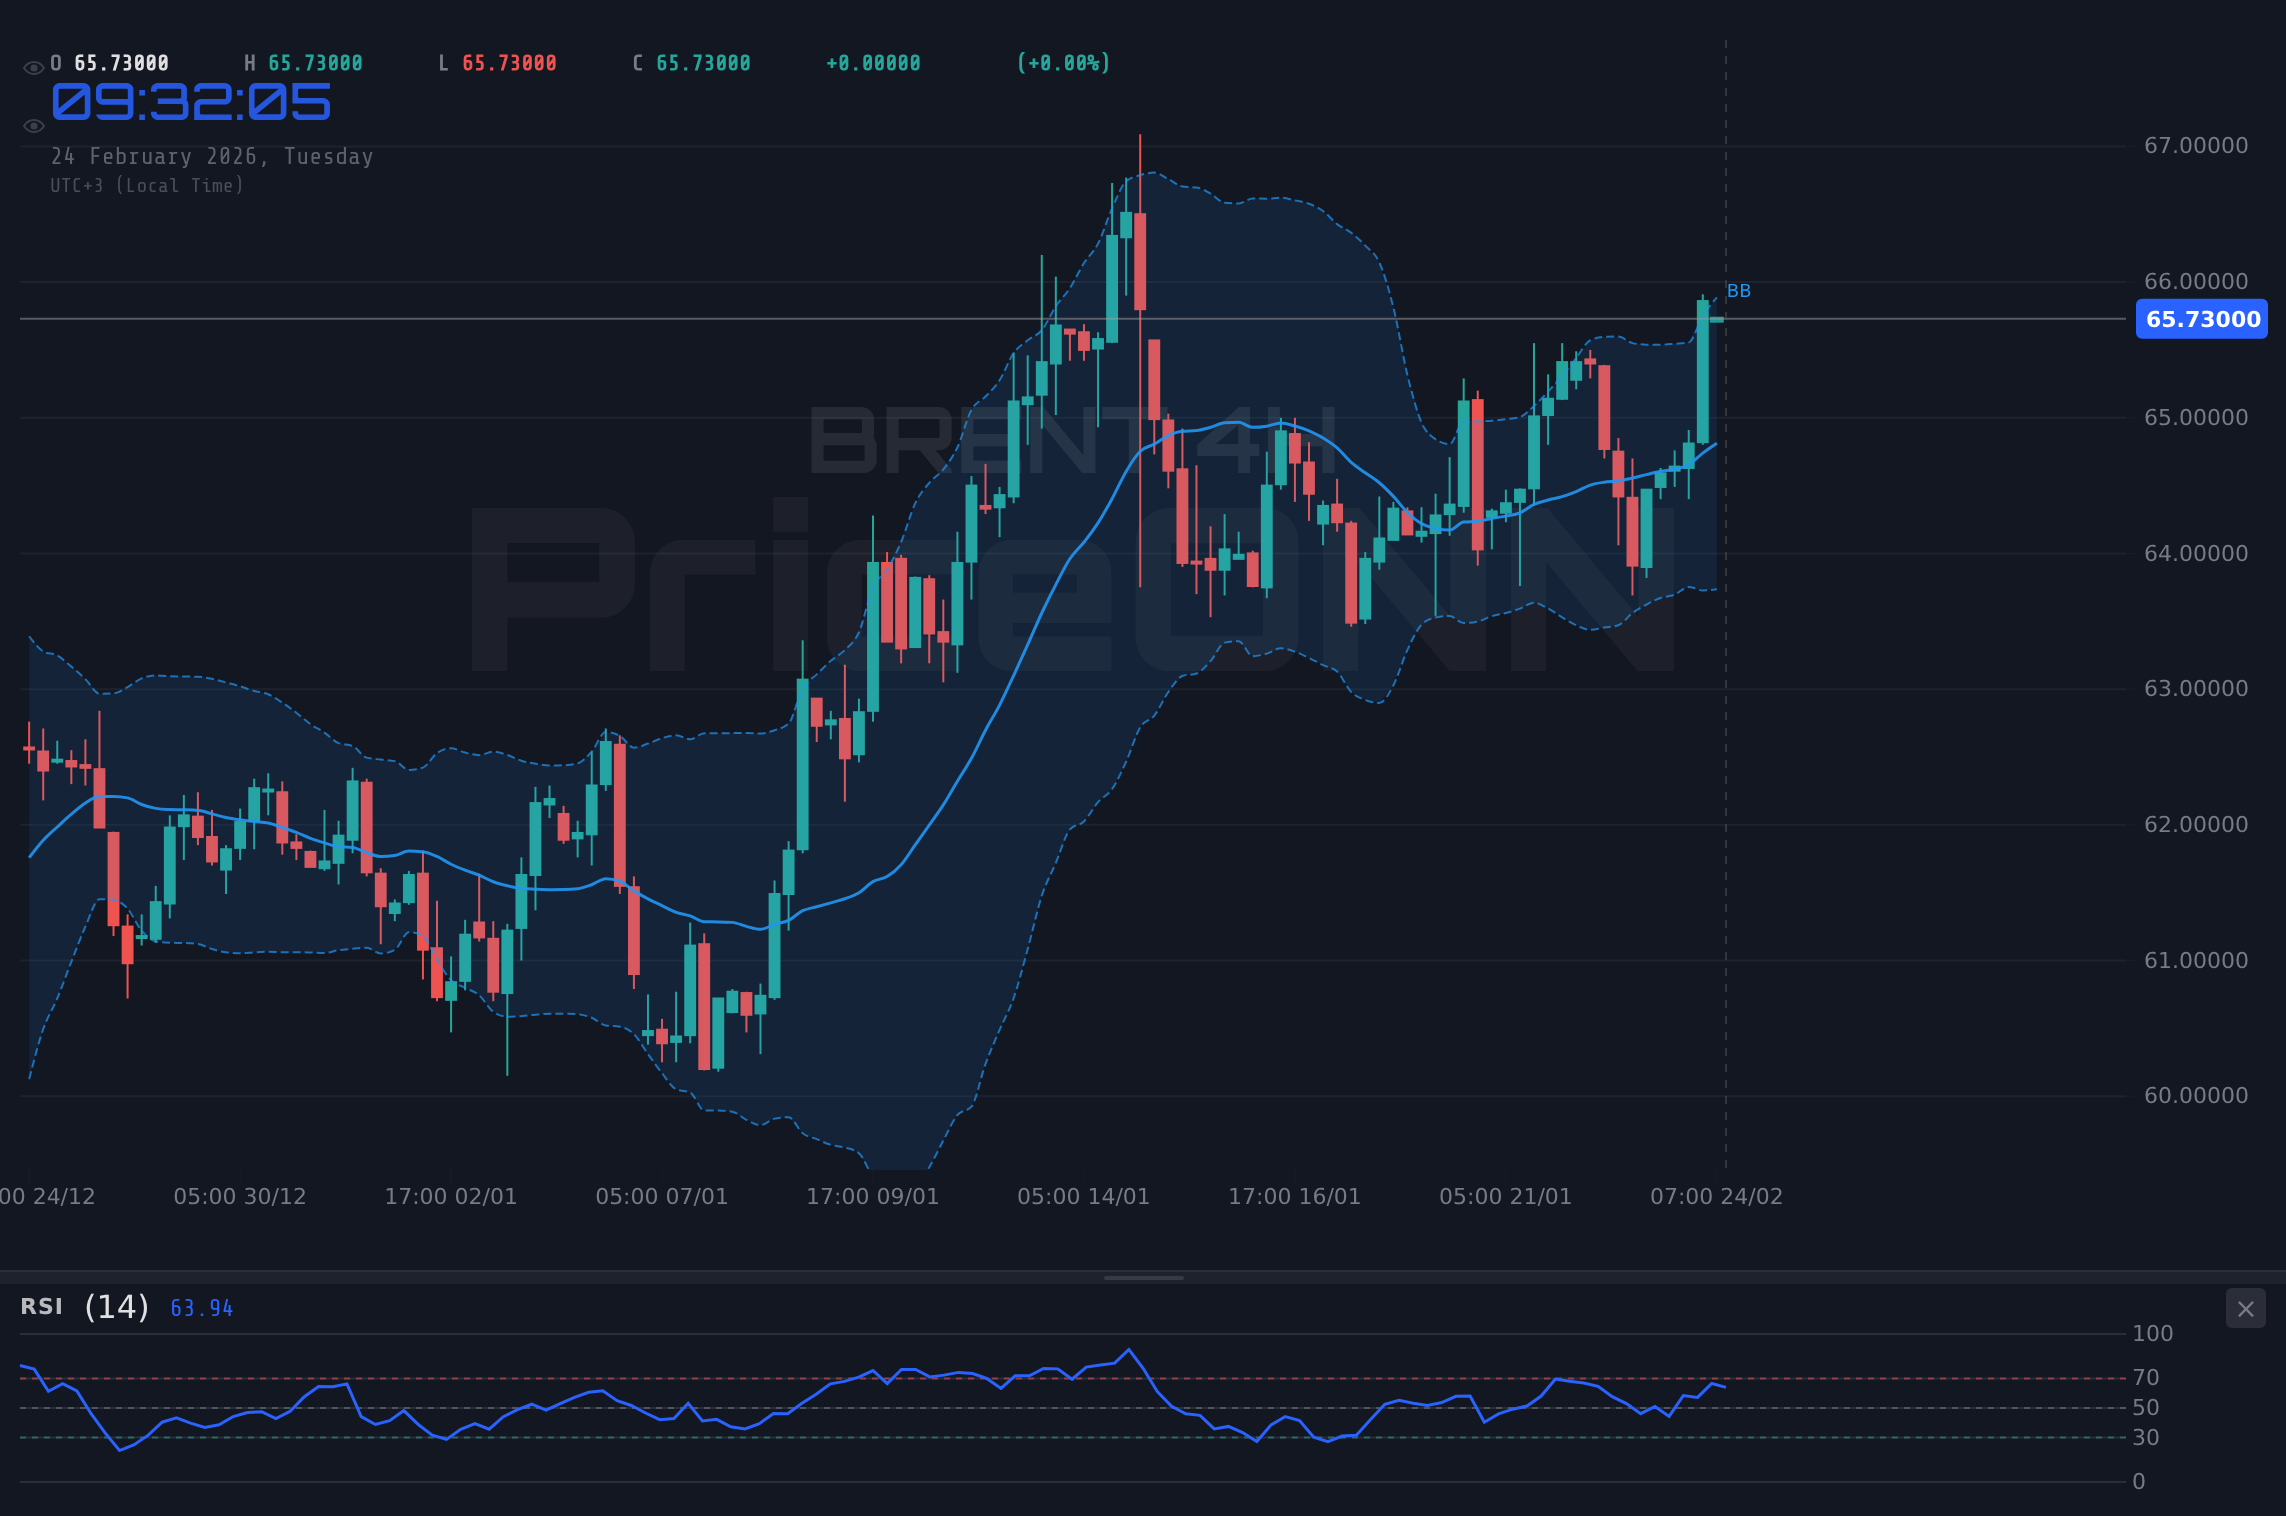
The bullish narrative for Brent is built around a combination of technical momentum and supportive geopolitical factors. Technically, the 1H chart shows the RSI at 71.16, entering overbought territory, suggesting strong buying pressure. The price is currently trading above the middle band of the Bollinger indicator, further reinforcing this bullish sentiment. The daily chart confirms a strong uptrend with the ADX at 28.64.
Beyond the technicals, geopolitical risks are providing a significant tailwind. Ongoing tensions in the Middle East, coupled with potential supply disruptions, are creating a risk premium for oil prices. As Reuters reported last week, “Geopolitical risks in key producing regions could lead to supply constraints, supporting higher crude oil prices.” This combination of technical momentum and geopolitical uncertainty is fueling the bull case for Brent, with some analysts projecting a move towards the $67.23 resistance level.
WTI crude, a close correlate to Brent, is also showing strength, currently trading at $66.87. The strength in WTI supports the bullish Brent narrative, suggesting a broader trend in the energy market. The 1D chart for WTI shows an ADX of 28.18, confirming a strong uptrend. The positive correlation between Brent and WTI is an important factor for traders to consider, as strength in one market can often spill over into the other.
The Bear Case: Overbought Conditions and Demand Concerns
However, the bear case for Brent revolves around the potential for overbought conditions and concerns about future demand. The RSI on the 1H chart at 71.16 suggests that the market may be due for a correction. Furthermore, the Stochastic indicator on the 1D chart shows %K at 54.52 and %D at 58.52, signaling a potential pullback. The MACD is positive, but the histogram shows a potential weakening of momentum.
Demand-side concerns are also weighing on the market. As Bloomberg reported earlier this month, “Slowing economic growth in key consuming nations could curb oil demand, putting downward pressure on prices.” Concerns about a potential global recession and its impact on oil consumption are fueling the bear case for Brent. Additionally, a stronger dollar, with the DXY index currently at 97.51, could exert further downward pressure on crude oil prices. With the DXY showing an uptrend on the 1H and 4H charts, the inverse correlation between the dollar and oil prices is a key factor to watch.
The latest economic data from major economies, including the SP500 which is currently at 6849.2, is showing mixed signals. The SP500's daily direction is upward, but the 1D chart shows that the RSI is at 46.3, the MACD is showing negative momentum, and the Stochastic is showing a downward signal, pointing to a possible lack of confidence in the market. This uncertainty is contributing to the bear case for Brent. This market is showing signs of exhaustion and could be due for a period of profit taking.
Technicals as a Tiebreaker: Which Way Will Brent Break?
Given the conflicting signals from both fundamental and technical factors, traders are closely watching key technical levels to determine the next direction for Brent. Immediate resistance lies at $65.42, a level that has acted as a ceiling in the past. A breakout above this level could signal a continuation of the bullish trend, potentially opening the door for a move towards $66.36. However, failure to break above $65.42 could confirm the bear case, leading to a pullback towards the $63.61 support level.
Analyzing the 4H timeframe provides additional insights. The RSI at 62.33 is neutral, but the ADX at 13.59 suggests a weak trend, implying that the market is in a consolidation phase. The Stochastic indicator is showing a bullish signal, but the MACD has a positive value, pointing to a possible lack of confidence in the market. This uncertainty is adding to the complexity of the situation, and traders are advised to exercise caution.
Looking at the daily chart, the key support levels are $63.61, $62.74, and $61.80. These levels could act as potential buying opportunities for long-term investors. On the upside, the key resistance levels are $65.42, $66.36, and $67.23. A sustained break above $67.23 would signal a strong bullish trend, potentially leading to higher prices. The ADX on the daily chart is at 28.64, indicating a strong uptrend. The Stochastic indicator is showing a bearish signal, which could point to a short-term pullback before the uptrend continues. The RSI is at 59.99, suggesting the market is not yet overbought.
The Verdict: Cautious Optimism, but Watch the Break
Considering the conflicting signals, a cautious approach is warranted. The bullish momentum and geopolitical risks provide a positive backdrop for Brent, but overbought conditions and demand concerns cannot be ignored. The key to determining the next direction lies in monitoring the $65.42 resistance level. A sustained break above this level would confirm the bull case, while failure to break could lead to a pullback towards key support levels.
Given the current market dynamics, traders should focus on risk management and avoid overexposure to the energy market. The ADX indicator at 19.03 on the 1H chart suggests a weak trend, indicating that the market may be prone to volatility. A well-defined trading plan with clear entry and exit points is essential for navigating these uncertain waters. Patience looks like it will be rewarded here. Manage your risk, wait for your setup - the market always gives a second chance.
Frequently Asked Questions: BRENT Analysis
Is BRENT a good buy right now?
BRENT's current price is $65.73, a level above the S3 support level of $61.8, suggesting a possible buying opportunity. However, the RSI at 71.16 on the 1H chart indicates that it may be overbought, and further analysis is needed.
What is the BRENT price forecast for this week?
The BRENT price forecast for this week is mixed, with the possibility of reaching $67.23 if the price breaks above the $65.42 resistance level. However, a potential pullback towards the $63.61 support level is also possible if resistance is not broken.
What are the key support and resistance levels for BRENT?
The key support levels for BRENT are $63.61, $62.74, and $61.80. The key resistance levels are $65.42, $66.36, and $67.23, according to the 1D chart data.
Why is BRENT moving today?
BRENT is moving today due to a combination of bullish momentum and geopolitical risks, but overbought conditions and demand concerns may cause a pullback. The DXY index at 97.51 could also play a role.
Technical Outlook Summary
| Indicator | Value | Signal |
|---|---|---|
| RSI (14) | 59.99 | Neutral |
| MACD Histogram | Positive | Bullish |
| Stochastic | 54.52/58.52 | Bearish |
| ADX | 28.64 | Strong Trend |
| Bollinger | Middle Band | Watch |
Key Levels
Support Levels
Resistance Levels
Track markets in real-time
AI-powered analysis, technical indicators and real-time price data.
Join Our Telegram Channel
Breaking market news, AI analysis and trading signals instantly.
Join Channel