BRENT Tests $65.73 Resistance Amid Bullish Momentum
BRENT crude is testing resistance at $65.73 as bullish momentum persists. Traders eye further upside amid tight supply conditions.
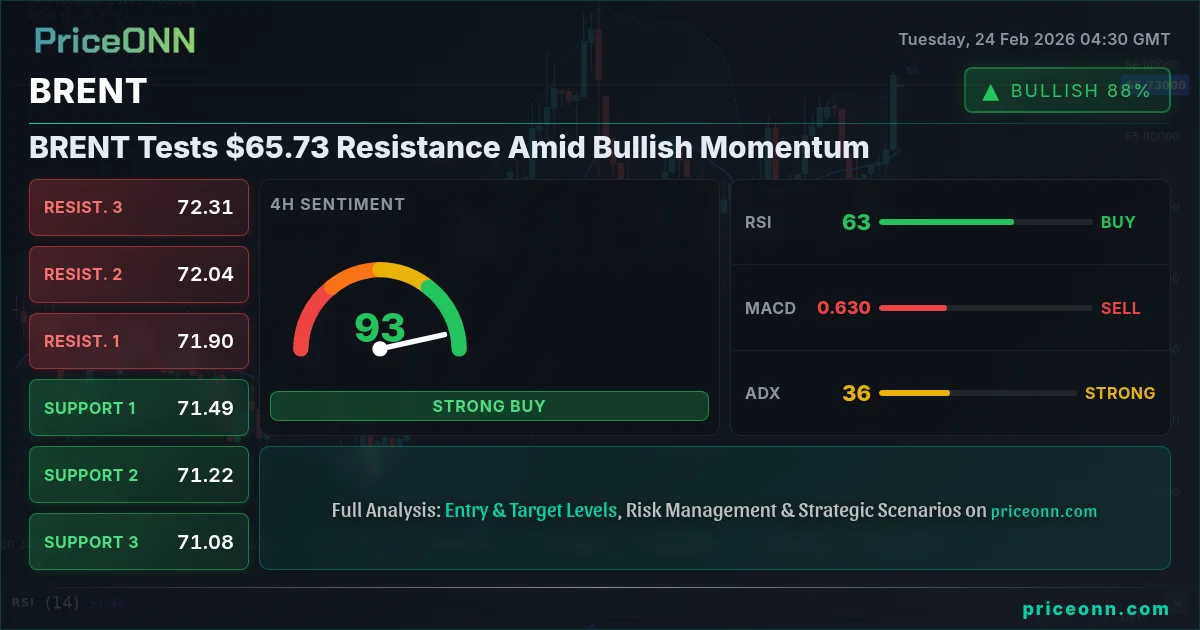
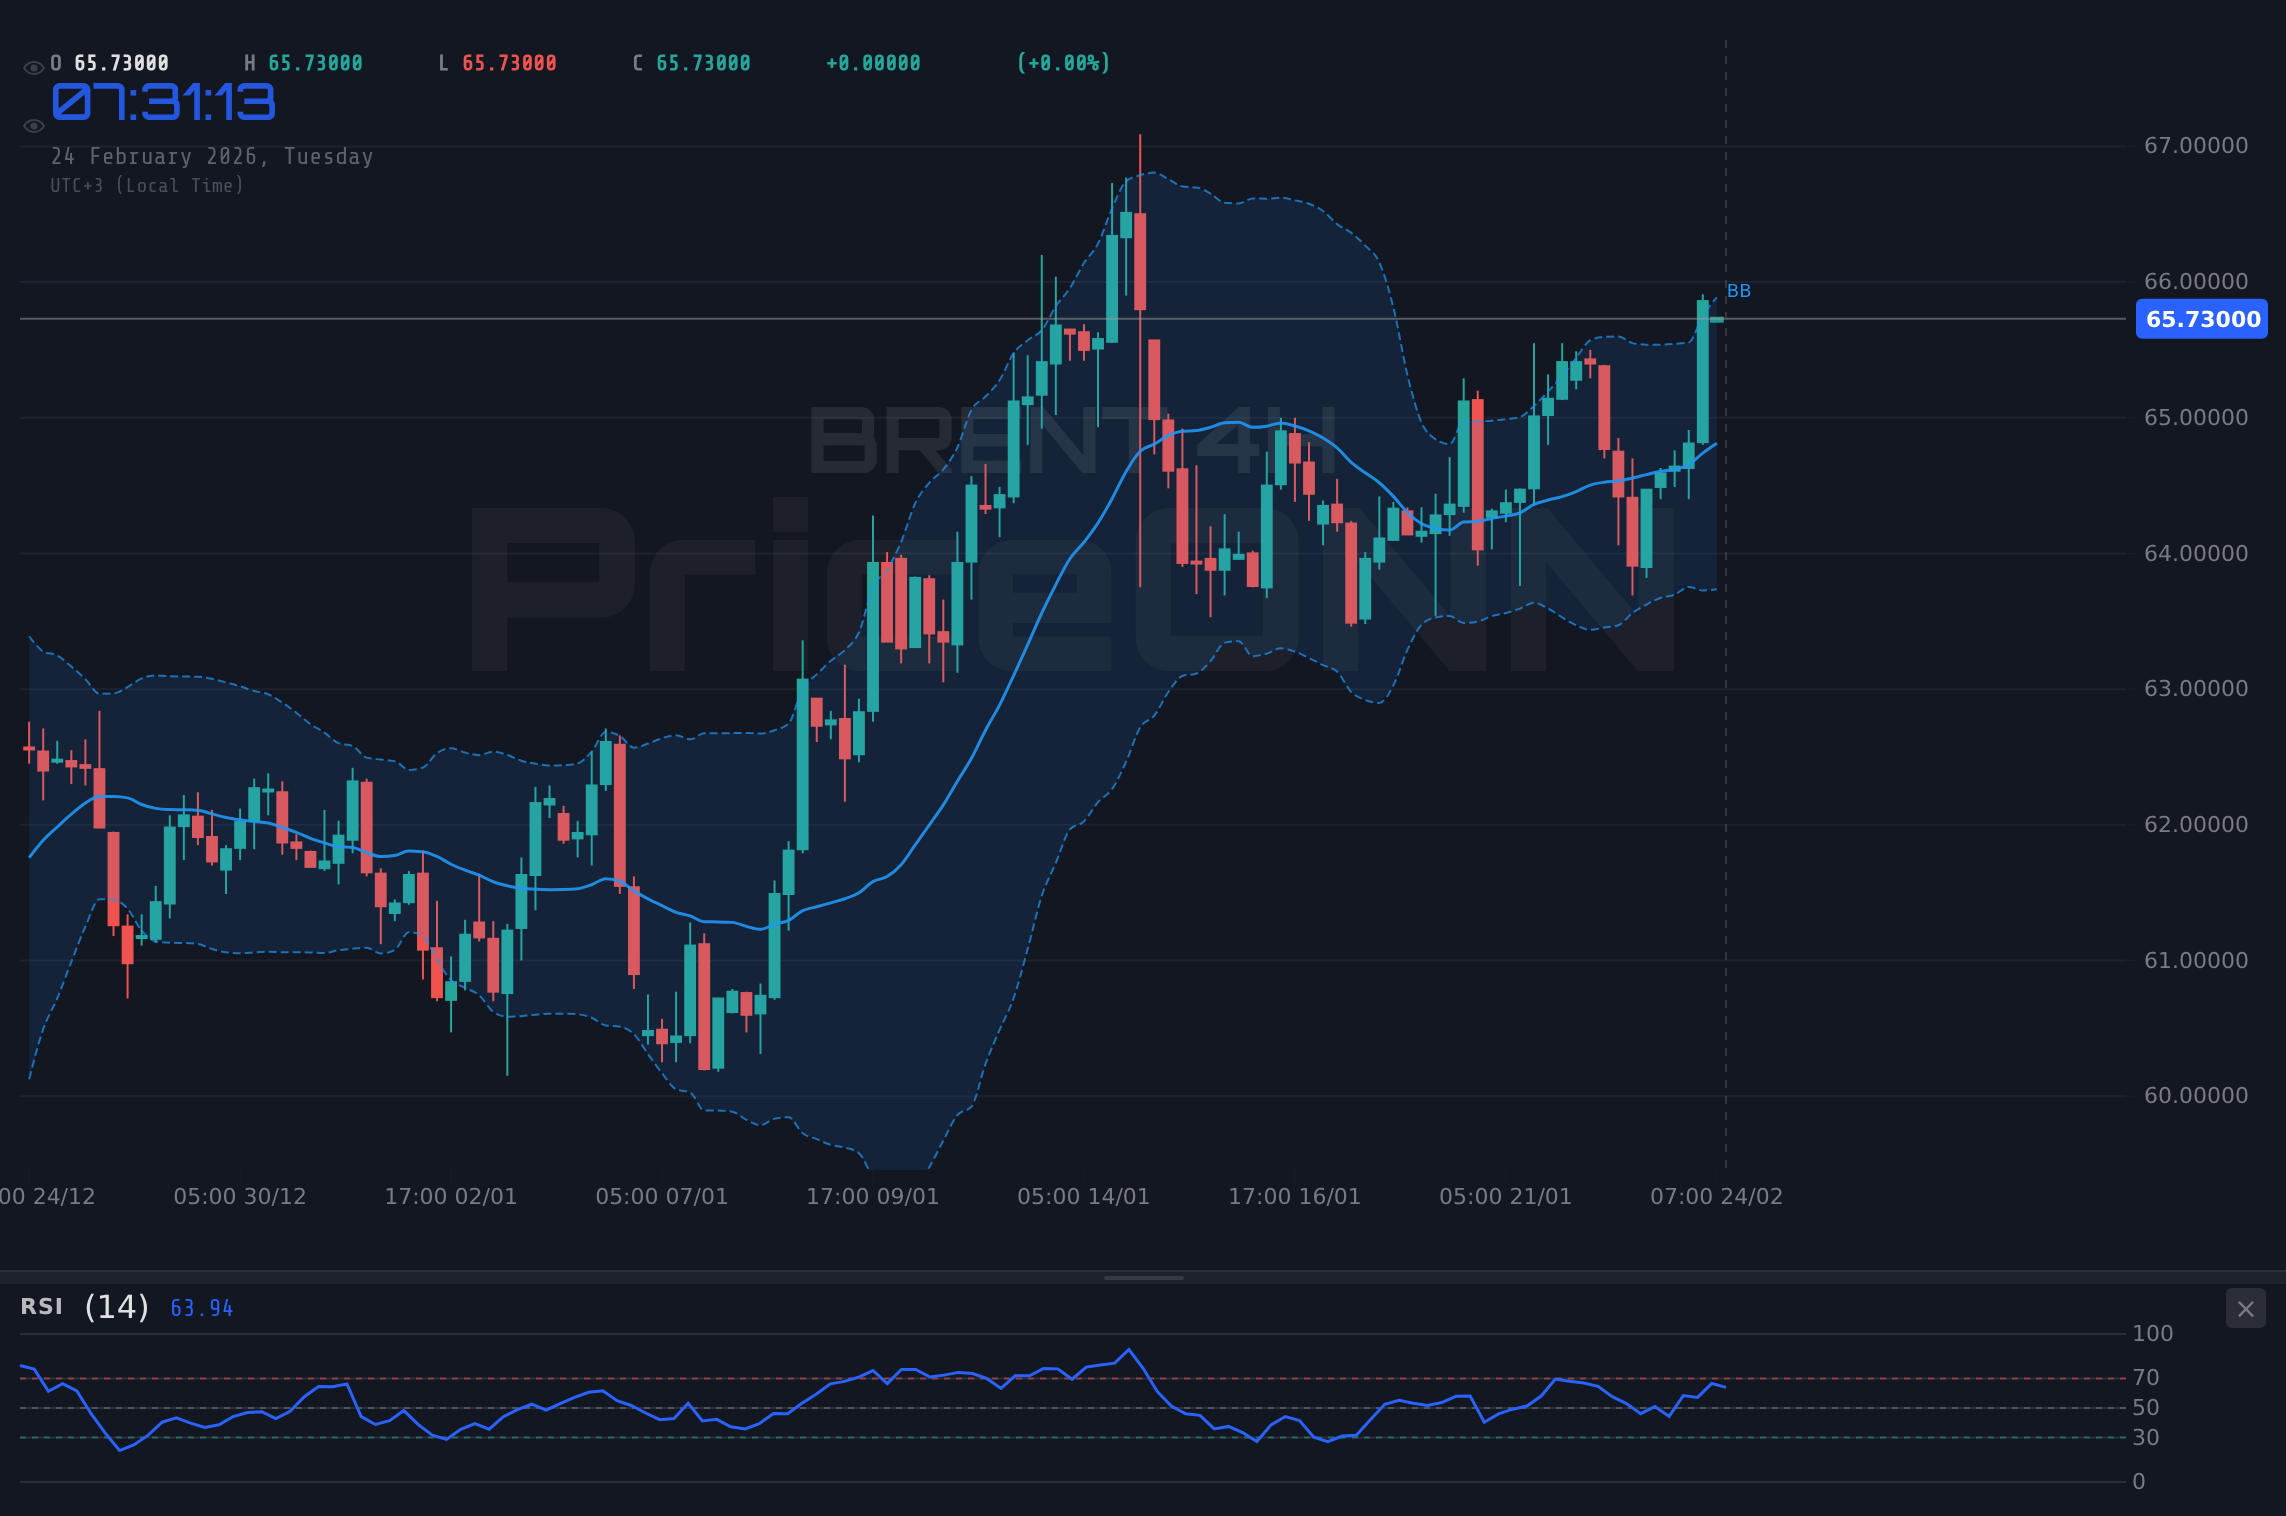
BRENT crude oil is currently trading near a critical juncture at $65.73, finding itself at the center of a tug-of-war between bullish and bearish forces. The outcome of this battle could determine the short-term trajectory of the commodity.
- RSI at 71.16 on the 1H chart signals overbought conditions, suggesting a potential pullback.
- Immediate resistance is at $65.41, a break above which could trigger further upside.
- Stochastic K=90.49, D=81.87 in the 1H timeframe suggests that the market is overbought and a correction may be imminent.
- The strong DXY, currently at 97.57, is typically a headwind for BRENT.
The Bullish Case for BRENT at $65.73
The bullish narrative for BRENT is underpinned by several key factors. Firstly, global demand continues to show resilience, particularly from emerging economies. As industrial activity picks up, the demand for crude oil as a primary energy source increases, providing a fundamental tailwind for prices. Secondly, supply-side dynamics are favorable for bulls. OPEC+ production cuts have effectively tightened the market, reducing inventories and supporting higher prices. Saudi Arabia, in particular, has been proactive in managing supply to stabilize the market.
Geopolitical risks also play a significant role in the bullish outlook. Tensions in the Middle East, a major oil-producing region, can disrupt supply lines and trigger a risk premium in oil prices. Any escalation of conflict could lead to significant price spikes. From a technical standpoint, the 1D chart shows a strong uptrend with the ADX at 28.64, indicating that the current trend has considerable momentum. Additionally, the 4H chart also indicates a strong uptrend with ADX at 36.64. These positive technical signals align with the bullish fundamental drivers, reinforcing the potential for further upside.
The Bearish Counter-Argument: Why $65.73 Could Be a Top
Despite the compelling bullish factors, there are significant headwinds that could limit BRENT's upside or even trigger a reversal. One of the primary concerns is the potential for a slowdown in global economic growth. High interest rates and inflationary pressures could dampen economic activity, reducing demand for oil. Furthermore, increased production from non-OPEC sources, such as the United States, could offset the impact of OPEC+ cuts, easing supply constraints. Technically, the 1H chart paints a less optimistic picture. The RSI at 71.16 suggests that BRENT is overbought in the short term, increasing the likelihood of a pullback. The Stochastic K=90.49, D=81.87 reinforces this view. These indicators suggest that the market is due for a correction, which could lead to a retest of lower support levels.
Another factor weighing on BRENT is the strength of the US dollar. The DXY, currently at 97.57, is exerting downward pressure on commodity prices. A stronger dollar makes oil more expensive for buyers using other currencies, potentially reducing demand. Moreover, shifts in market sentiment can quickly turn bullish trends into bearish ones. If investors begin to anticipate weaker demand or increased supply, prices could fall sharply. According to Reuters, "analysts are closely watching economic data for signs of a slowdown, which could impact oil demand."
Technicals as the Tiebreaker: What Indicators Are Saying
To navigate this conflicting landscape, technical analysis provides valuable insights. The 1H timeframe presents a mixed picture. The RSI at 71.16 signals overbought conditions, suggesting a potential pullback. However, the MACD shows positive momentum, indicating that the bullish trend is still intact. The ADX, however, is only at 19.03, suggesting a weak trend. The Stochastic K=90.49, D=81.87 also indicates overbought conditions, suggesting that the market is due for a correction.
On the 4H chart, the RSI is at 62.33, indicating a neutral reading. The MACD is showing positive momentum, supporting the bullish case. The ADX is at 13.59, indicating a weak trend, which suggests that the market is consolidating. The Stochastic K=68.29, D=44.75 supports the bullish case. The 1D timeframe presents a more bullish picture. The RSI is at 59.99, indicating a neutral reading with an upward trajectory. The MACD is showing positive momentum, confirming the bullish trend. The ADX is at 28.64, indicating a relatively strong trend. The Stochastic K=54.52, D=58.52 suggests that the market is trending downward.
Key support levels to watch are $65.20, $65.10 and $64.99 on the 1H chart. A break below these levels could signal a shift in momentum to the downside. On the upside, resistance levels are at $65.41, $65.52, and $65.62. A sustained move above these levels could pave the way for further gains. Given these conflicting signals, traders should exercise caution and wait for confirmation before committing to a directional bias.
BRENT Verdict: A Cautious Approach at $65.73
Considering the bullish fundamental backdrop, the bearish technical signals, and the influence of the stronger dollar, the outlook for BRENT at $65.73 remains uncertain. The conflicting signals suggest that a period of consolidation may be likely before the next major move. The market is waiting for a catalyst to break the current impasse. This could come in the form of a surprise economic data release, a geopolitical event, or a shift in OPEC+ policy.
Until a clear direction emerges, traders should exercise caution. Scalpers may find opportunities in the short-term volatility, but swing traders and long-term investors should remain on the sidelines. Monitoring the DXY and key economic indicators will be crucial in determining the next move for BRENT. As Bloomberg reported, "traders are bracing for increased volatility as economic data continues to surprise."
Frequently Asked Questions: BRENT Analysis
Is BRENT a good buy right now?
At the current price of $65.73, BRENT presents a mixed picture. The RSI on the 1H chart is overbought, suggesting a potential pullback. Therefore, a cautious approach is warranted until a clear direction emerges.
What is the BRENT price forecast for this week?
The BRENT price forecast for this week is highly dependent on upcoming economic data and geopolitical developments. A break above $65.41 could lead to further gains, while a break below $65.20 could trigger a retest of lower support levels.
What are the key support and resistance levels for BRENT?
Key support levels for BRENT are $65.20, $65.10 and $64.99. Key resistance levels are $65.41, $65.52, and $65.62. These levels should be closely monitored for potential breakouts or breakdowns.
Why is BRENT moving today?
BRENT is moving today due to a combination of factors, including global demand, OPEC+ production cuts, and geopolitical risks. The stronger dollar is also exerting downward pressure on prices, creating a tug-of-war between bullish and bearish forces.
Track markets in real-time
AI-powered analysis, technical indicators and real-time price data.
Join Our Telegram Channel
Breaking market news, AI analysis and trading signals instantly.
Join Channel