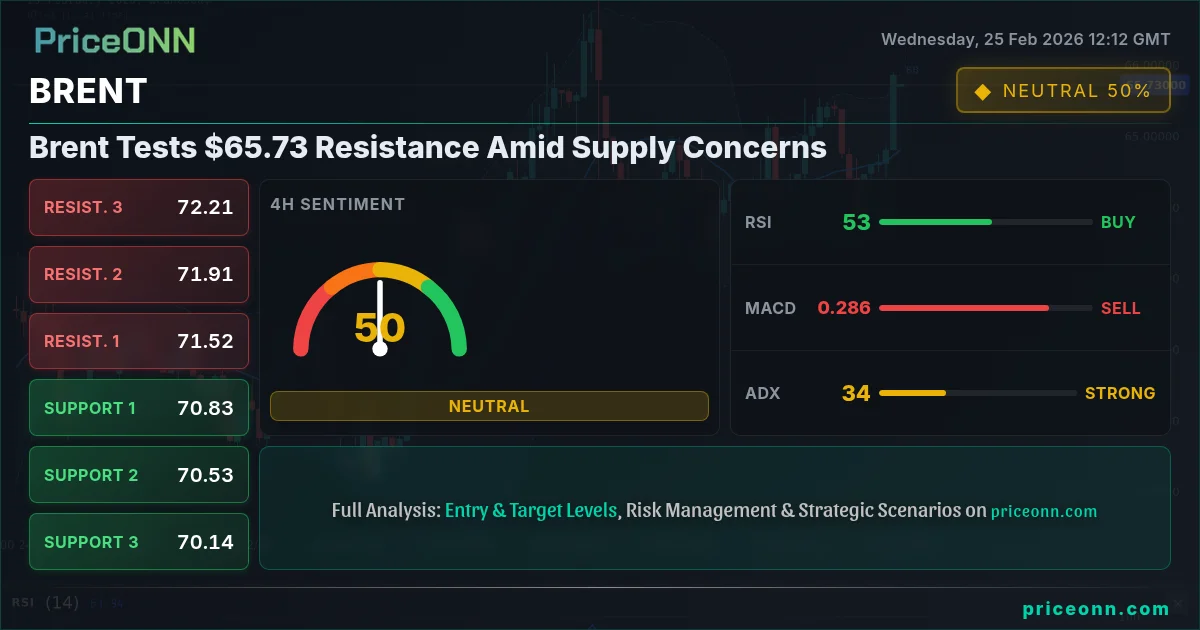
Brent Tests $65.73 Resistance Amid Supply Concerns
Brent crude oil is testing resistance at $65.73, up 1.96% today, fueled by concerns over global supply disruptions and increasing demand.
Brent crude oil is currently trading near $65.73, buoyed by a complex interplay of factors ranging from geopolitical tensions to evolving economic indicators. The energy market is closely monitoring these developments, as they hold significant implications for global inflation and economic stability.
- RSI at 71.16 on the 1H chart signals overbought conditions, hinting at potential near-term pullback.
- Strong support for Brent lies at $63.61 on the daily timeframe, a key level for maintaining the bullish trend.
- The ADX on the daily chart is at 28.64, indicating a strong underlying bullish trend despite short-term volatility.
- DXY's rise to 97.61 is exerting pressure on Brent, potentially capping further gains in the near term.
Crude Oil Technical Overview
Analyzing the technical indicators, Brent's current trajectory presents a mixed bag of signals. The 1-hour Relative Strength Index (RSI) is notably high at 71.16, suggesting that the commodity is currently in overbought territory. This condition often precedes a period of consolidation or a downward correction as traders take profits. However, the Moving Average Convergence Divergence (MACD) on the same timeframe shows positive momentum, indicating that the underlying trend still favors the bulls. The ADX on the 1H chart sits at 19.03, a weak-trend reading, adding to the uncertainty. The price action is above the middle Bollinger Band, suggesting a bullish bias, but the Stochastic oscillator, with %K at 90.49 and %D at 81.87, also confirms overbought conditions.
Stepping back to the 4-hour chart, the picture remains complex. The RSI is at a more moderate 62.33, indicating there is still room for upward movement before reaching overbought levels. The MACD also exhibits positive momentum. The ADX is at 13.59, a weak-trend reading. The Stochastic oscillator shows a bullish signal with %K at 68.29 and %D at 44.75. The price action is above the middle Bollinger Band, suggesting a bullish bias.
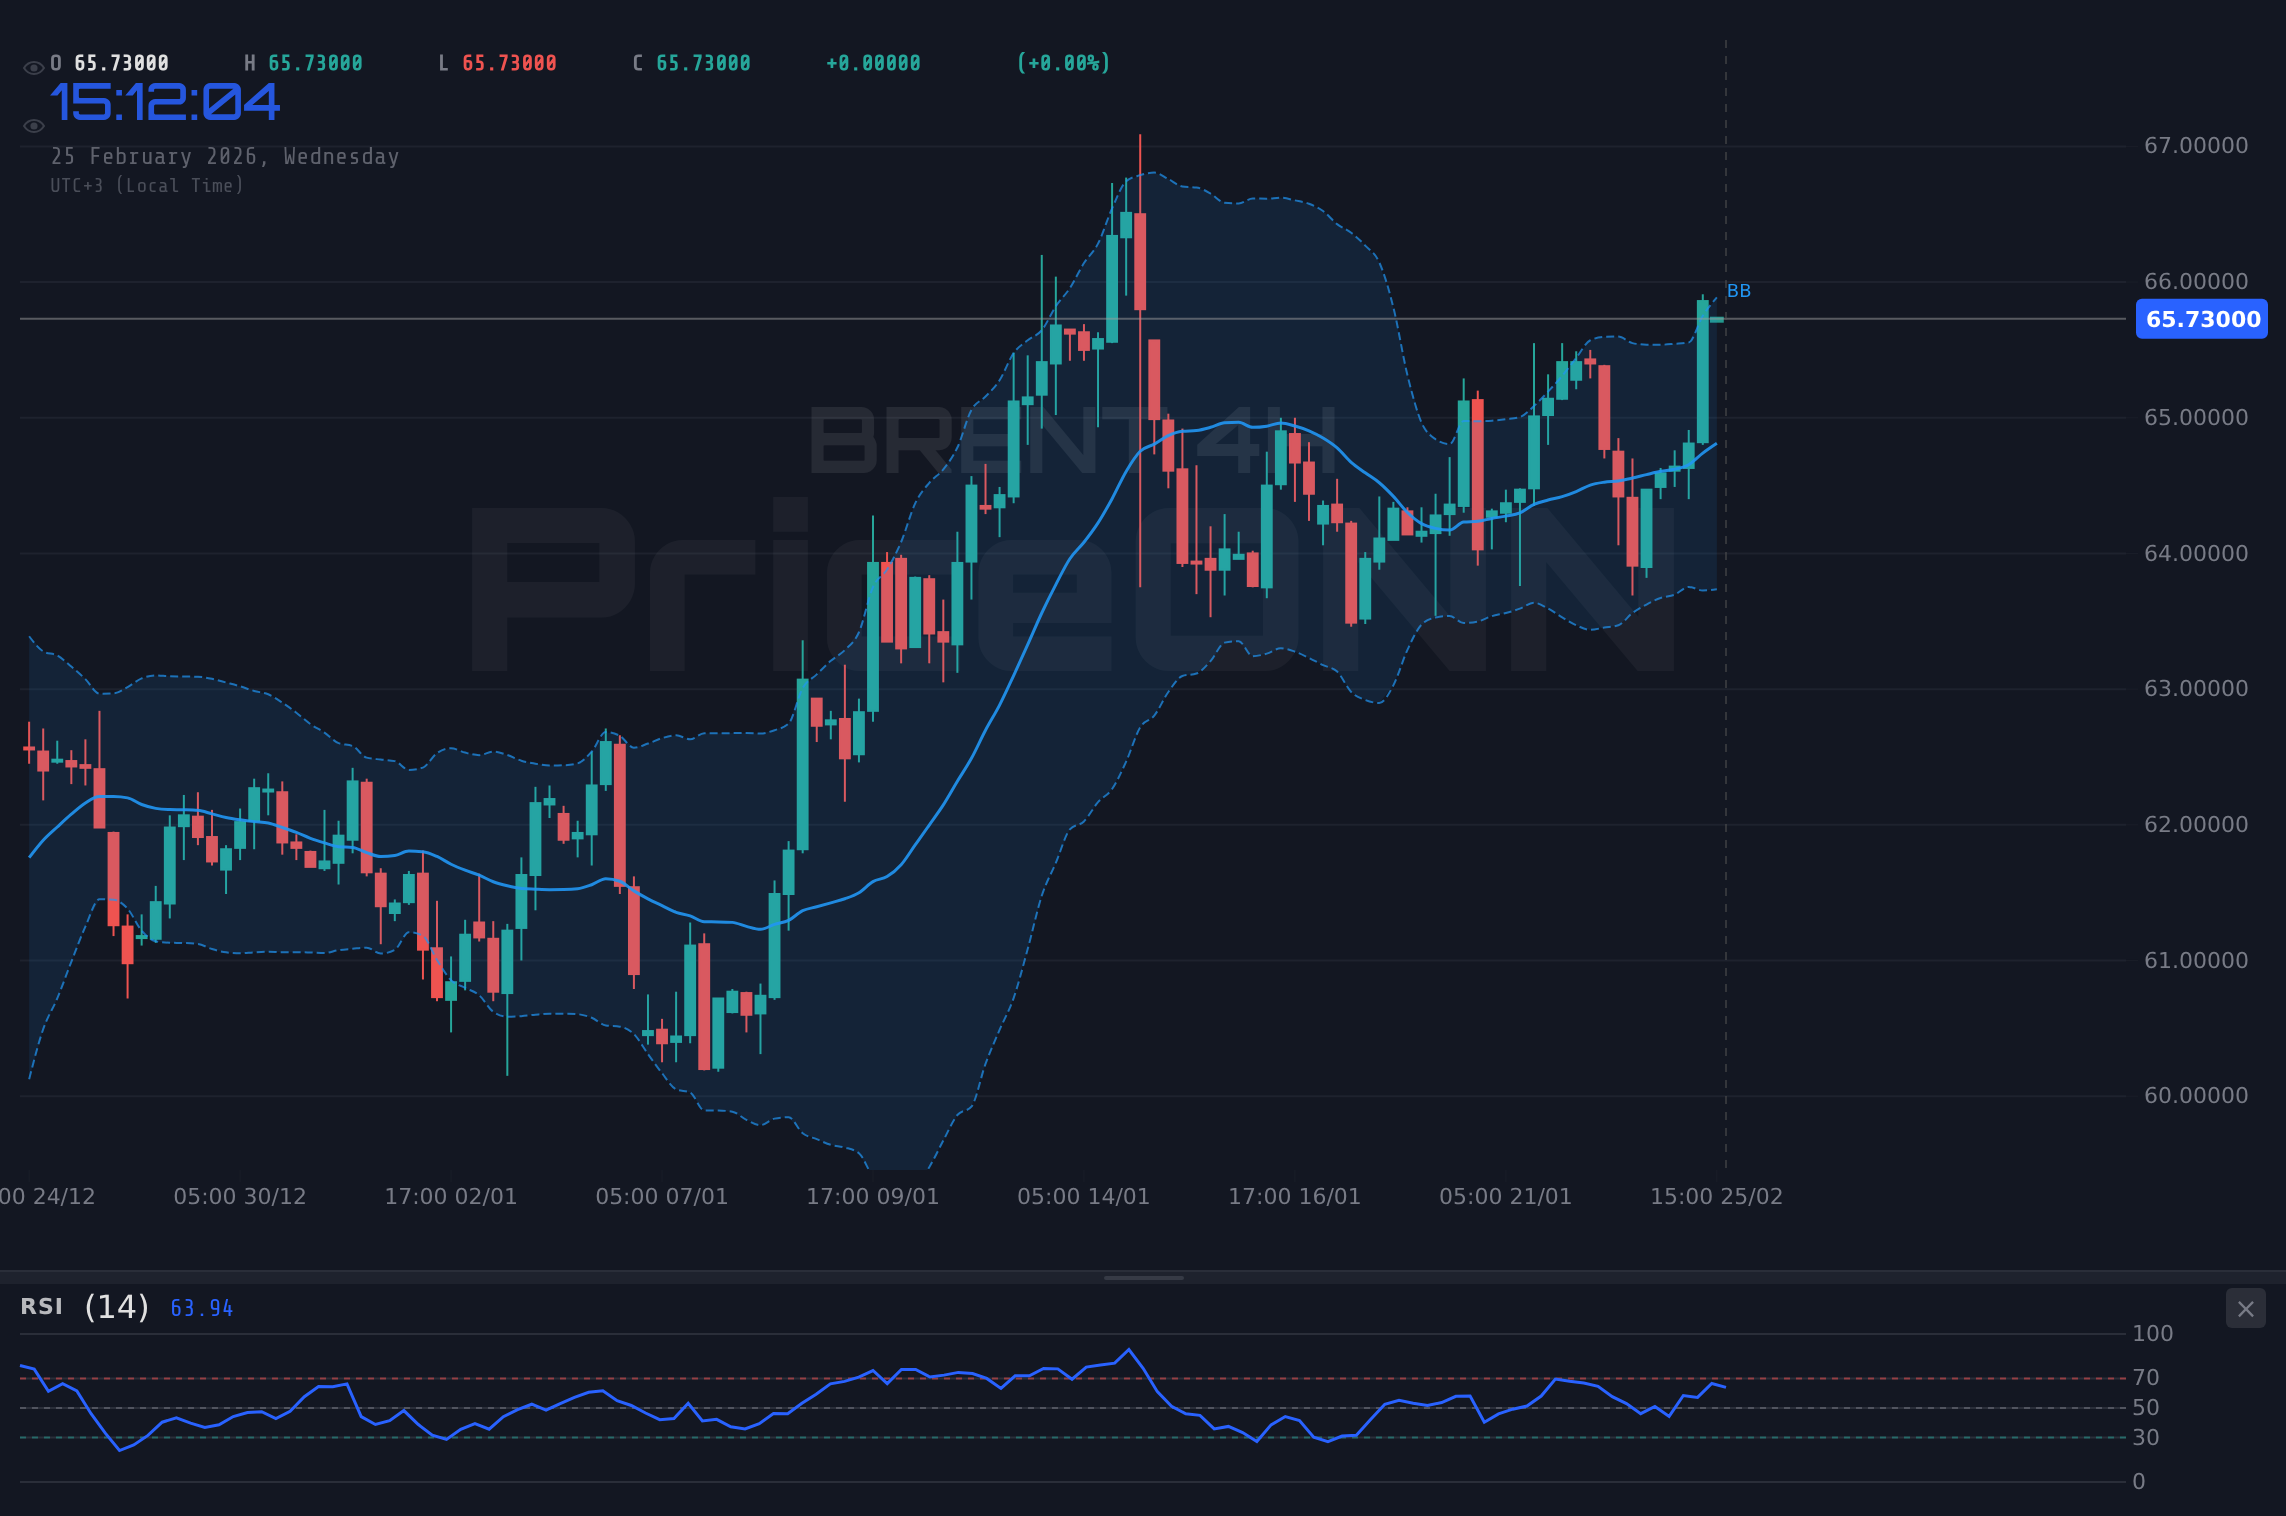
On the daily timeframe, the bullish case appears stronger. The RSI is at 59.99, and the MACD shows positive momentum. The daily ADX is at 28.64, suggesting a strong underlying trend. The price action is above the middle Bollinger Band, suggesting a bullish bias. However, the Stochastic oscillator gives a bearish signal, with %K at 54.52 and %D at 58.52.
These conflicting signals across multiple timeframes suggest that while the overall trend for BRENT is bullish, short-term volatility and potential for a pullback cannot be ignored. Traders should exercise caution and closely monitor price action around key support and resistance levels.
Key Support and Resistance Levels for BRENT
Currently, immediate support can be found at $65.20, followed by $65.10 and $64.99 on the 1-hour timeframe. These levels represent potential areas where buying interest could emerge, providing a cushion against further declines. A break below these levels could trigger a deeper correction towards $63.61, the daily support level.
On the upside, immediate resistance is observed at $65.41, with further levels at $65.52 and $65.62 on the 1-hour chart. Clearing these hurdles could pave the way for a test of higher targets at $66.36 and $67.23 on the daily timeframe. It's worth noting that the $66.04 high of the day could act as a psychological resistance level.
These levels are crucial for traders as potential entry and exit points. However, it's important to consider other factors, such as overall market sentiment and economic data releases, before making any trading decisions.
Fundamental Factors Influencing BRENT Prices
The recent surge in BRENT prices can be attributed to a combination of supply-side constraints and demand-side optimism. Geopolitical tensions in key oil-producing regions, particularly the Middle East, continue to pose a significant risk to global supply chains. Any escalation in these tensions could lead to disruptions in oil production and exports, further tightening the market.
On the demand side, positive economic data from major economies, such as the United States and China, have fueled expectations of increased oil consumption. As economic activity rebounds, demand for energy rises, putting upward pressure on prices. However, it's important to note that the strength of the dollar, as reflected by the DXY at 97.61, can act as a headwind for BRENT prices, as a stronger dollar makes oil more expensive for buyers using other currencies.
Additionally, the market is closely watching the upcoming U.S. Crude Oil Inventories data release. A larger-than-expected draw in inventories could further support prices, while a build could trigger a correction. The market also awaits further updates from OPEC+ regarding their production policy. Any indication that the group is considering further output cuts could provide a significant boost to BRENT prices.
The Impact of Economic Data and Central Bank Policies
Economic data releases and central bank policies play a crucial role in shaping the outlook for BRENT prices. Inflation data, particularly the U.S. CPI and PCE figures, are closely watched by the market as they influence the Federal Reserve's interest rate decisions. Higher-than-expected inflation could prompt the Fed to tighten monetary policy more aggressively, potentially dampening economic growth and, consequently, oil demand.
Conversely, weaker-than-expected inflation could lead the Fed to adopt a more dovish stance, supporting economic growth and oil demand. The European Central Bank's (ECB) monetary policy decisions also have implications for BRENT prices, as they affect the economic outlook for the Eurozone, a major consumer of oil.
The actual and forecast values for the upcoming data releases, will be a key driver of market sentiment. Investors will be closely monitoring the details of the upcoming data, as they will give a clue as to the direction of oil prices.
Correlations with DXY and Equity Markets
BRENT prices often exhibit an inverse relationship with the U.S. dollar, as measured by the DXY. A stronger dollar, as indicated by the current DXY level of 97.61, tends to put downward pressure on BRENT prices, while a weaker dollar provides support. This correlation stems from the fact that oil is priced in U.S. dollars, making it more expensive for buyers using other currencies when the dollar strengthens.
Additionally, BRENT prices are often correlated with equity markets, particularly the S&P 500 and Nasdaq. A strong performance in equity markets typically reflects a positive economic outlook, which translates into higher oil demand and prices. Conversely, a decline in equity markets suggests a weakening economic outlook, potentially leading to lower oil demand and prices. Currently, SP500 is at 6909.05 and Nasdaq100 is at 25067.02, both showing a rise.
Trading Strategies for BRENT Crude Oil
Given the current market conditions and technical outlook, traders can consider various strategies to capitalize on potential movements in BRENT prices. One approach is to monitor key support and resistance levels for potential breakout or breakdown opportunities. A break above resistance at $65.41 could signal further upside, while a break below support at $65.20 could indicate a deeper correction.
Another strategy is to utilize technical indicators, such as the RSI and MACD, to identify potential overbought or oversold conditions. However, it's important to remember that these indicators should not be used in isolation but rather in conjunction with other factors, such as price action and fundamental analysis.
Frequently Asked Questions: BRENT Analysis
Is BRENT a good buy right now?
Given the RSI indicating overbought conditions on the 1H chart, and the strong ADX on the daily chart, caution is advised before initiating long positions. Traders should wait for a pullback towards the $65.20 support level or a breakout above the $65.41 resistance level before considering entry.
What is the BRENT price forecast for this week?
The short-term forecast for BRENT is mixed, with potential for both upside and downside movement. A break above $65.41 could pave the way for a test of higher targets at $66.36 and $67.23, while a break below $65.20 could trigger a correction towards $63.61. The probability of either scenario playing out depends on upcoming economic data releases and geopolitical developments.
What are the key support and resistance levels for BRENT?
Key support levels for BRENT are $65.20, $65.10, and $64.99 on the 1-hour timeframe, and $63.61 on the daily timeframe. Key resistance levels are $65.41, $65.52, and $65.62 on the 1-hour chart, and $66.36 and $67.23 on the daily timeframe. These levels represent potential areas where price action could stall or reverse.
Why is BRENT moving today?
BRENT is moving today due to a combination of factors, including geopolitical tensions in the Middle East, positive economic data from major economies, and the strength of the U.S. dollar. These factors are influencing both the supply and demand dynamics of the oil market, leading to price volatility.
Technical Outlook Summary
| Indicator | Value | Signal |
|---|---|---|
| RSI (14) | 59.99 | Neutral |
| MACD Histogram | Positive | Bullish |
| Stochastic | 54.52 / 58.52 | Bearish |
| ADX | 28.64 | Strong Trend |
| Bollinger | Upper Band | Watch |
Key Levels
Support Levels
Resistance Levels
Track markets in real-time
AI-powered analysis, technical indicators and real-time price data.
Join Our Telegram Channel
Breaking market news, AI analysis and trading signals instantly.
Join Channel