
BRENT Trades Near Resistance at $112.53: Geopolitical Tensions and Technicals
BRENT oil is testing resistance around $112.53 amidst heightened geopolitical risks and shifting market sentiment. Analysis suggests a crucial juncture ahead.
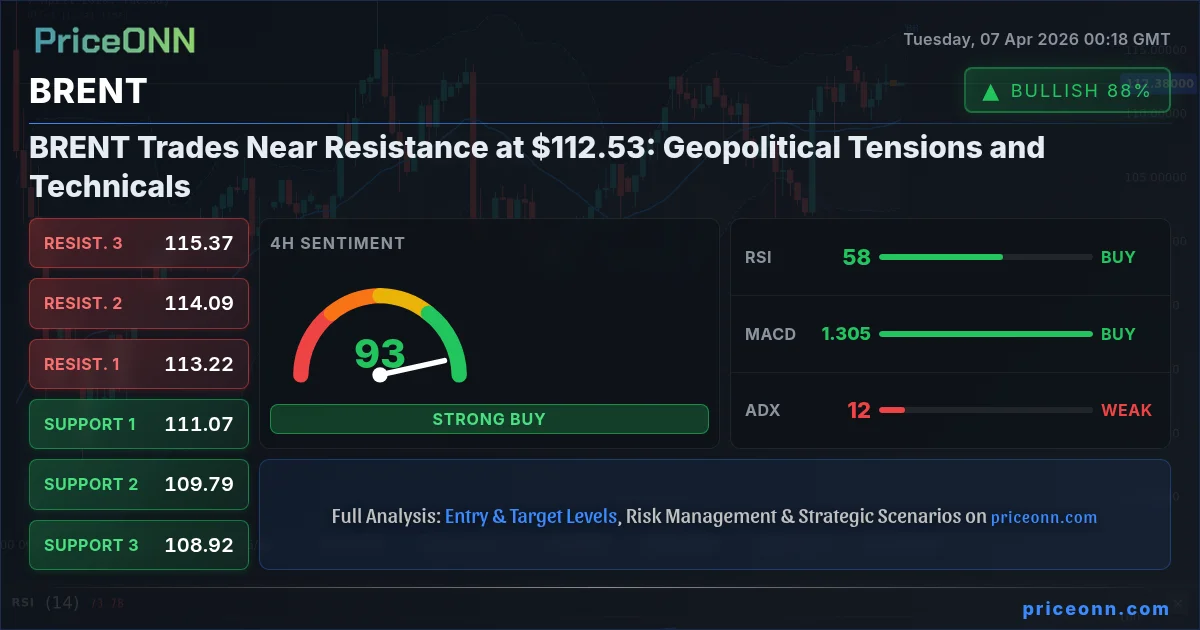
The global energy landscape is a complex tapestry woven with threads of geopolitical tension, macroeconomic shifts, and intricate technical patterns. Currently, BRENT crude oil finds itself at a critical juncture, hovering near the significant resistance level of $112.53. This price point is not just a number on a chart; it represents a confluence of factors that could dictate the commodity's short-to-medium term trajectory. As traders and analysts eye this level, the interplay between supply-side risks, global demand forecasts, and the ever-present specter of geopolitical instability demands a closer look. The question on everyone's mind is whether BRENT has the momentum to break through this barrier or if it will retreat, offering a clearer picture of the market's underlying sentiment.
- BRENT crude oil is consolidating near the $112.53 resistance level, a critical point for determining its next directional move.
- Geopolitical tensions, particularly concerning the Middle East, are providing underlying support but are also creating volatility, reflected in the ADX reading of 12.81 on the 1H chart.
- Technical indicators present a mixed picture: while RSI at 54.88 suggests room for upward movement, Stochastic's cross below its signal line indicates potential caution.
- The strong upward trend on the daily chart (ADX: 57.54) suggests bullish momentum remains dominant, but the immediate resistance at $112.53 poses a significant hurdle.
- Upcoming economic data and any escalation or de-escalation in geopolitical events will be key catalysts for BRENT's price action in the coming days.
The Macro Backdrop: Energy Security and Geopolitical Fault Lines
The energy markets, particularly crude oil like BRENT, are inherently sensitive to geopolitical developments. Recent news highlights lingering concerns surrounding Iran and the broader Middle East, a region that significantly influences global oil supply dynamics. Any perceived escalation or de-escalation in tensions can trigger sharp price movements, often overriding purely technical considerations. The announcement of suspicious oil trades preceding geopolitical news, as reported by various outlets, underscores the market's anticipation and reaction to such events. This inherent volatility means that fundamental drivers, especially those related to supply disruptions or perceived supply stability, are paramount. The current price of $112.53 for BRENT is therefore not just a function of supply and demand curves but also a reflection of the perceived risk premium embedded in the market due to ongoing global uncertainties. Traders are constantly weighing the probability of supply shocks against the actual physical flow of oil, creating a delicate balance that can shift with headlines.
Furthermore, the broader economic environment plays a crucial role. While specific economic calendar events are not detailed for today's immediate trading session in the provided data, the general health of the global economy, particularly major consumers like the US and China, dictates demand. Inflationary pressures, often exacerbated by high energy prices, also force central banks to maintain hawkish stances or adjust their monetary policy. This can, in turn, influence economic growth and, consequently, oil demand. The correlation between oil prices and inflation expectations is a well-established phenomenon. When oil prices rise significantly, they contribute to higher inflation, potentially leading to tighter monetary policies that could dampen economic activity and, by extension, oil demand. This creates a cyclical feedback loop that analysts must constantly monitor.
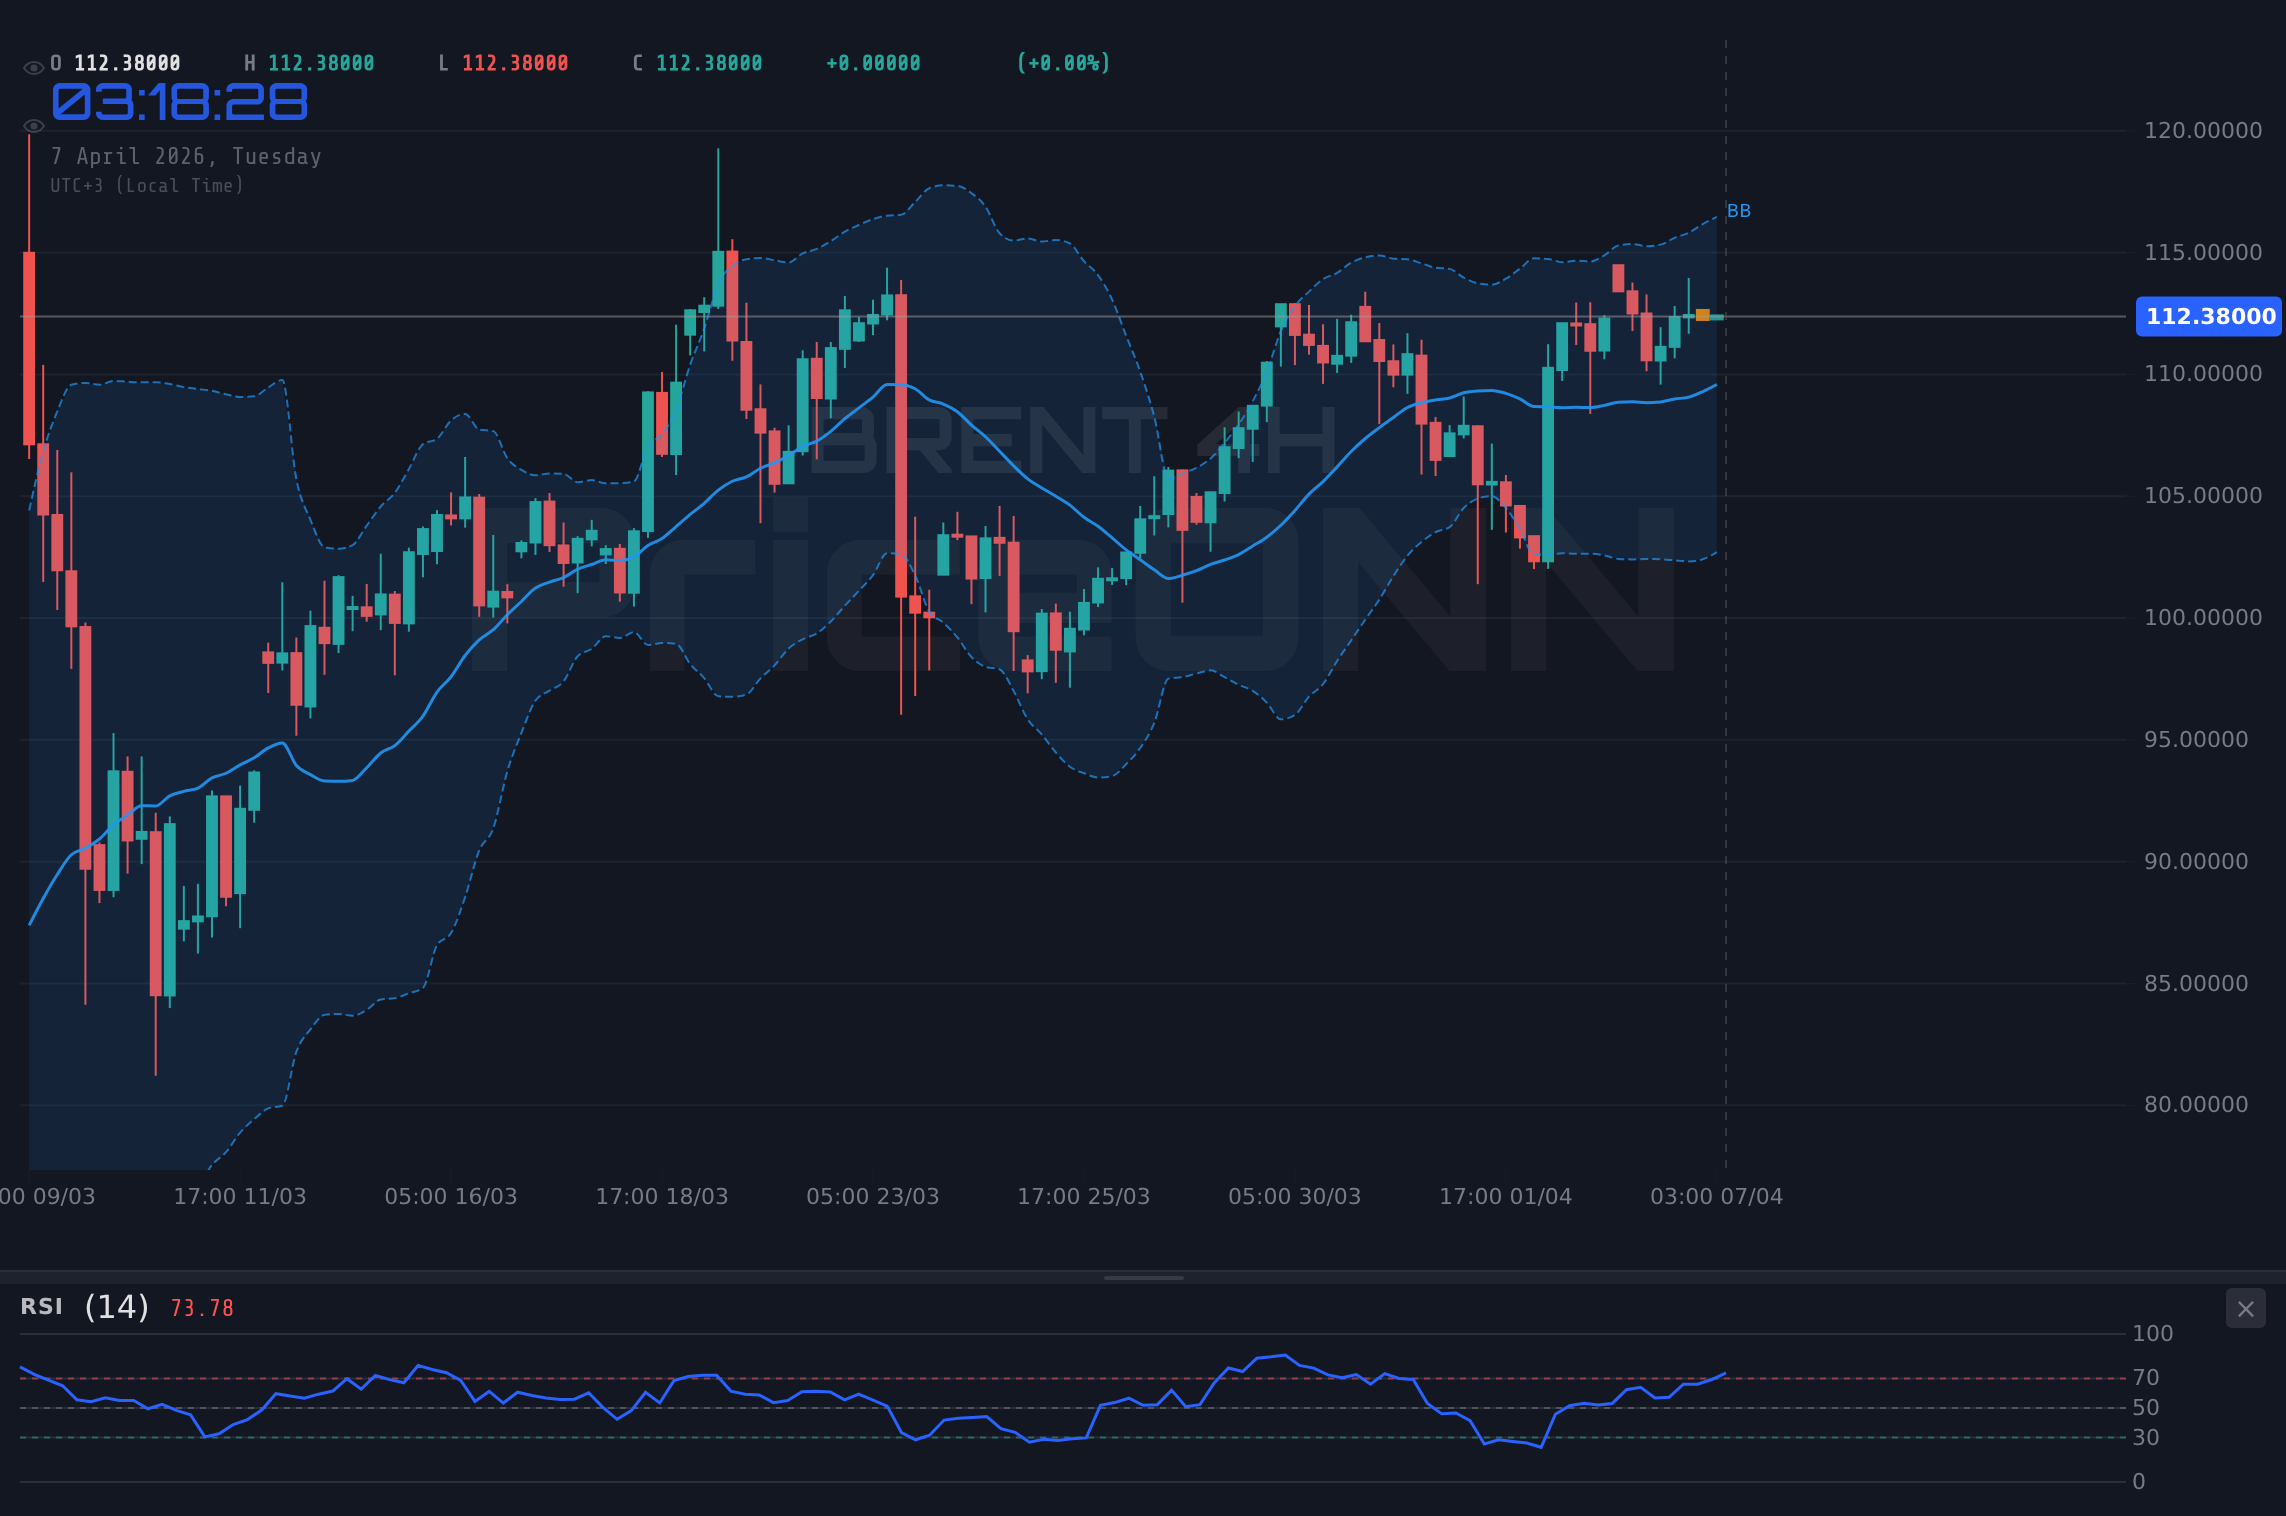
Technical Picture: A Standoff at the Resistance Level
On the technical front, BRENT's current position around $112.53 is particularly interesting. The 1-hour chart shows a neutral trend with a strong ADX of 12.81, indicating a lack of a committed trend in the very short term, despite the overall bullish sentiment seen on longer timeframes. However, the RSI at 54.88 suggests there's still some room for upward momentum before entering overbought territory. The Stochastic indicator, with K at 56.27 and D at 73.4, shows a bearish signal as the %K line has crossed below the %D line, hinting at potential profit-taking or a short-term pullback. This internal conflict within the indicators on the 1H chart mirrors the broader market's indecision as it approaches a key resistance level.
Zooming out to the 4-hour timeframe, the picture remains predominantly bullish. The ADX at 12.38 still indicates a weak trend on this timeframe, but the RSI at 58.51 leans towards upward movement. The Stochastic shows a bearish cross (%K below %D), but the values (K=68.72, D=78.93) are in the upper range, suggesting that while a pullback might be imminent, the overall strength hasn't completely evaporated. The Bollinger Bands on this timeframe are positioned around the mid-band, suggesting consolidation. The fact that the 4H chart shows a generally bullish signal (Al: 7, Sat: 1, Nötr: 0) contrasts with the immediate 1H signals, highlighting the intraday choppiness traders might experience.
The daily chart, however, paints a more robustly bullish picture, which is crucial for understanding the dominant trend. With an ADX of 57.54, the trend is described as 'Very strong upward trend.' The RSI at 65.21 is in the upper range of neutral territory, indicating bullish momentum without being excessively overbought. The Stochastic indicator is showing a bullish signal (%K > %D) with K=72.39 and D=55.76, reinforcing the upward bias. The Bollinger Bands are above the middle band, and the overall signal for the daily timeframe is BUY (Al: 7, Sat: 1, Nötr: 0). This strong daily trend suggests that any pullback from the $112.53 resistance might be a temporary pause rather than a reversal, especially if the underlying fundamental drivers remain supportive.
Correlation Analysis: DXY, Equities, and the Oil Price Dance
Understanding BRENT's price action requires looking beyond its own charts and considering its correlations with other major markets. The US Dollar Index (DXY) is a key player. Currently, DXY is trading around 99.77, showing a slight increase. Historically, a strengthening dollar often puts downward pressure on dollar-denominated commodities like oil, as they become more expensive for holders of other currencies. However, the current daily trend for DXY is also classified as 'Upward (Strength: 95%)', with an ADX of 29.76. This suggests the dollar itself is in a strong uptrend. If the dollar continues to strengthen, it could act as a headwind for BRENT, potentially capping any upside move beyond $112.53.
Equity markets, represented by the SP500 and Nasdaq100, are also important indicators of risk appetite. The SP500 is showing a strong upward move, trading at 6572.87, with a daily trend classified as 'Downward (Strength: 100%)' yet showing a 0.74% daily gain. This contradictory data point highlights the complexity; the daily trend might be classified as downward from a longer-term perspective, but short-term momentum is clearly bullish. Similarly, the Nasdaq100 is also trading higher. Generally, a rising tide in equities indicates increased risk appetite, which can be supportive of commodities like oil as investors seek growth assets. However, if this rally in equities is perceived as unsustainable or if inflation concerns resurface, a sell-off in stocks could spill over into commodities, driving oil prices lower.
The relationship between oil prices and inflation is cyclical. High oil prices contribute to inflation, prompting central banks to tighten monetary policy, which can then curb economic growth and reduce oil demand. This dynamic is crucial. If inflation fears are reignited, potentially driven by persistent high energy costs, central banks might be forced to adopt a more aggressive stance than currently anticipated. This could lead to higher interest rates, a stronger dollar, and potentially slower global growth, all of which are bearish for BRENT. Conversely, if inflation shows signs of cooling, central banks might gain room to ease policy, potentially supporting economic growth and oil demand.
Geopolitical Wildcards: The Iran Factor and Supply Disruptions
The geopolitical situation, particularly concerning Iran and its implications for Middle East stability, remains a significant wildcard for BRENT prices. Reports of unusual trading activity preceding geopolitical announcements suggest that market participants are highly attuned to any news that could impact oil supply. A conflict or increased sanctions involving Iran could disrupt crude oil shipments from the Persian Gulf, a vital chokepoint for global energy trade. Such an event would likely trigger a 'risk-on' rally in oil prices, pushing BRENT well above the current $112.53 resistance. The market's reaction function to such news is often swift and dramatic, driven by fears of supply scarcity.
Conversely, any signs of de-escalation or diplomatic progress could lead to a reduction in the geopolitical risk premium currently priced into oil. This could see BRENT prices ease back, potentially testing the support levels identified around $111.68 and $111.04. The market's sensitivity to these geopolitical events means that traders must remain vigilant, monitoring news flow closely. The presence of a strong daily trend (ADX 57.54) indicates that the market is already leaning bullish, making it more susceptible to sharp moves on any supply-side news. The 'Very strong upward trend' on the daily chart suggests that the market is pricing in a higher probability of continued supply tightness or demand strength, and any negative geopolitical news could exacerbate this.
Economic Calendar Watch: What's Next for BRENT?
While today's economic calendar data in the provided snippet is sparse on specifics, upcoming high-impact events are crucial for setting the tone. The market will be closely watching any data related to inflation (CPI, PCE), employment (NFP), and economic growth (GDP, PMI) from major economies like the US and Europe. Stronger-than-expected economic data could signal robust demand, supporting oil prices. Conversely, weaker data might raise concerns about a potential economic slowdown, putting pressure on BRENT. The interplay between inflation and central bank policy is also key. If inflation remains sticky, forcing central banks like the Federal Reserve to maintain higher interest rates for longer, this could dampen economic activity and thus oil demand.
The Federal Reserve's stance on interest rates is particularly influential. Market expectations regarding Fed policy, often reflected in Fed Fund Futures and OIS pricing, can significantly impact the dollar and, by extension, oil prices. If the Fed signals a more hawkish path, it could strengthen the dollar and weigh on BRENT. Conversely, any hint of a dovish pivot or a pause in rate hikes could support risk assets, including oil. Understanding these macro drivers is essential for a complete analysis of BRENT's price action beyond the immediate technical levels. The current strong daily trend suggests that the market might be anticipating supportive fundamental factors, but any negative surprises from economic data or a shift in central bank rhetoric could quickly alter the outlook.
The $112.53 resistance level is a critical area for BRENT. While the longer-term trend remains bullish, intraday indicators show some caution. Traders should watch for confirmation of a breakout above $112.53, ideally with increasing volume and sustained price action above this level. Conversely, a failure to break through and a subsequent close below $112.00 could signal a near-term pullback towards the $111.68 support.
Scenario Analysis: Navigating the $112.53 Resistance
Bullish Scenario: Breaking the Barrier
65% ProbabilityNeutral Scenario: Consolidation Phase
25% ProbabilityBearish Scenario: Resistance Holds Firm
10% ProbabilityFrequently Asked Questions: BRENT Analysis
What happens if BRENT breaks above the $112.96 resistance level?
A sustained break above $112.96, confirmed by increased volume, would invalidate the immediate resistance and could propel BRENT towards the $113.60 (R2) target. This scenario would likely be driven by positive geopolitical news or strong demand signals.
Should I trade BRENT at current levels around $112.53 given the mixed signals?
Trading BRENT at $112.53 requires caution due to the confluence of strong daily bullish trends and intraday bearish signals. A high-probability setup would involve waiting for a clear breakout above resistance or a confirmed retest of support levels like $111.68.
Is the RSI at 65.21 on the daily chart a sell signal for BRENT?
An RSI of 65.21 on the daily chart is considered strong bullish momentum, not an immediate sell signal. While it's in the upper range, it's not yet in the extreme overbought territory (typically above 70-75) that would strongly suggest a reversal. It indicates upward pressure is present.
How will upcoming economic data affect BRENT's price action near $112.53?
Upcoming economic data releases, especially those related to inflation and growth, will be critical. Stronger data could reinforce demand expectations, potentially pushing BRENT above $112.53. Weaker data might raise recession fears, leading to a pullback towards support levels as risk appetite wanes.
| Indicator | Value | Signal | Interpretation |
|---|---|---|---|
| RSI (14) | 65.21 | Neutral | Upper range, strong momentum |
| MACD Histogram | Positive | Bullish | Momentum improving |
| Stochastic | K:72.39, D:55.76 | Bullish | Bullish crossover in upper range |
| ADX | 57.54 | Strong Trend | Very strong upward trend |
| Bollinger Bands | Above Mid | Bullish | Price above middle band |
Track markets in real-time
AI-powered analysis, technical indicators and real-time price data.
Join Our Telegram Channel
Breaking market news, AI analysis and trading signals instantly.
Join Channel