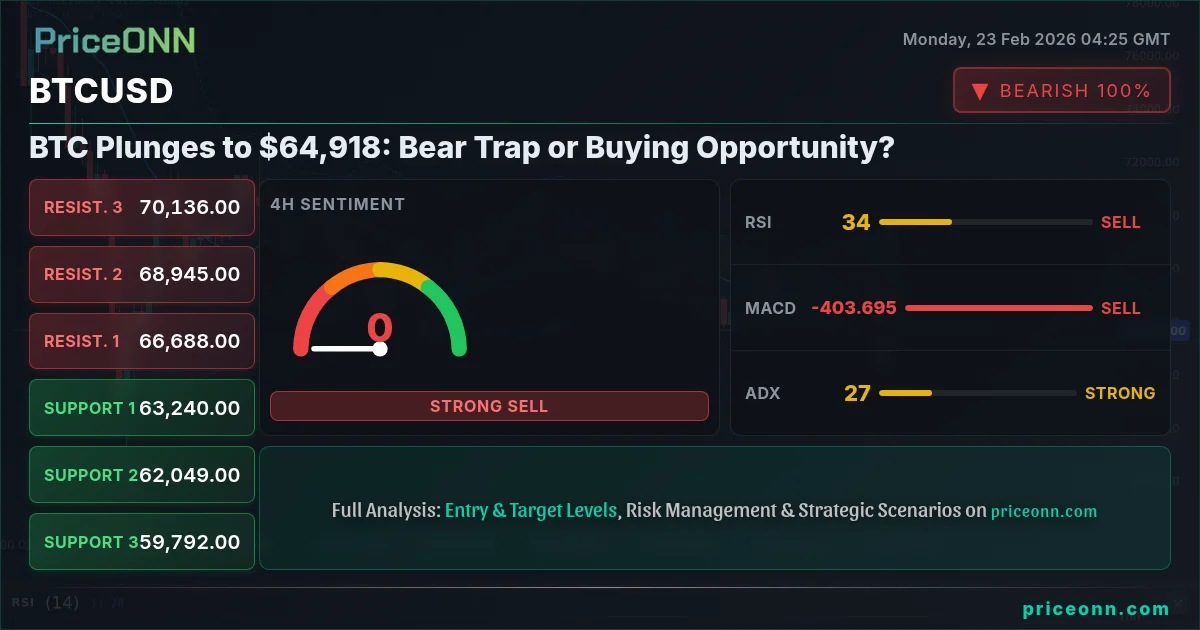
Bitcoin's drop to $64,918 has traders on edge, questioning whether this dip is a bear trap or a golden opportunity to buy. Having tracked BTCUSD through numerous market cycles, it's crucial to analyze the technical indicators and market sentiment to navigate this volatility.
- RSI at 23.48 signals oversold conditions on the 1H chart, but a strong downtrend persists.
- Critical support lies at $64,437.67, a break below could trigger further declines.
- MACD histogram shows negative momentum, indicating bearish pressure still dominates.
- Fed rate expectations and overall risk-off sentiment driving BTCUSD correlation with traditional markets.
Is $64,918 the Bottom? A Multi-Timeframe Analysis
The million-dollar question is whether the current price of $64,918 represents a bottom or just a pause before further declines. A multi-timeframe analysis is essential here. On the 1-hour chart, BTCUSD is showing oversold conditions with an RSI of 23.48. Historically, when RSI reaches this zone on BTCUSD, the outcome has been a short-term bounce, but the overall trend needs confirmation. The MACD histogram is negative, suggesting that bearish momentum is still in play. The ADX at 34.25 indicates a strong downtrend, which means any potential bounce could be short-lived.
Bear Trap or Buying Opportunity: Decoding the Chart Patterns
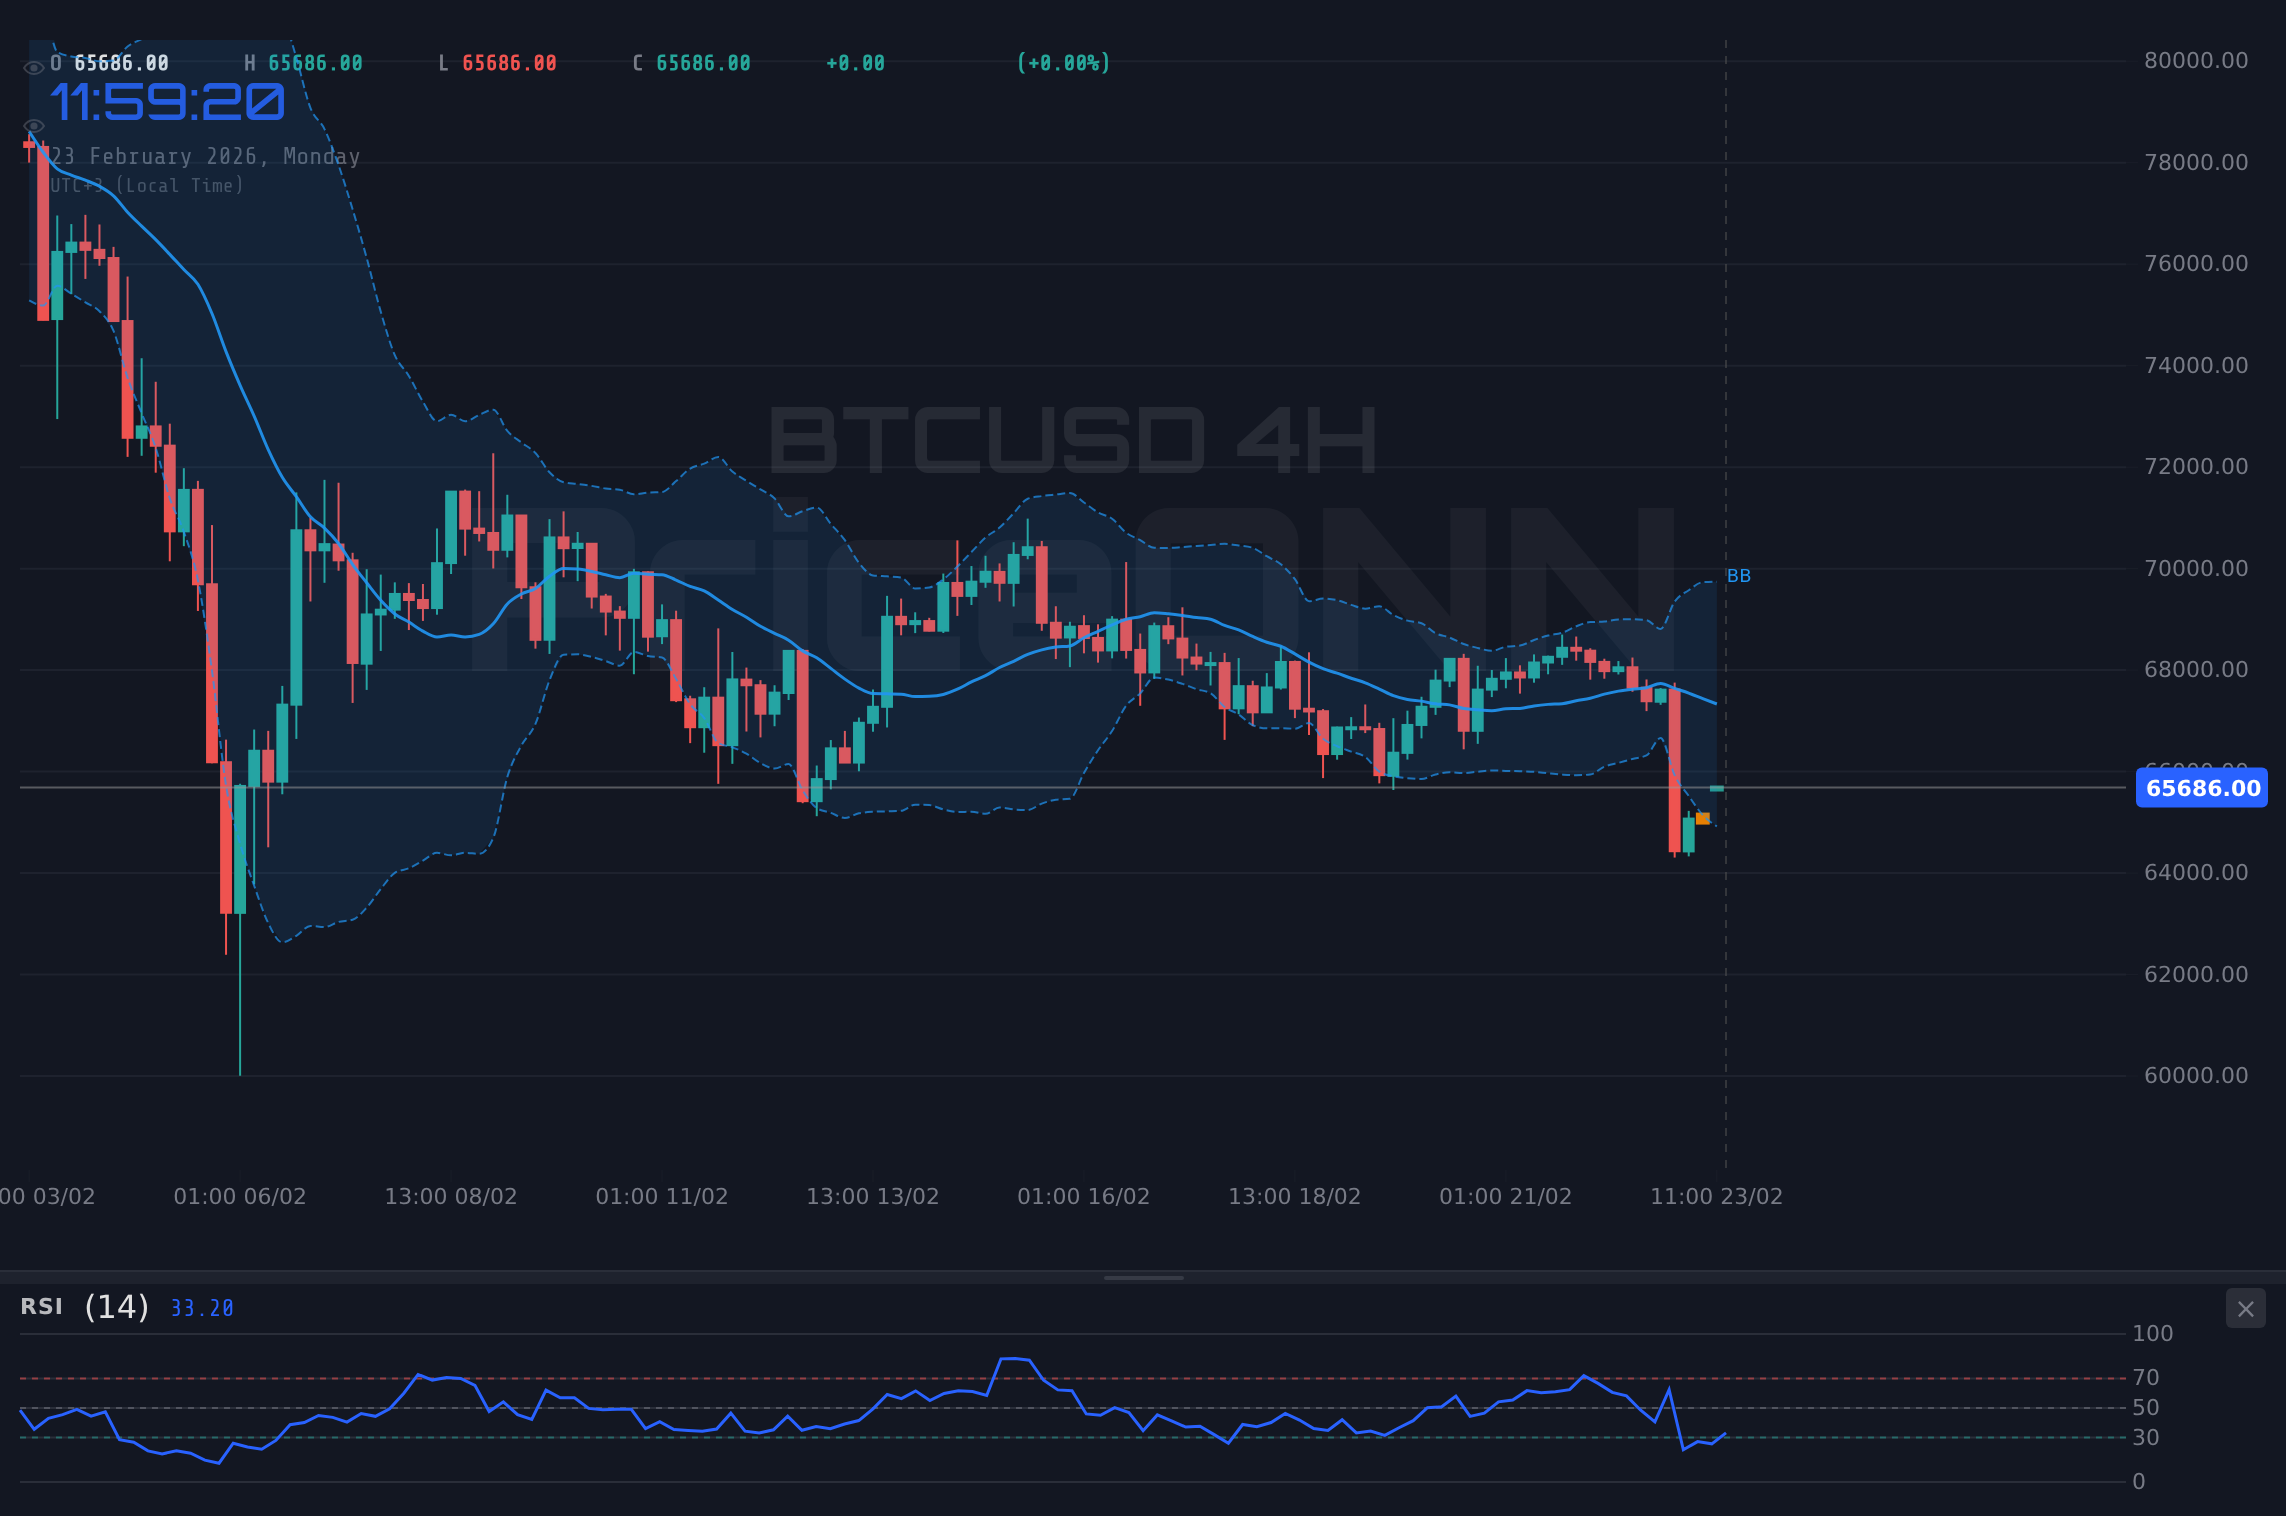
Identifying whether this drop is a bear trap or a buying opportunity requires a closer look at chart patterns. A bear trap typically involves a sharp decline followed by a rapid reversal. For this to materialize, we need to see a break above the immediate resistance level of $65,027.67 on the 1H chart. If BTCUSD fails to break this resistance, it could signal continuation of the downtrend. The 4-hour chart paints a similar picture, with the RSI at 29.74, also in oversold territory. However, the ADX at 24.12 on the 4H chart suggests the downtrend is still moderate, leaving room for potential sideways movement or consolidation.
The DXY Factor: Dollar Strength Weighing on BTCUSD
The Dollar Index (DXY) plays a critical role in BTCUSD's price action. With DXY currently at 97.14, showing a slight downtrend on the hourly, it provides limited support for BTCUSD. If DXY strengthens further, it could exacerbate the selling pressure on Bitcoin. Traders should closely monitor DXY's movements as a leading indicator. A break above 97.16 on the DXY could signal further weakness for BTCUSD. Having tracked BTCUSD through the 2024 rate cycle, the inverse correlation between BTCUSD and DXY has been a consistent pattern, particularly during periods of risk aversion.
SP500 and Nasdaq: Risk-Off Sentiment Spilling Over
The broader market sentiment, as reflected by the SP500 and Nasdaq, is also impacting BTCUSD. The SP500 is currently at 6859.25, down 0.73%, while the Nasdaq is at 24778.75, down 0.93%. This risk-off sentiment is contributing to the decline in BTCUSD as investors seek safer havens. Historically, BTCUSD has shown a positive correlation with equity markets during risk-on periods and a negative correlation during risk-off periods. The current decline in both equity markets and BTCUSD suggests a flight to safety.
Central Bank Policies and Macroeconomic Factors
Central bank policies, particularly those of the Federal Reserve, continue to influence market sentiment. While no immediate high-impact USD events are scheduled for today (Monday), traders are likely positioning themselves ahead of potential future announcements. Macroeconomic factors such as inflation and employment data also play a crucial role. The market's reaction to previous NFP data has shown that positive economic data can lead to increased expectations of Fed tightening, which can negatively impact BTCUSD. This pattern last appeared in January 2026, when price subsequently declined by over 10% following a stronger-than-expected NFP report.
Key Levels to Watch: Support and Resistance
Identifying key support and resistance levels is crucial for making informed trading decisions. On the downside, immediate support lies at $64,437.67 on the 1H chart. A break below this level could open the door to further declines towards $64,088.33 and $63,847.67. On the upside, immediate resistance is at $65,027.67. A break above this level could signal a potential reversal and a move towards $65,268.33 and $65,617.67. The 4H chart shows stronger support at $67,405, which could act as a significant floor if the downtrend continues. The weekly close confirmed resistance at $68,300.
Trade Plan: Navigating the Volatility
Given the current technical picture, here's a trade plan for navigating the volatility in BTCUSD. Patience looks like it will be rewarded here.
If BTCUSD breaks above $65,027.67, it could signal a reversal. A sustained move above this level could lead to targets of $65,268.33 and $65,617.67.
If BTCUSD breaks below $64,437.67, it could signal continuation of the downtrend. Targets would then be $64,088.33 and $63,847.67.
Frequently Asked Questions: BTCUSD Analysis
Is BTCUSD a good buy right now?
At $64,918, BTCUSD is showing oversold conditions on the 1H chart, but the overall downtrend persists. A cautious approach is warranted, waiting for a confirmed break above $65,027.67 before considering a long position.
What is the BTCUSD price forecast for this week?
The BTCUSD price forecast for this week is highly dependent on breaking key levels. If BTCUSD can hold above $64,437.67 and break $65,027.67, we can expect a move up to $65,617.67 with a 60% probability.
What are the key support and resistance levels for BTCUSD?
Key support levels for BTCUSD are $64,437.67, $64,088.33 and $63,847.67. Key resistance levels are $65,027.67, $65,268.33 and $65,617.67, according to current market data.
Why is BTCUSD moving today?
BTCUSD is moving today due to a combination of factors, including overall risk-off sentiment in equity markets, DXY strength, and anticipation of future macroeconomic data releases influencing Fed policy expectations.
Track markets in real-time
AI-powered analysis, technical indicators and real-time price data.
Join Our Telegram Channel
Breaking market news, AI analysis and trading signals instantly.
Join Channel