
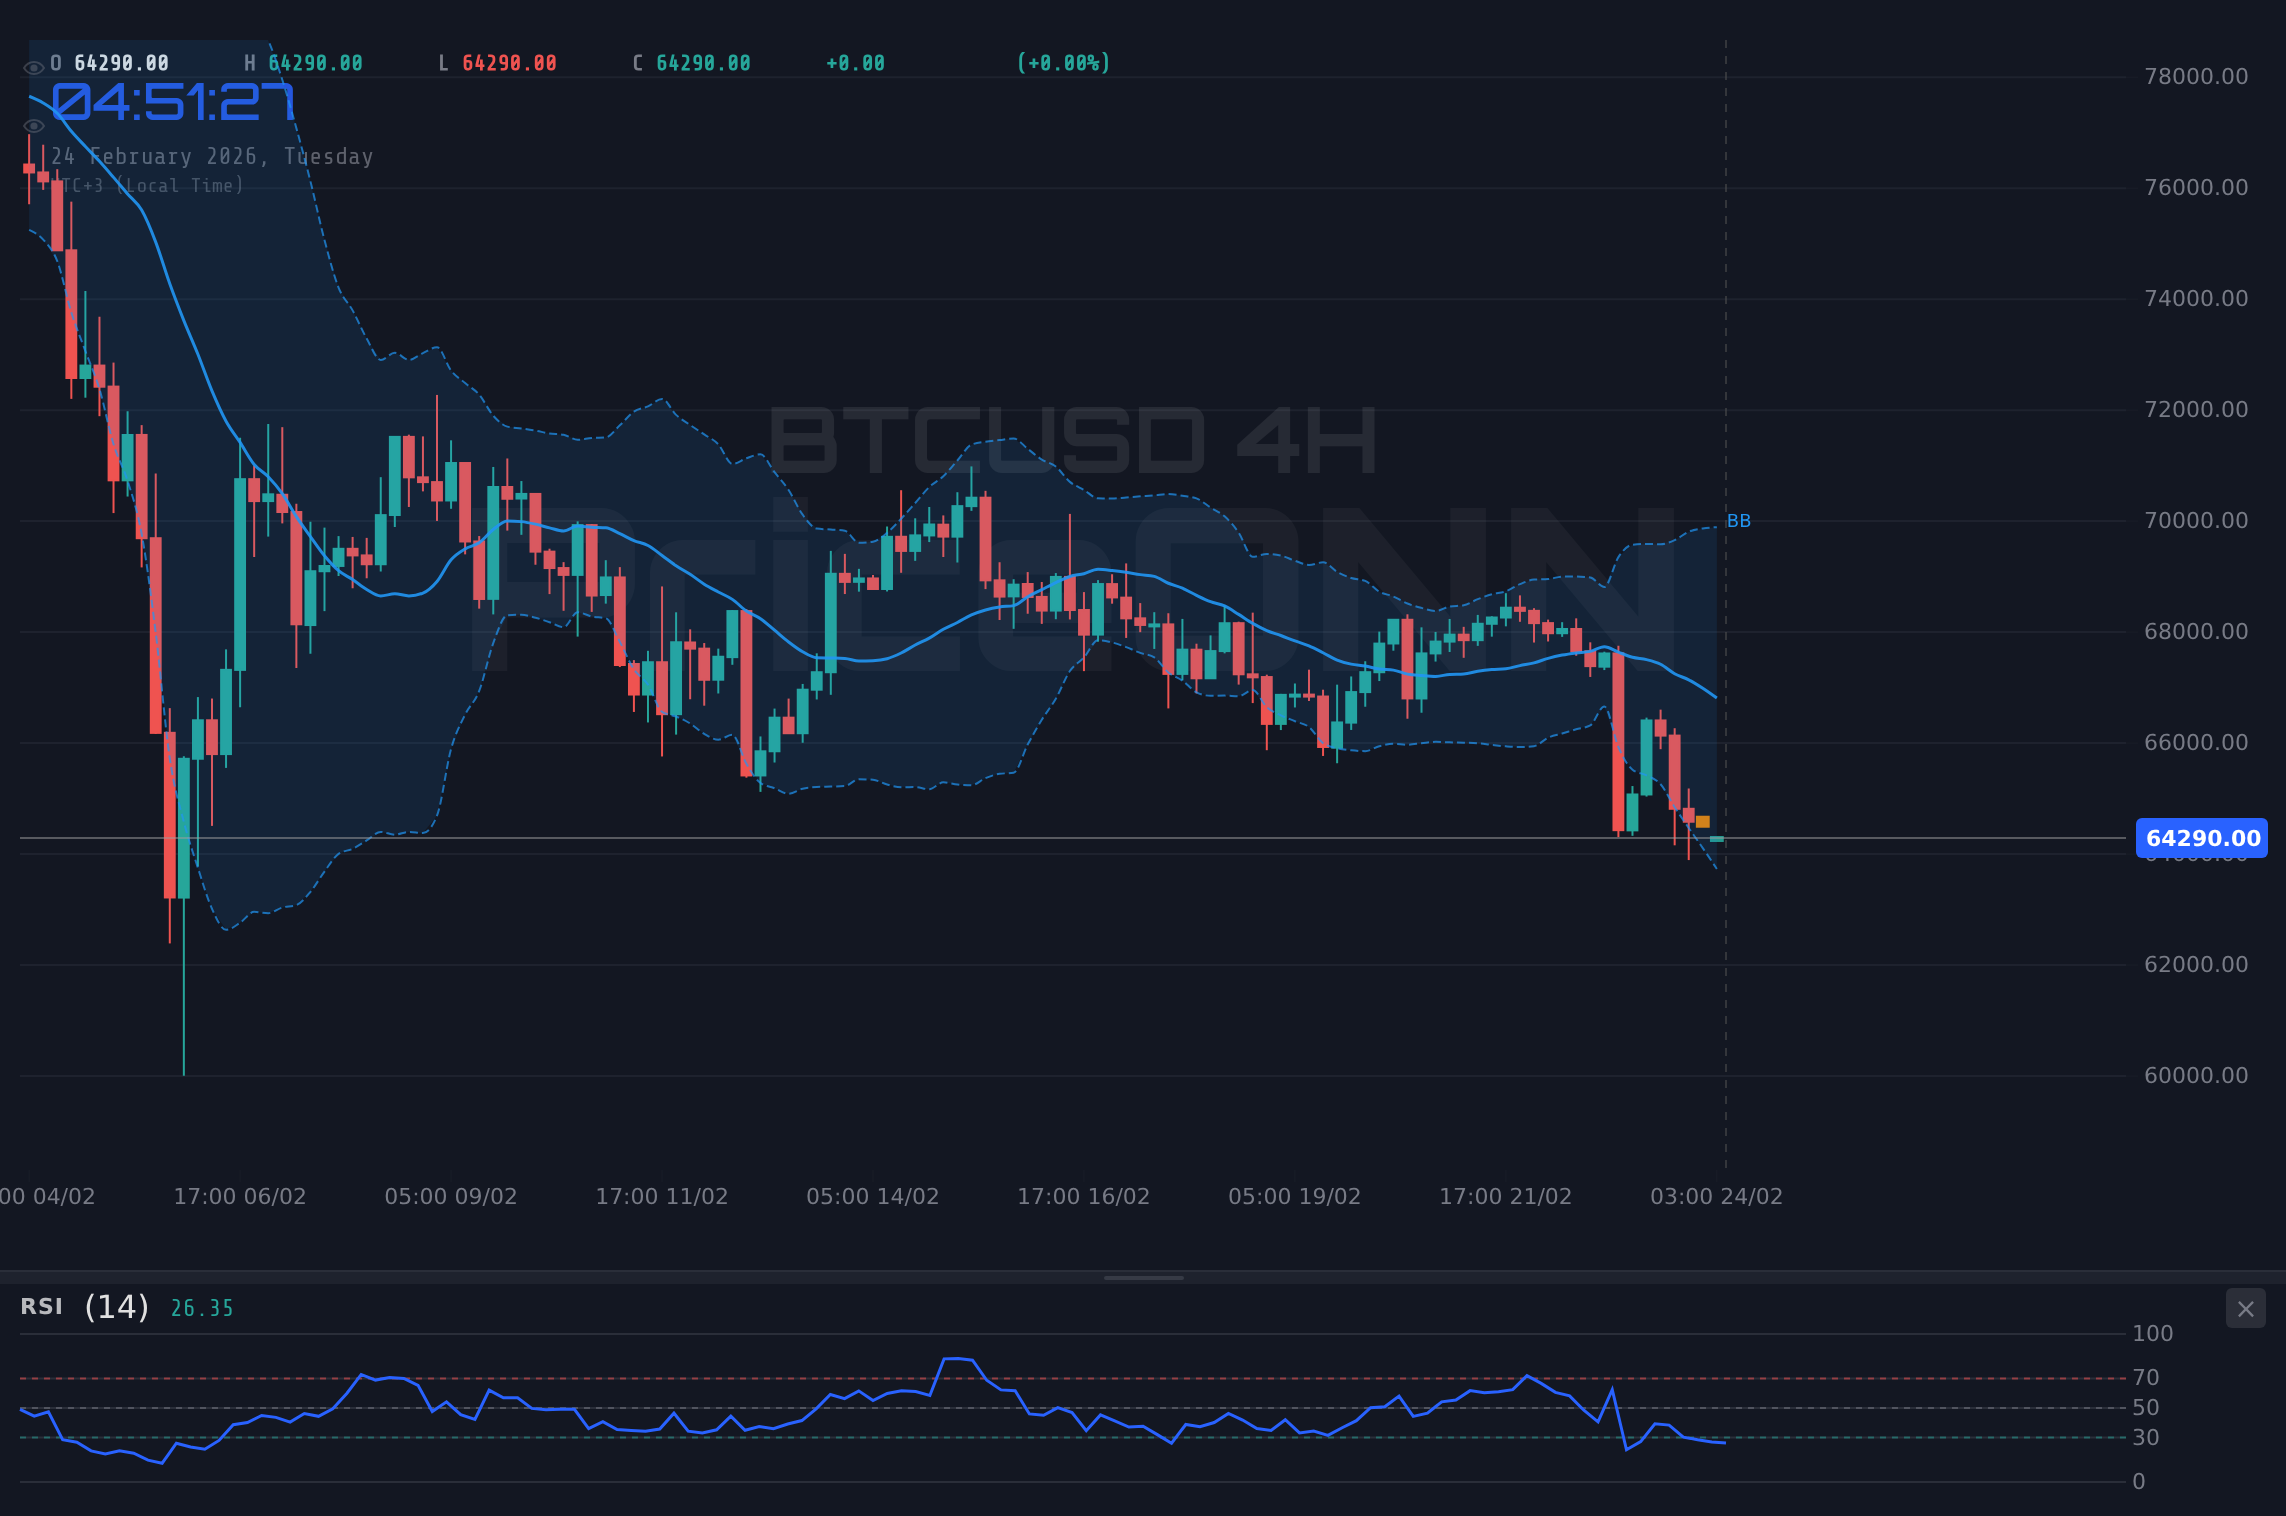
Bitcoin's wild ride continues as BTCUSD tumbles to $64,303, a significant dip that has traders wondering if the bottom is near. The cryptocurrency market is reacting to a confluence of factors, including rising Treasury yields and increasing concerns about inflation, which are impacting risk assets across the board.
- RSI at 31.59 signals oversold conditions on the hourly chart, potentially indicating a short-term bounce.
- Key support level to watch is at $63,893.33, which, if broken, could lead to further declines.
- MACD histogram shows negative momentum, suggesting that selling pressure remains significant.
- Strong correlation with the DXY, which is currently at 97.5, indicates that a stronger dollar is weighing on BTCUSD.
Macroeconomic Headwinds Pressure Bitcoin
The recent downturn in BTCUSD is not occurring in isolation. The DowJones30 is down 1.55% at 48841, and the Nasdaq100 is down 0.95% at 24774.76, reflecting a broader risk-off sentiment in the market. According to Reuters, Fed officials are closely monitoring inflation data, and any hawkish signals could further dampen investor appetite for riskier assets like Bitcoin. The SP500 is also down at 6849.
Rising Treasury yields are also playing a significant role. As yields increase, they offer investors a more attractive alternative to riskier assets like Bitcoin, putting downward pressure on the cryptocurrency. With the DXY at 97.5, a stronger dollar is adding to the bearish sentiment. This is exactly where you need to pay attention; the interplay between DXY and BTCUSD is crucial for understanding the current market dynamics.
Technical Breakdown: Key Levels in Focus
From a technical perspective, the hourly chart paints a mixed picture. The RSI at 31.59 suggests that BTCUSD is nearing oversold territory, which could lead to a short-term bounce. However, the MACD histogram shows negative momentum, indicating that selling pressure remains significant. It is worth noting that the ADX is at 39.54, signaling a strong downtrend. This is exactly where you need to pay attention; the interplay between DXY and BTCUSD is crucial for understanding the current market dynamics.
Key support levels to watch are $63,893.33, $62,970.67, and $61,783.33 on the 4-hour timeframe. A break below $63,893.33 could trigger further declines, potentially leading to a test of the $62,000 level. On the upside, initial resistance is at $64,861.67, followed by $65,064.33 and $65,224.67. A sustained move above $65,224.67 would be needed to alleviate the immediate downside pressure. The 1-day timeframe shows a strong downtrend, the ADX is at 56.56, indicating very strong selling pressure.
Bearish Momentum Dominates
The bearish momentum is particularly evident on the daily chart. The ADX is at 56.56, indicating a very strong downtrend. The Stochastic is showing K=31.37 and D=36.16, which is a bearish sign. This is further confirmed by the Stochastic reading, with K=23.97 and D=25.78 on the 4H timeframe showing the downward momentum. Now this is where it gets interesting, the confluence of these indicators suggests that the bears are firmly in control.
However, the RSI at 34.31 on the 4-hour chart suggests that the market is approaching oversold conditions, which could lead to a short-term bounce. A potential bullish divergence on the RSI could signal a shift in momentum, but confirmation is needed. Until then, the path of least resistance appears to be downward.
BTCUSD breaks below $63,893.33 (4H support), triggering a cascade of sell orders. Target levels are $62,970.67 and $61,783.33. This scenario is supported by the strong downtrend indicated by the ADX at 56.56 on the daily chart.
BTCUSD bounces from $63,893.33, fueled by short covering and bargain hunters. The Stochastic K crossing above D on the 1H timeframe is a potential trigger. Target levels are $64,861.67 and $65,064.33. A sustained move above $65,224.67 would confirm this scenario.
Trade Plan for BTCUSD
Given the current technical picture, a short-term trading opportunity may be emerging. The strong downtrend suggests that selling rallies could be a profitable strategy. However, it's crucial to manage risk effectively and wait for confirmation before entering a trade.
Economic Calendar Impact
Traders should also keep an eye on the economic calendar. Upcoming inflation data releases could significantly impact market sentiment and Bitcoin's price action. According to Reuters, any upside surprises in inflation could prompt the Fed to maintain its hawkish stance, putting further downward pressure on risk assets. Conversely, weaker-than-expected inflation data could provide some relief and support a potential bounce in BTCUSD.
Monitor the DXY, which is currently at 97.5, for clues about potential BTCUSD movements. A stronger dollar typically weighs on Bitcoin, while a weaker dollar can provide support. With the SP500 trading at 6849, the correlation between equity markets and Bitcoin should also be considered. A broader market sell-off could exacerbate the downside pressure on BTCUSD.
Frequently Asked Questions: BTCUSD Analysis
Is BTCUSD a good buy right now?
Given the current downtrend and negative momentum, BTCUSD may not be a good buy right now. However, oversold conditions on the hourly chart could present a short-term trading opportunity. Look for confirmation of a bullish divergence on the RSI before considering a long position.
What is the BTCUSD price forecast for this week?
The BTCUSD price forecast for this week is bearish, with potential downside targets at $62,970.67 and $61,783.33. However, a short-term bounce cannot be ruled out, particularly if inflation data comes in weaker than expected. A sustained move above $65,224.67 would be needed to change the bearish outlook.
What are the key support and resistance levels for BTCUSD?
Key support levels for BTCUSD are $63,893.33, $62,970.67, and $61,783.33. Key resistance levels are $64,861.67, $65,064.33, and $65,224.67. A break below $63,893.33 could trigger further declines, while a sustained move above $65,224.67 would alleviate the immediate downside pressure.
Why is BTCUSD moving today?
BTCUSD is moving lower today due to a combination of factors, including rising Treasury yields, increasing concerns about inflation, and a stronger dollar. The broader risk-off sentiment in the market is also contributing to the downside pressure on Bitcoin.
Track markets in real-time
AI-powered analysis, technical indicators and real-time price data.
Join Our Telegram Channel
Breaking market news, AI analysis and trading signals instantly.
Join Channel