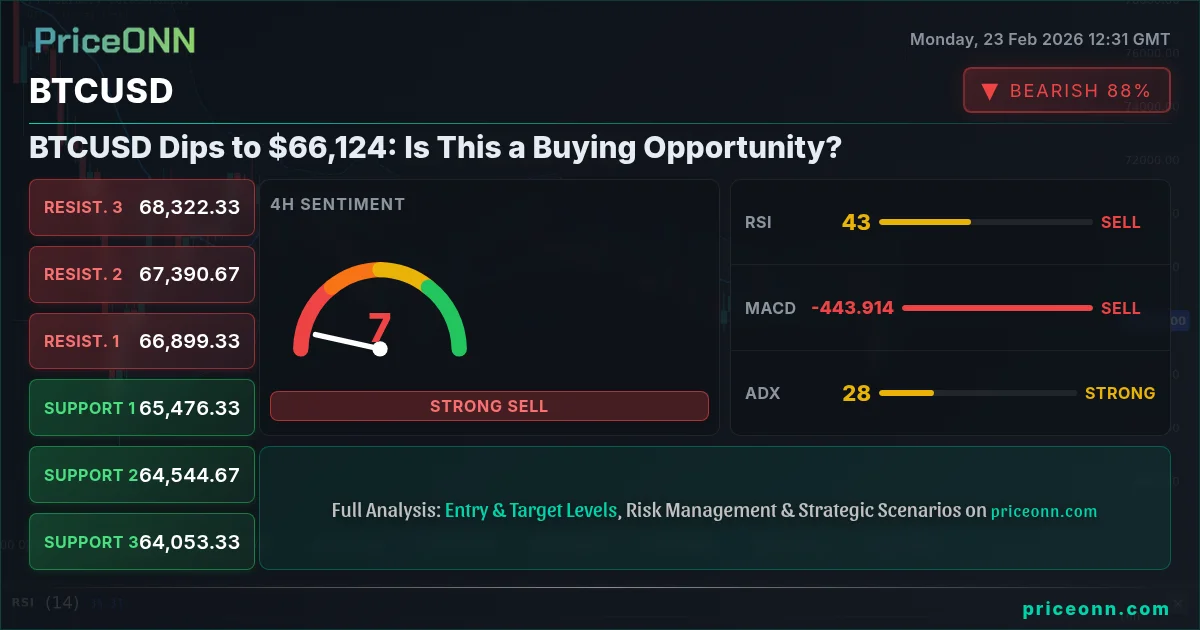
BTCUSD's recent dip to $66,124 has traders wondering if this is a temporary pullback or the start of a deeper correction. Amidst a backdrop of rising DXY and declining equity indices, the cryptocurrency faces a critical test of its near-term bullish momentum. The key question is whether dip-buyers will step in to defend current levels.
- BTCUSD currently trades at $66,124 amidst a risk-off market environment.
- Key support level to watch sits at $64,526.67, a break below could signal further downside.
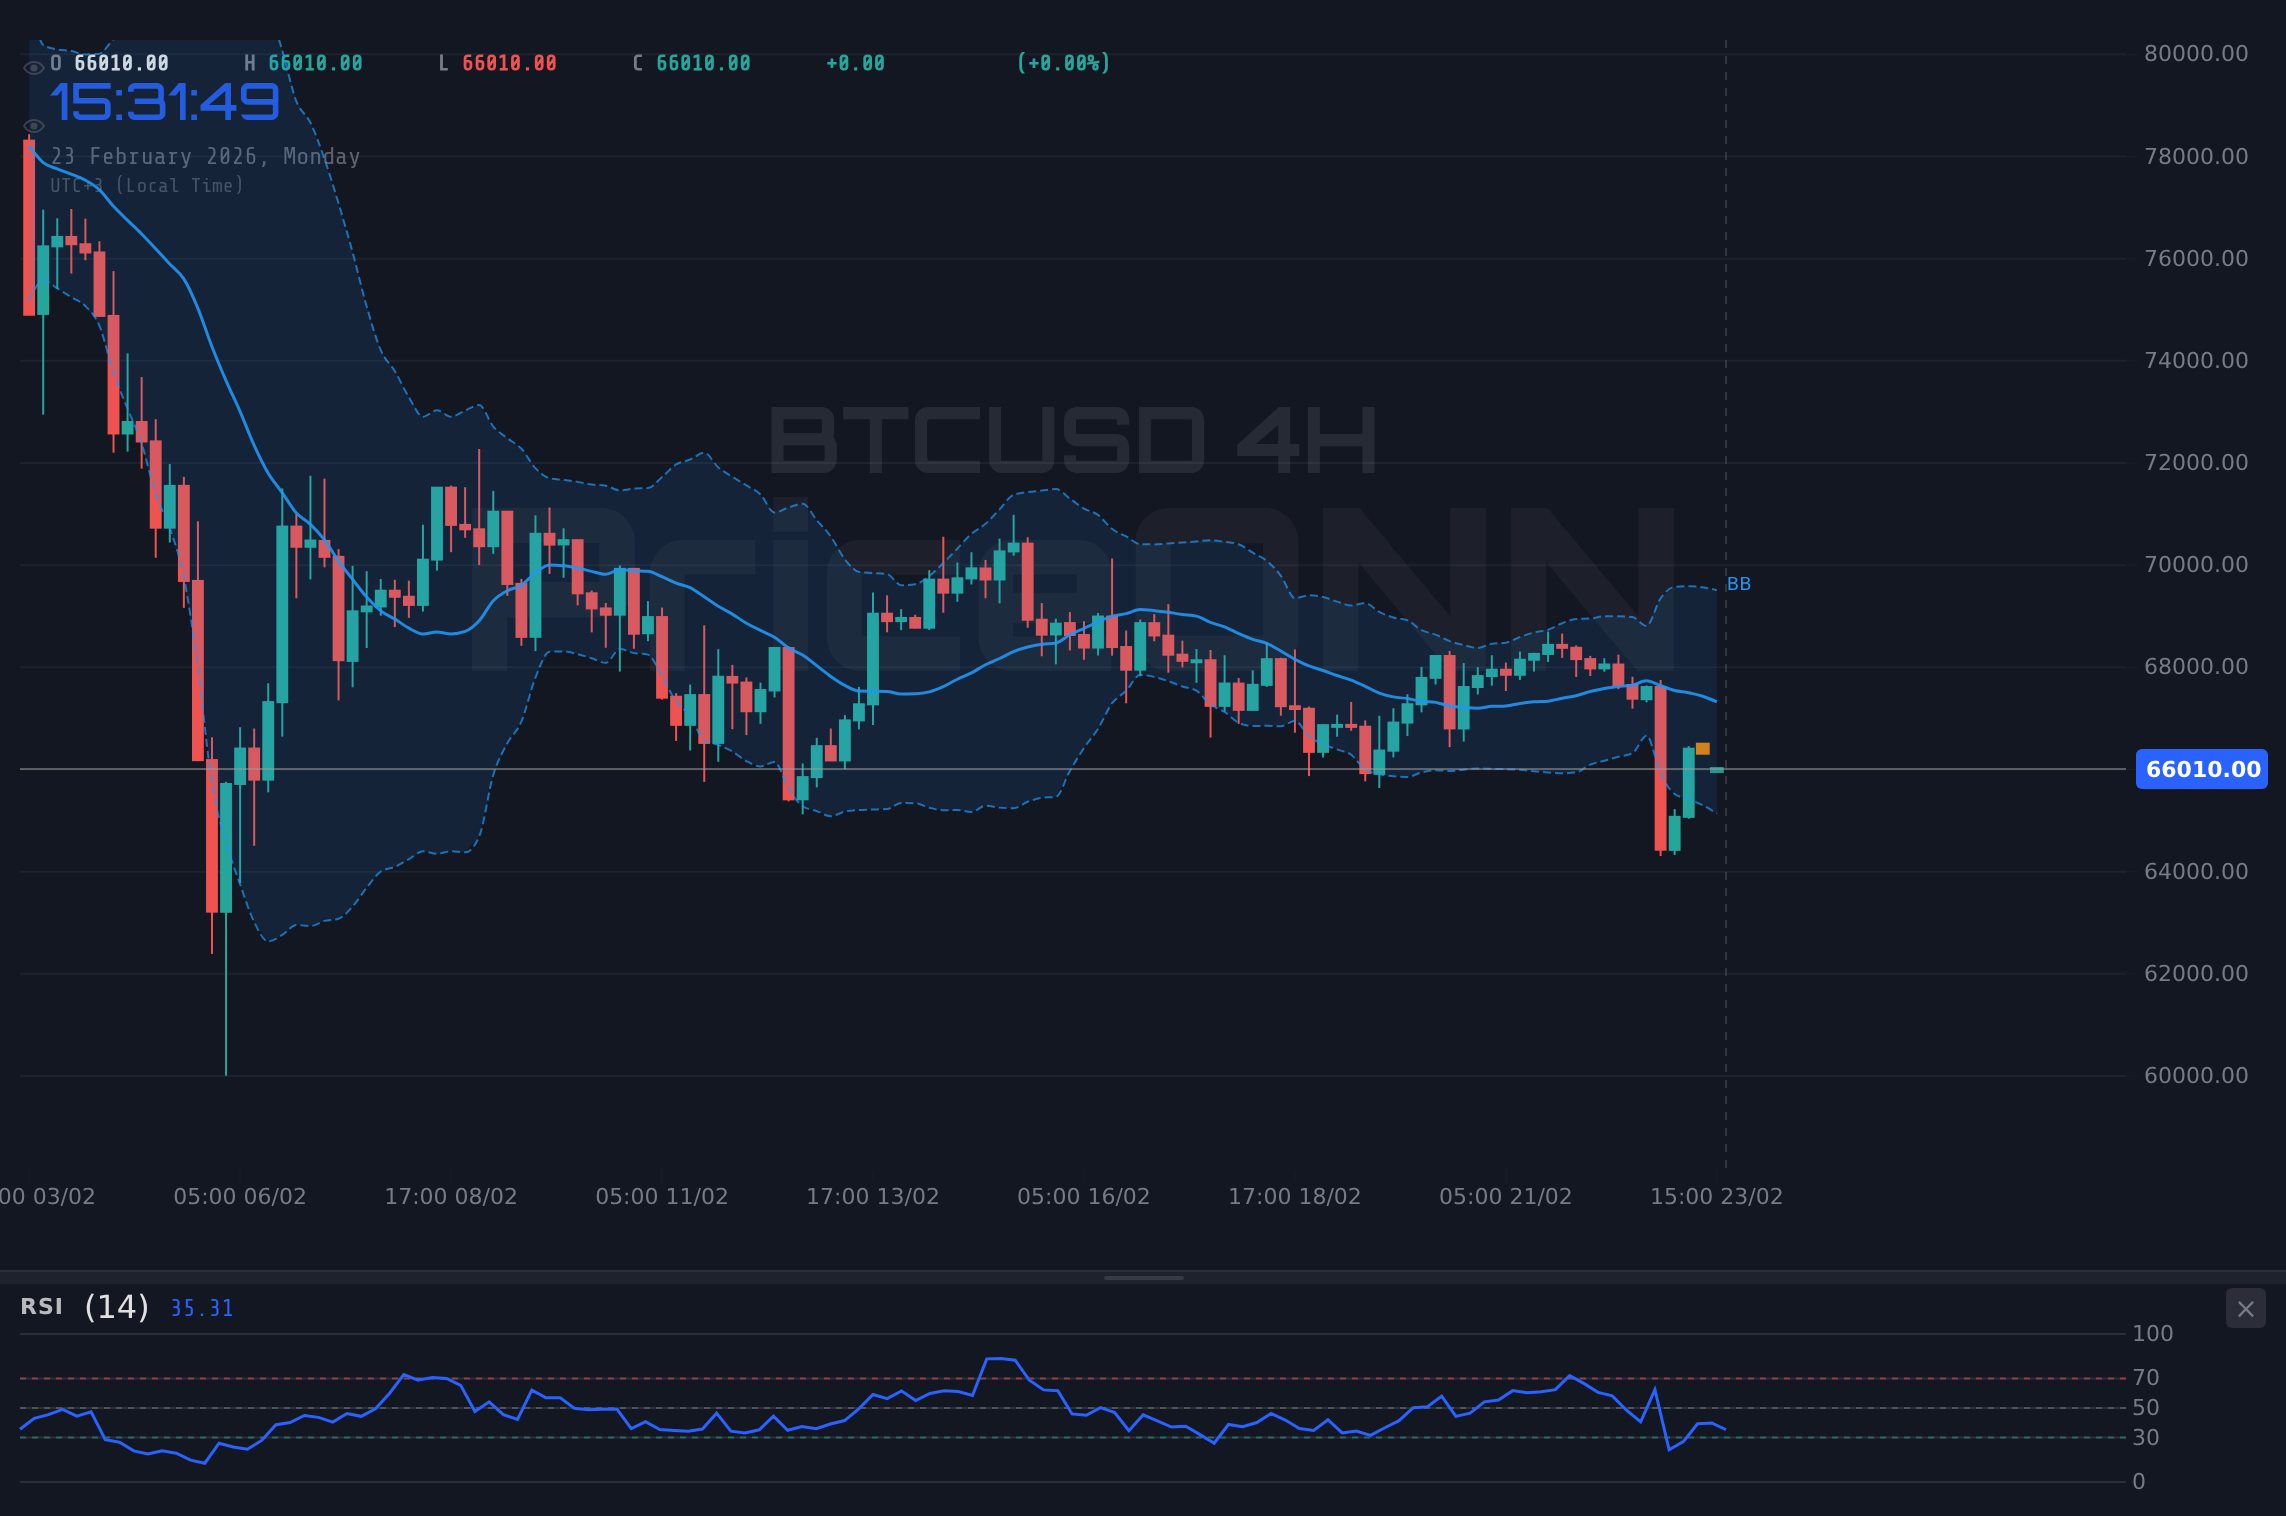
- RSI at 42.39 on the 4H chart suggests potential for oversold bounce, but trend remains bearish.
- Rising DXY and falling SP500 are weighing on BTCUSD sentiment, reinforcing the bearish pressure.
Why Risk Aversion is Pressuring BTCUSD
Today's market action is characterized by a flight to safety, with the dollar index (DXY) strengthening to 97.52 and equity indices like the SP500 and Nasdaq100 declining by 0.48% and 0.66%, respectively. This risk-off environment is primarily driven by lingering concerns about inflation and the potential for a more hawkish stance from the Federal Reserve. As Reuters reported earlier this week, Fed officials are closely monitoring inflation data to determine the appropriate course of monetary policy.
BTCUSD, often viewed as a risk asset, is particularly vulnerable to these shifts in market sentiment. As investors reduce their exposure to riskier assets, capital flows into safe havens like the US dollar, putting downward pressure on cryptocurrencies. The correlation between BTCUSD and the DXY is currently negative, reinforcing this dynamic. Simply put, with DXY at 97.52, BTCUSD is likely to remain under pressure.
Furthermore, the decline in the SP500 and Nasdaq100 reflects broader concerns about economic growth and corporate earnings. If these concerns continue to intensify, it could lead to further risk aversion and additional downside for BTCUSD. It's a confluence of factors that traders need to be aware of.
BTCUSD Technical Analysis: Key Levels and Indicators
From a technical perspective, BTCUSD is currently trading below its 200-day moving average, a key level watched by long-term investors. A break below this level could signal a shift in the long-term trend from bullish to bearish. The immediate support level to watch is $64,526.67, the first level of support on the 4H timeframe. A decisive break below this level could open the door for a test of the $63,979.33 support level.
On the upside, immediate resistance is seen at $66,540, the first level of resistance on the 1H timeframe. A successful break above this level would be needed to alleviate the current bearish pressure and pave the way for a retest of higher levels. However, given the current risk-off environment, a sustained rally appears unlikely in the near term.
The Relative Strength Index (RSI) on the 4H chart is currently at 42.39, indicating that BTCUSD is not yet oversold but approaching that territory. A move into oversold territory (below 30) could signal a potential buying opportunity, but it's important to wait for confirmation from other indicators before initiating a long position. The MACD histogram is showing negative momentum, further reinforcing the bearish bias. However, the Stochastic oscillator is signaling a potential bullish crossover, creating some mixed signals.
Why $64,526 is the Line in the Sand
The $64,526 level represents a critical juncture for BTCUSD. This level corresponds to a confluence of technical factors, including the 50% Fibonacci retracement level from the recent high and the 200-day moving average. A sustained break below this level would confirm the bearish thesis and suggest that the recent rally has come to an end.
Bears are clearly pressing at the moment, but the bulls have not given up yet. If buyers step in to defend the $64,526 level, it could trigger a short squeeze and a sharp rally back towards the $67,000 level. However, given the current market environment, a sustained rally appears unlikely unless there is a significant shift in risk sentiment.
Having tracked BTCUSD through the 2024 rate cycle, I can say that this level will determine the short-term trajectory. If it holds, a bounce back to $67,000 is possible. If it breaks, look out below.
BTCUSD Trade Plan: Riding the Bearish Momentum (60% Probability)
Enter short position if BTCUSD breaks below $64,526.67. Target $63,979.33 (TP1) and $63,629.67 (TP2). This scenario plays out if risk-off sentiment persists and the DXY continues to strengthen.
Enter long position if BTCUSD rebounds from $64,526.67 and breaks above $65,423.67. Target $65,773.33 (TP1) and $66,320.67 (TP2). This scenario requires a shift in risk sentiment and a weakening of the DXY.
Position Sizing: Risk no more than 1% of your trading capital on this trade. Given the volatility of BTCUSD, it's important to use a smaller position size to manage risk effectively.
Risk Warning: The upcoming economic data releases, including the [USD] High Impact events, could significantly impact market sentiment and trigger sharp moves in BTCUSD. Be prepared for increased volatility and adjust your stop-loss accordingly.
Codifiable Rules: 1. Short entry: Price closes below $64,526.67 on the 4H chart. 2. Stop-loss: Place stop-loss at $65,423.67. 3. Take-profit 1: $63,979.33 4. Take-profit 2: $63,629.67
This strategy works best in a clear downtrend, with strong negative correlation to DXY. Avoid using this strategy during periods of high uncertainty or major news events.
Frequently Asked Questions: BTCUSD Analysis
Is BTCUSD a good buy right now?
BTCUSD is currently trading at $66,124 and facing bearish pressure. A break below $64,526.67 could trigger further downside, so a cautious approach is warranted. Wait for a confirmed bullish reversal signal before considering a long position.
What is the BTCUSD price forecast for this week?
The BTCUSD price forecast for this week is mixed. A break below $64,526.67 could lead to a test of $63,979.33 and $63,629.67. A rebound above $66,540 could trigger a rally towards $67,000, but the overall trend remains bearish (60% probability).
What are the key support and resistance levels for BTCUSD?
Key support levels for BTCUSD are $64,526.67, $63,979.33, and $63,629.67. Key resistance levels are $66,540, $66,757, and $66,911. These levels should be watched closely for potential breakout or breakdown signals.
Why is BTCUSD moving today?
BTCUSD is moving lower today due to a combination of factors, including rising DXY, declining equity indices, and lingering concerns about inflation. This risk-off environment is putting downward pressure on cryptocurrencies.
Track markets in real-time
AI-powered analysis, technical indicators and real-time price data.
Join Our Telegram Channel
Breaking market news, AI analysis and trading signals instantly.
Join Channel