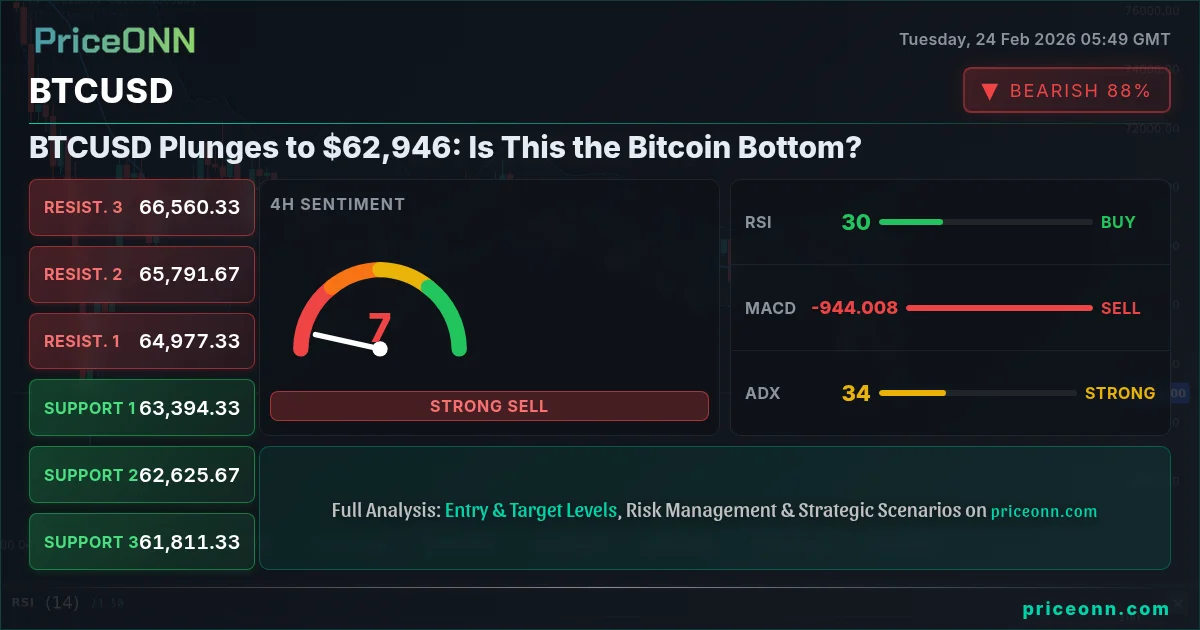
Bitcoin's sharp decline to $62,946 has traders wondering if this is the dip to buy or a prelude to a deeper correction. Let's dive into the technicals and market context to assess what's really happening.
- RSI at 23.92 signals oversold conditions on the 1H chart, but ADX at 43.91 confirms a strong downtrend.
- Critical support lies at $62,933.33, a break below this level could trigger further selling.
- MACD histogram shows negative momentum, but Stochastic at 18.88 suggests a potential oversold bounce.
- Fed rate expectations and DXY strength are driving BTCUSD's inverse correlation with the dollar index.
Where Does Bitcoin Go From $62,946?
The current price action of BTCUSD at $62,946 presents a mixed picture. On one hand, the hourly RSI of 23.92 indicates oversold conditions, which often precede a bounce. However, the broader trend, as indicated by the daily ADX of 57.07, remains strongly bearish. This divergence requires careful interpretation. Is this a short-term correction within a larger downtrend, or the beginning of a more sustained recovery?
Having tracked BTCUSD through multiple market cycles, I've learned that relying solely on one indicator can be misleading. We need to consider the confluence of multiple signals and the broader market context. The strong downtrend confirmed by the ADX suggests that any bounce may be short-lived, especially if it coincides with a stronger DXY.
BTCUSD Technical Analysis: A Multi-Timeframe Perspective
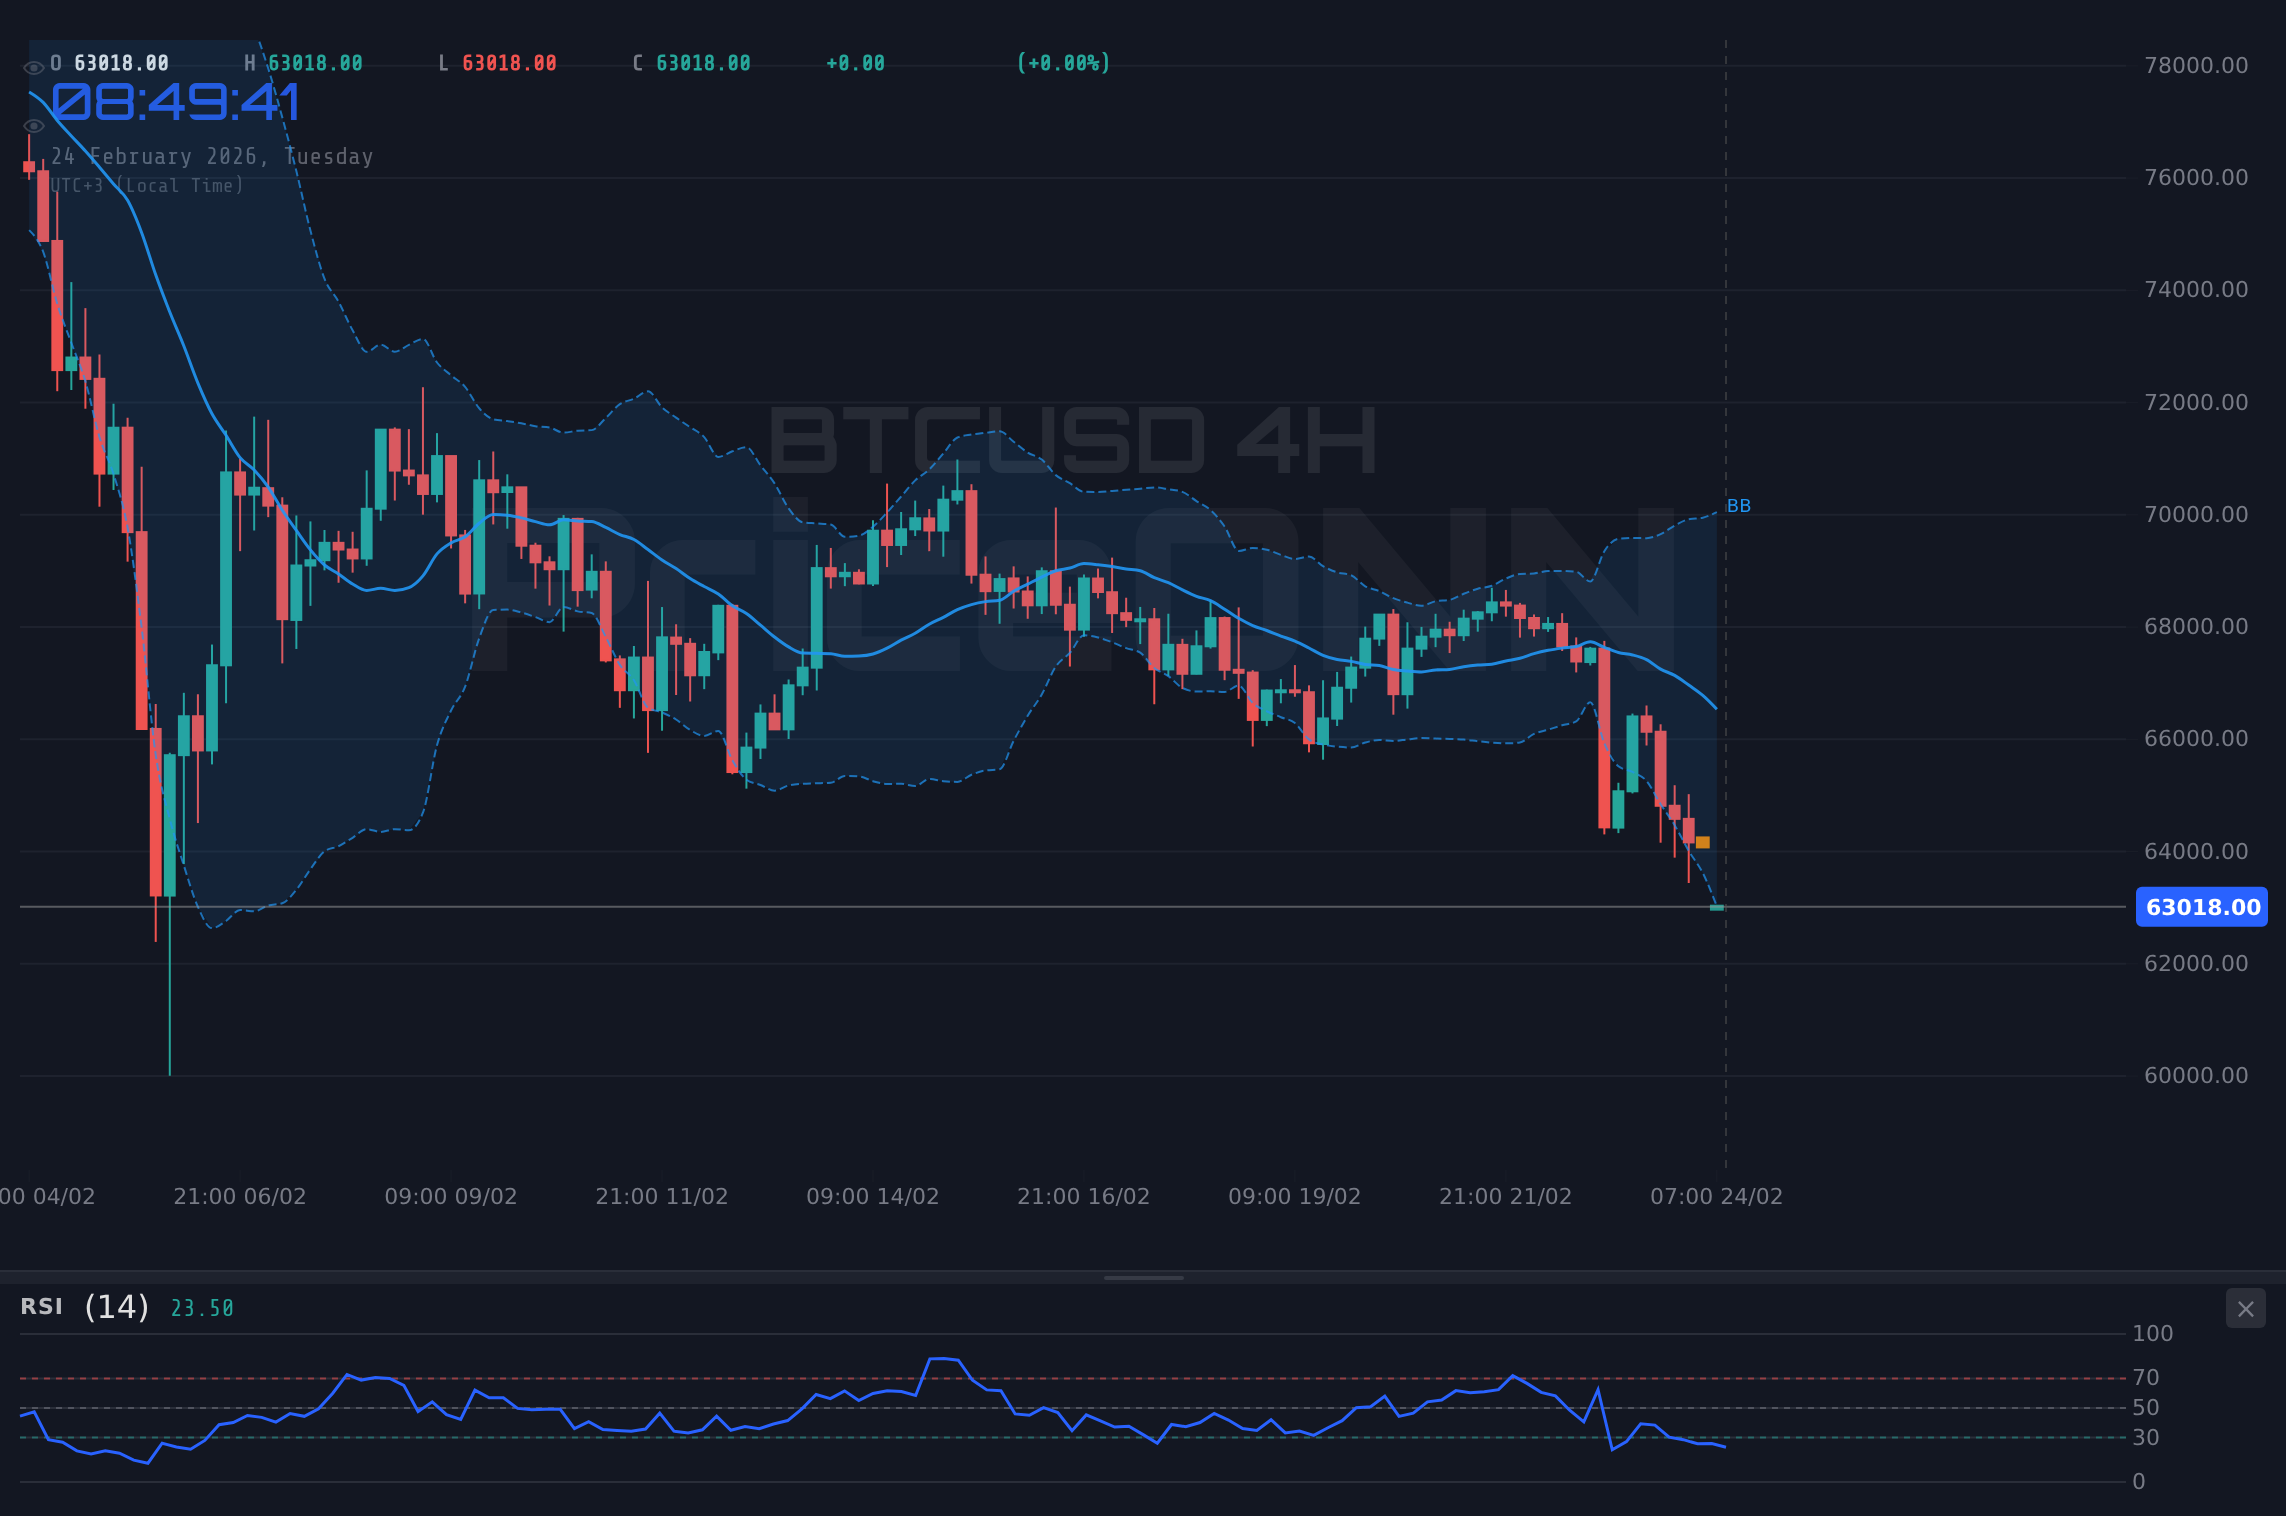
A multi-timeframe analysis is crucial for understanding the current state of BTCUSD. On the hourly chart, the RSI is oversold, and the Stochastic at 18.88 further supports this view. However, the 4-hour and daily charts paint a different picture. The 4-hour RSI sits at 29.33, also nearing oversold but not as extreme as the hourly. The daily RSI is at 30.19, indicating more room for downside.
The MACD histogram on the hourly chart shows negative momentum, but it's starting to flatten, suggesting a potential easing of selling pressure. However, the 4-hour and daily MACD histograms remain firmly negative, reinforcing the bearish trend. This is exactly where you need to pay attention – conflicting signals across timeframes mean indecision in the market. It's not time to FOMO in or panic sell; it's time to be patient.
Look, the hourly Stochastic is signaling a potential oversold bounce, but the 4H Stochastic at 10.65 confirms that this downtrend has legs. Until we see the daily Stochastic turn up, any upside is likely limited.
Key Support and Resistance Levels for BTCUSD
Key support levels to watch are $63,265.67, $62,933.33, and $62,510.67. A break below $62,933.33 could trigger further selling, potentially leading to a test of $62,510.67. On the upside, resistance levels are $64,020.67, $64,443.33, and $64,775.67. The bulls need to reclaim $64,020.67 to signal a potential trend reversal.
Historically, when BTCUSD breaks below a key support level like $62,933.33, it often leads to a cascade of stop-loss orders, exacerbating the selling pressure. This is why it's crucial to watch these levels closely and manage your risk accordingly.
The Impact of the DXY and Fed Expectations on BTCUSD
The strength of the dollar index (DXY) and expectations for Federal Reserve policy play a significant role in BTCUSD's price action. The DXY is currently at 97.57, and with the DXY trending upward, BTCUSD is likely to remain under pressure. A stronger dollar makes Bitcoin less attractive to international investors, as it becomes more expensive to purchase.
The Fed's stance on interest rates is another critical factor. If the Fed signals a more hawkish approach, with potentially faster or larger rate hikes, it could further weigh on BTCUSD. Conversely, a more dovish stance could provide some relief. According to Reuters, Fed officials have emphasized the need to remain data-dependent, which means upcoming economic releases will be closely scrutinized by the market.
Trade Plan: Riding the BTCUSD Downtrend
Given the overall bearish technical picture and the influence of the DXY, a short-term bearish strategy seems most appropriate for BTCUSD at the moment. However, the oversold conditions on the hourly chart warrant caution. Patience looks like it will be rewarded here.
A sustained break above $64,020.67, with strong volume, could signal a potential trend reversal. Targets would then be $64,443.33 and $64,775.67. This scenario has a 30% probability.
A break below $62,933.33 would confirm the downtrend and likely lead to further downside. Targets would be $62,510.67 and $61,547.67. This scenario has a 70% probability.
What the Economic Calendar Tells Us About BTCUSD
The economic calendar is filled with key events that could impact BTCUSD. Investors are closely watching the upcoming GDP data on Thursday, which could provide insights into the strength of the US economy and influence the Fed's policy decisions. If the GDP data comes in stronger than expected, it could further strengthen the DXY and weigh on BTCUSD.
Manage your risk, wait for your setup - the market always gives a second chance. The risk in these choppy waters is real, but so is the potential for profit. The key is to manage your risk and wait for high-probability setups.
Don't Overreact to BTCUSD Volatility
Volatility creates opportunity, but it also creates risk. Don't overreact to short-term price swings. Stick to your trading plan and manage your risk. The market always gives a second chance. If you miss a setup, don't chase it. Wait for the next opportunity.
Frequently Asked Questions: BTCUSD Analysis
Is BTCUSD a good buy right now?
At $62,946, BTCUSD is nearing oversold territory, but the strong downtrend suggests caution. A confirmed break above $64,020.67 might signal a buying opportunity, but until then, waiting for further confirmation is prudent.
What is the BTCUSD price forecast for this week?
The price forecast for BTCUSD this week is bearish, with a target of $62,510.67. However, a bounce to $64,020.67 is possible. I assign a 70% probability to the bearish scenario and a 30% probability to the bullish scenario.
What are the key support and resistance levels for BTCUSD?
Key support levels for BTCUSD are $63,265.67 and $62,933.33, while key resistance levels are $64,020.67 and $64,443.33. A break of either level will likely dictate the short-term direction.
Why is BTCUSD moving today?
BTCUSD is moving lower today due to a combination of factors, including a stronger DXY, risk-off sentiment in the broader market, and profit-taking after recent gains. The strong downtrend is also contributing to the selling pressure.
Track markets in real-time
AI-powered analysis, technical indicators and real-time price data.
Join Our Telegram Channel
Breaking market news, AI analysis and trading signals instantly.
Join Channel