
BTCUSD Weekly: Flat Close at $66,952 Amid Key Events Ahead
BTCUSD hovers near $66,952 as markets digest last week's price action and brace for crucial upcoming economic data and potential shifts in institutional sentiment.
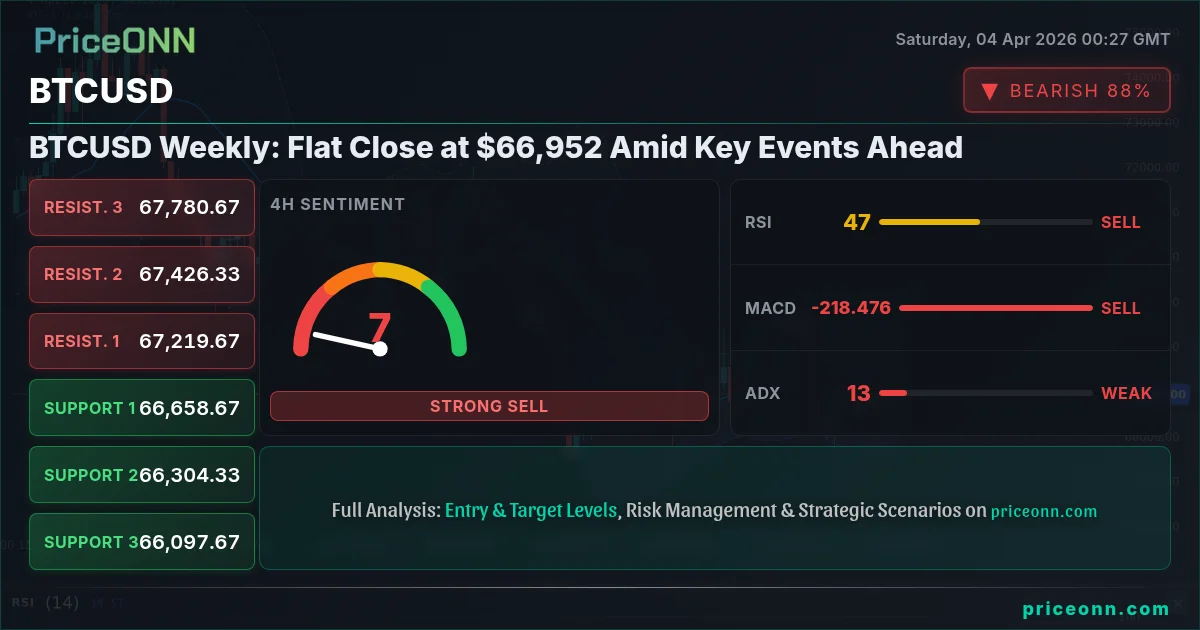
Bitcoin (BTCUSD) concluded the past week trading flat around the $66,952 mark, a seemingly quiet close that masks significant undercurrents and pivotal events on the horizon. After a period of sharp volatility, the cryptocurrency market, led by its flagship asset, appears to be consolidating, waiting for clearer directional signals from both on-chain metrics and the broader macroeconomic landscape. This period of relative calm, however, is deceptive. Beneath the surface, a complex interplay of institutional positioning, regulatory whispers, and the ever-present influence of macroeconomic drivers is setting the stage for potentially significant price action in the coming days and weeks. The technical indicators, while mixed across different timeframes, are beginning to paint a picture of cautious observation rather than outright conviction, leaving traders and investors in a state of watchful anticipation. The $66,952 level is not just a price point; it represents a critical juncture where the market is weighing conflicting forces, making the upcoming analysis of key events and technical setups paramount for understanding Bitcoin's next move.
- BTCUSD is currently consolidating around $66,952, showing a mixed technical signal with a neutral 1H RSI of 51.95 and a bearish 1D RSI of 43.36.
- Key support for BTCUSD is observed at $66,834, while resistance looms at $66,961 on the 1H chart, highlighting a tight trading range.
- On-chain data shows a divergence in corporate Bitcoin holdings, with some selling at a loss while others hold firm, indicating uncertainty among institutional players.
- The broader market context, including a strengthening DXY at 99.68 and mixed signals from major equity indices like the S&P 500 (6572.87), adds complexity to BTCUSD's outlook.
The past week offered a stark reminder that the cryptocurrency market, while often characterized by its rapid and dramatic price swings, is also subject to periods of consolidation and indecision. Bitcoin, trading at $66,952 as the week drew to a close, has found itself in a precarious balance. This is not a market that has capitulated, nor one that has found a clear bullish mandate. Instead, it's a market pausing for breath, digesting recent price movements and awaiting definitive catalysts. The 1-hour chart, often a window into short-term sentiment, shows a neutral RSI of 51.95, suggesting a lack of strong directional conviction in intraday trading. However, the daily view presents a more cautious picture, with the RSI at 43.36, indicating a slight bearish lean as momentum seems to be waning. This divergence across timeframes is a classic sign of a market at a crossroads. Traders are meticulously watching the $66,834 support level; a sustained break below this could signal further downside, potentially testing lower psychological thresholds. Conversely, the $66,961 resistance on the hourly chart represents an immediate hurdle that needs to be cleared for any significant upward momentum to build. The absence of clear fundamental catalysts or overwhelming technical signals has led to this period of equilibrium, but such periods are rarely permanent.
The on-chain data landscape offers a nuanced perspective on institutional sentiment, revealing a growing divergence among corporate Bitcoin holders. Recent market news highlights this split: while some entities, like Nakamoto Holding, have been observed selling at a loss, suggesting a capitulation or a need for liquidity, others are reportedly holding firm. This bifurcation is crucial. It implies that the market narrative is not monolithic; there isn't a single 'smart money' consensus driving price action. Instead, we are seeing a more complex decision-making process unfold, influenced by varying risk appetites, treasury management strategies, and perhaps differing outlooks on the future of Bitcoin's price trajectory. The fact that some corporate entities are willing to offload Bitcoin at a loss, even as the price hovers around $66,952, could be interpreted as a sign of pressure, but it also might free up capital for more strategic, conviction-driven investors to accumulate positions. Understanding this dynamic is key to deciphering whether the current consolidation is a prelude to a renewed rally or a precursor to a deeper correction.
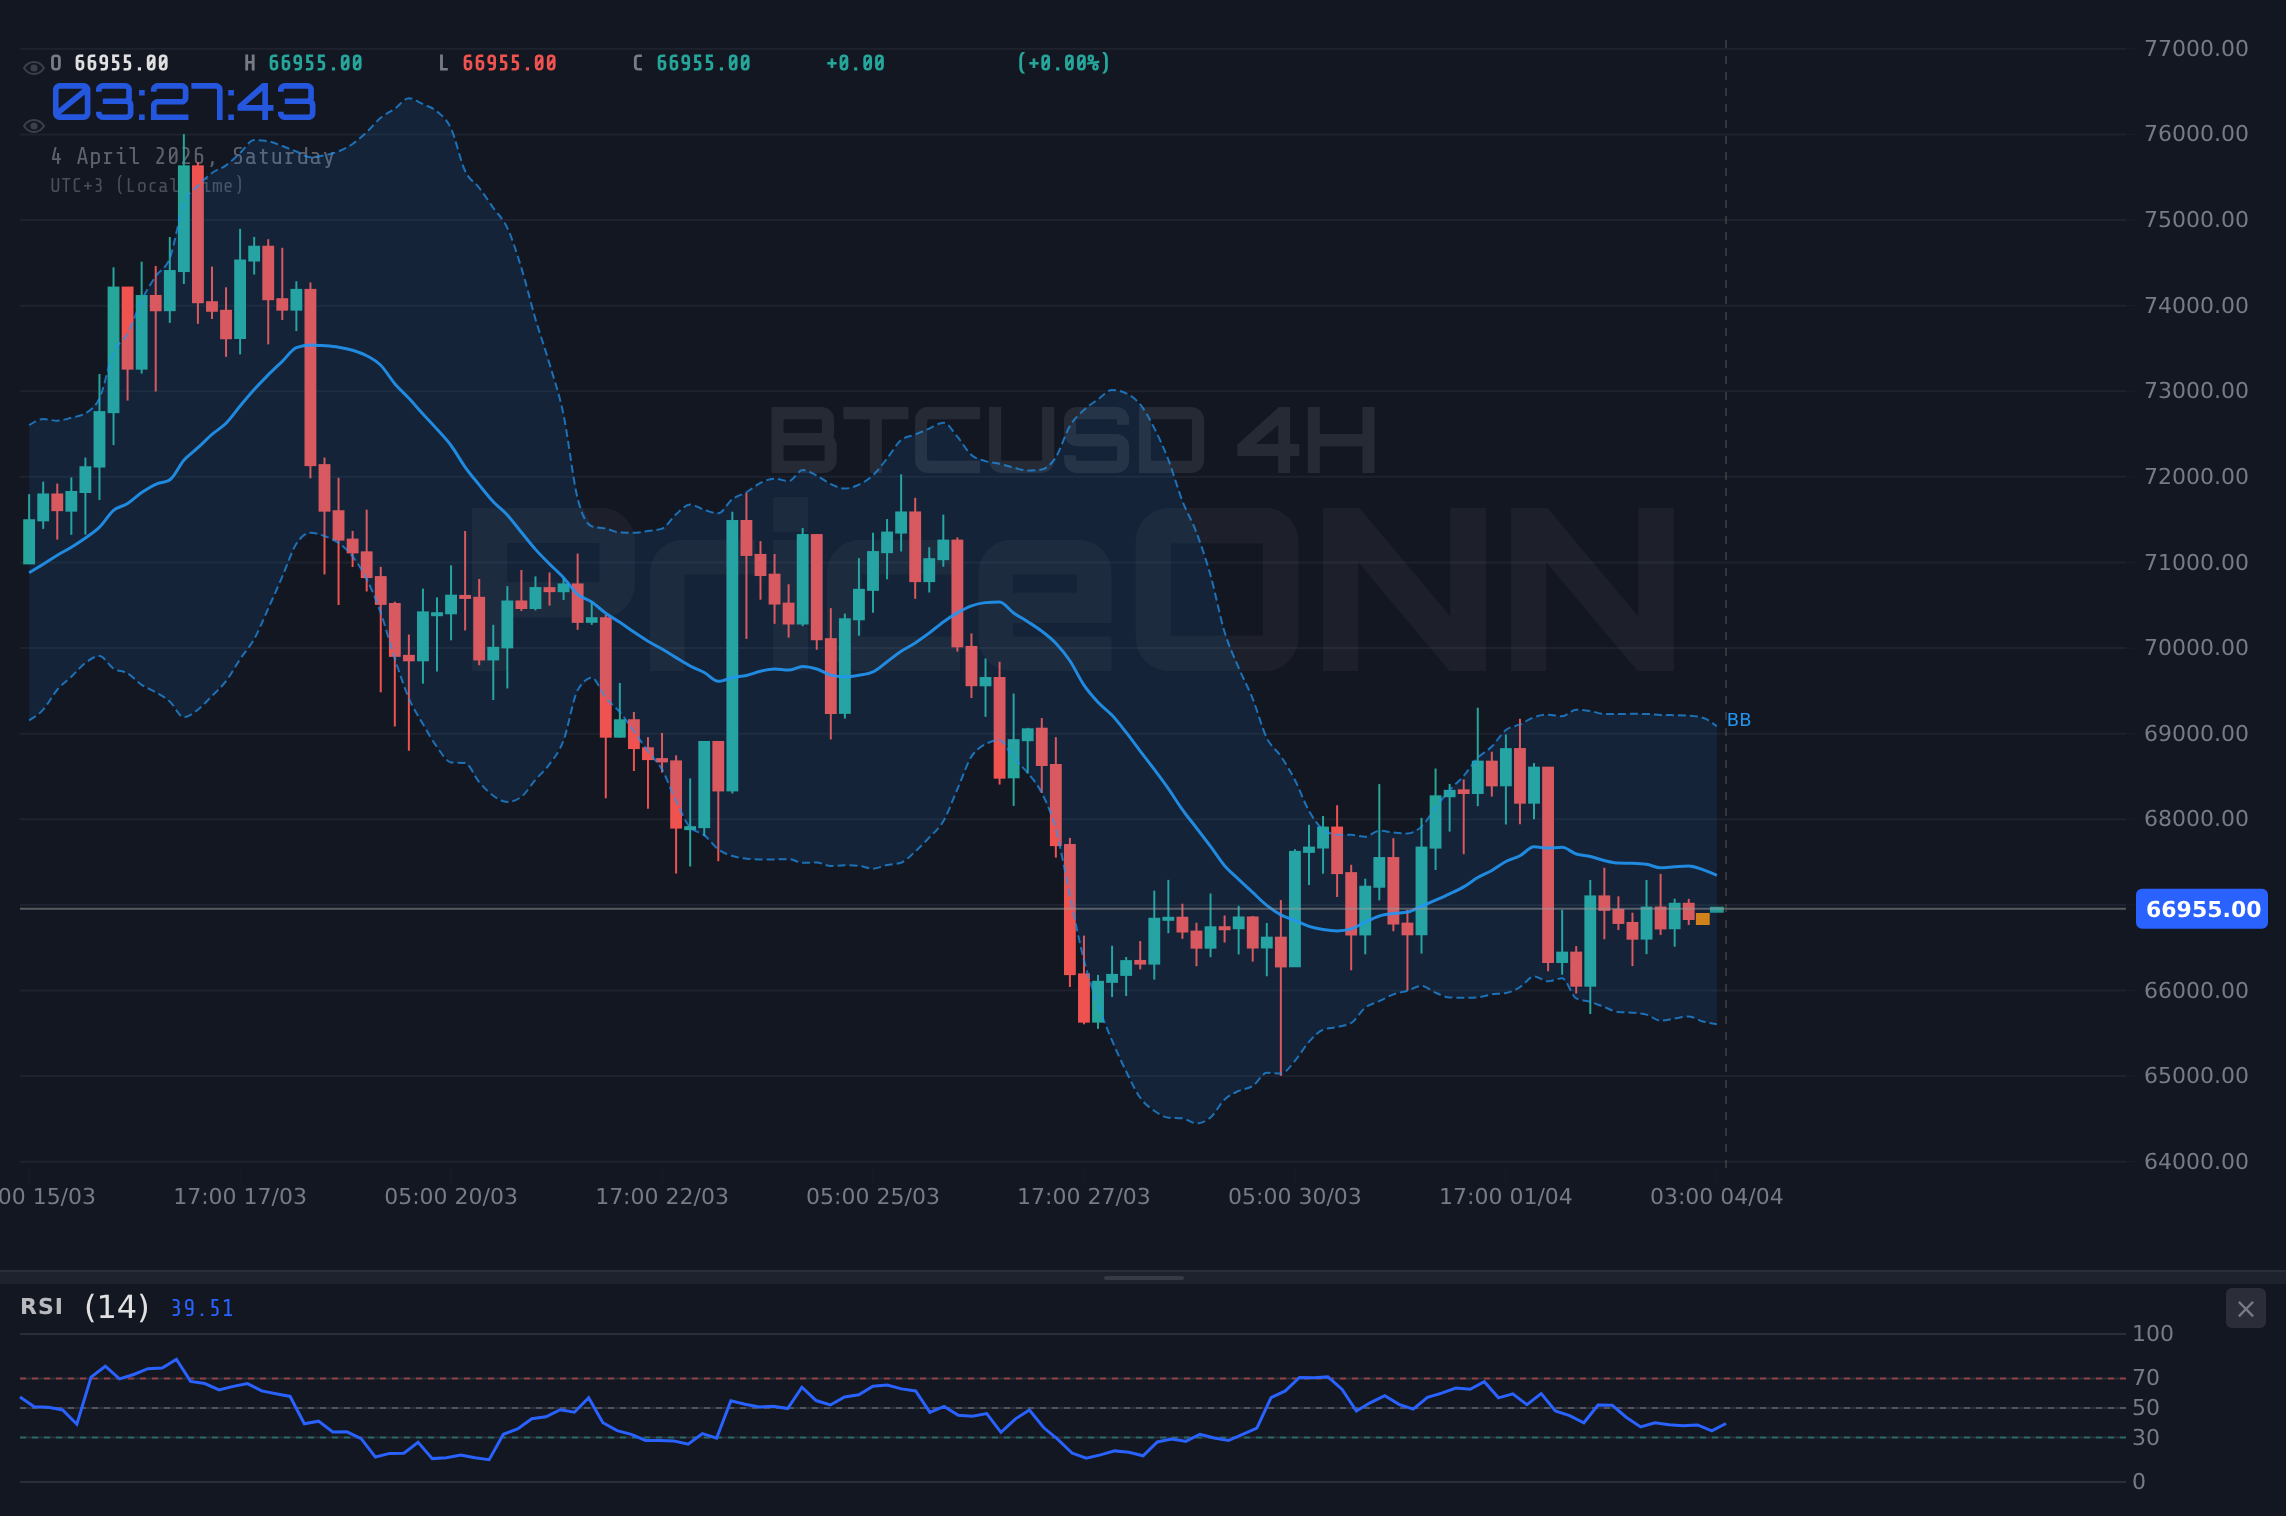
Adding another layer of complexity is the broader macroeconomic environment, which continues to cast a long shadow over risk assets like Bitcoin. The US Dollar Index (DXY) has shown resilience, trading around 99.68. A strengthening dollar typically exerts downward pressure on cryptocurrencies, as it increases the cost of dollar-denominated assets for holders of other currencies and often signals a 'risk-off' sentiment in global markets. This is further amplified by geopolitical tensions, as indicated by recent news of hawkish rhetoric impacting sentiment towards oil and broader risk assets. Major equity indices, which often move in tandem with Bitcoin, are also showing mixed signals. The S&P 500, for instance, is trading around 6572.87, having seen some gains, but the Nasdaq 100 has experienced a slight dip, reflecting a cautious approach towards tech-heavy growth stocks. This correlation between equities and Bitcoin means that any significant shift in risk appetite within the stock market will likely be mirrored, albeit with amplified volatility, in the crypto space. Traders are therefore not just watching BTCUSD charts but also closely monitoring the DXY and major equity indices for clues about the prevailing market mood.
The technical indicators, when viewed holistically, present a landscape of conflicting signals, typical of a market in consolidation. On the 1-hour timeframe, the ADX at 17.58 suggests a weak trend, indicating that neither buyers nor sellers have established firm control, aligning with the neutral RSI of 51.95. The Stochastic Oscillator, with K at 66.94 and D at 50.95, leans bullish, but this is within a range that lacks strong conviction. The MACD, however, shows positive momentum, with the MACD line above the signal line, offering a slight counterpoint to the weak ADX. This short-term picture is one of indecision. However, shifting focus to the daily chart reveals a different narrative. The ADX climbs to 19.17, still indicating a weak trend, but the RSI at 43.36 leans bearish, and the MACD has turned negative, with the MACD line below the signal line. This suggests that while intraday traders might see opportunities, the longer-term trend is not yet definitively established. The Bollinger Bands on the daily chart are also trading below the middle band, indicating downward pressure. This technical dichotomy across timeframes means that short-term traders might find scalp opportunities, but swing and long-term investors need to see a clearer trend emerge, likely confirmed by a decisive break above resistance or a firm hold of support.
The crypto-specific ecosystem developments also warrant close attention. While the price of BTCUSD remains subdued, the underlying infrastructure and applications continue to evolve. Recent news about Circle's potential entry into the wrapped Bitcoin market with 'cirBTC' highlights the ongoing innovation in making Bitcoin more accessible and usable within decentralized finance (DeFi). Wrapped Bitcoin (wBTC) solutions aim to bridge Bitcoin's liquidity into smart contract platforms like Ethereum, enabling its use in DeFi protocols. Competition in this space, as suggested by Circle's move, can lead to better services, lower fees, and increased utility for BTC holders. The development of such use cases, even if not immediately impacting the spot price of BTCUSD, contributes to the long-term value proposition of Bitcoin. Furthermore, the ongoing adjustments in mining difficulty, as seen with a recent solo miner striking a large block reward, are a testament to the network's resilience and its dynamic reward mechanism. While these are fascinating developments, their immediate impact on the $66,952 price point is indirect, serving more as foundational support for future growth rather than catalysts for immediate price surges.
The Tightrope Walk at $66,952
The current trading range for BTCUSD, defined by the immediate support at $66,834 and resistance at $66,961 on the 1-hour chart, illustrates the market's current indecision. A break above $66,961 would be the first sign of bullish conviction, potentially targeting higher levels. However, the underlying daily trend indicators suggest that such a breakout might face immediate headwinds. The ADX on the daily chart at 19.17, while indicating a weak trend, is still present, and the bearish lean in the RSI (43.36) cannot be ignored. Conversely, a decisive close below $66,834 would likely trigger a cascade of selling, as stop-loss orders are triggered and short-term traders exit positions. The next significant support level to watch would then be the 4-hour support at $66,658.67, followed by the more substantial daily support cluster around $65,559. The fact that the market is oscillating within such a narrow band around $66,952 suggests that participants are awaiting external validation, whether through economic data releases or significant shifts in institutional flows.
The correlation with broader market movements cannot be overstated. As mentioned, the DXY's stability around 99.68 provides a constant counter-pressure. If the dollar were to strengthen significantly, perhaps on the back of hawkish commentary from the Federal Reserve or renewed global risk aversion, it would almost certainly weigh on BTCUSD. Similarly, the performance of equity markets, particularly the tech-heavy Nasdaq 100 (currently trading around 23956.5 with mixed daily signals), acts as a barometer for risk appetite. A sustained downturn in equities, driven by inflation concerns or geopolitical instability, would likely see Bitcoin follow suit, potentially even amplifying the move due to its inherent volatility. The current price action around $66,952 for BTCUSD is therefore not occurring in a vacuum; it's a reflection of a wider global financial sentiment that is itself navigating a complex path between inflationary pressures, central bank policy uncertainty, and geopolitical risks. The market's ability to hold $66,952 is partly a function of its resilience against these external factors.
Looking at the 4-hour timeframe, the picture becomes even more nuanced. The RSI at 47.17 is in neutral territory but trending downwards, suggesting a gradual loss of upward momentum. The MACD has turned negative, with the MACD line below the signal line, indicating bearish pressure on this intermediate timeframe. The Stochastic Oscillator, however, shows a bullish signal with K (60.64) above D (40.67), which might suggest a short-term bounce is possible. Yet, the ADX at 13.25 points to a very weak trend, reinforcing the idea that the market is largely range-bound and lacks directional conviction. This setup implies that while there might be short-term trading opportunities as the price bounces between support at $66,658.67 and resistance at $67,219.67, the overall trend is not clearly defined. For a more robust trading strategy, waiting for a clearer signal on the daily timeframe, or a confirmed breakout from this tight range, would be prudent. The current price of $66,952 is essentially a pivot point, with neither bulls nor bears able to assert dominance decisively.
The role of institutional adoption and flows remains a critical, albeit often opaque, driver for Bitcoin's price. While direct ETF flows are not provided in the real-time data, the divergence in corporate holdings mentioned earlier is a proxy for institutional sentiment. If large holders are selling, it can create selling pressure. Conversely, if institutions begin to accumulate, especially on dips, it can provide a floor for the price. The upcoming week will likely see increased scrutiny on any official statements or filings from major Bitcoin holders or ETF issuers. The narrative around Bitcoin as a potential inflation hedge versus a risk-on asset continues to be debated, and institutional positioning will be the ultimate arbiter of which narrative prevails. At $66,952, the market is essentially waiting to see which camp gains the upper hand – those seeking to de-risk their portfolios or those doubling down on a long-term bullish thesis for digital assets.
From a trading perspective, the current environment around $66,952 calls for patience and a focus on risk management. The mixed signals across timeframes and indicators suggest that chasing short-term moves could be risky. A strategy that involves waiting for a clear break of either the immediate support at $66,834 or resistance at $66,961, confirmed by increased volume and follow-through on higher timeframes, would likely offer a better risk-reward ratio. For those looking for confirmation, a daily close above $67,219.67 might signal a move towards higher resistance levels, while a daily close below $66,658.67 could indicate a test of the lower support zone around $65,559. The ADX values across all timeframes (17.58 on 1H, 13.25 on 4H, 19.17 on 1D) consistently point to a lack of strong trending momentum, reinforcing the idea that breakout trading strategies might be more appropriate than range-bound scalping, but only once the breakout is confirmed.
The on-chain metrics, beyond corporate holdings, also provide valuable context. Active addresses, hash rates, and exchange flows offer insights into the network's health and user activity. While specific real-time on-chain data is not provided, general trends suggest continued network security and developer activity. A high hash rate, for instance, indicates a robust and secure network, which is a long-term positive for Bitcoin. However, a significant increase in exchange inflows could precede selling pressure, while outflows might indicate accumulation. The recent news of a solo miner netting a substantial block reward amidst difficulty adjustments is a fascinating anomaly, but it doesn't fundamentally alter the short-to-medium term price dynamics around $66,952. It's a testament to the network's mechanics, but not a direct market-moving event in itself.
The influence of macroeconomic data releases cannot be understated. The economic calendar, though light on high-impact events for Saturday, April 4th, points to upcoming crucial US data. Any surprises in employment figures, inflation reports, or central bank commentary in the following week could significantly alter the risk appetite and, consequently, the price of BTCUSD. For instance, stronger-than-expected inflation data could reignite fears of higher-for-longer interest rates, putting pressure on risk assets. Conversely, signs of cooling inflation could bolster hopes for earlier rate cuts, potentially benefiting Bitcoin. Traders must remain vigilant, as these macro events often act as the primary catalysts that can break markets out of consolidation patterns, like the one currently observed around $66,952.
The regulatory environment also remains a background factor. While there are no major regulatory announcements of immediate impact, the ongoing discussions and potential policy shifts globally can influence institutional adoption and market sentiment. Clarity on regulatory frameworks often breeds confidence, while uncertainty can lead to caution. The market's reaction to any news, however minor, regarding regulatory clarity or crackdowns should be closely monitored, as it can trigger significant price movements, especially when BTCUSD is trading at such a critical juncture near $66,952.
Navigating the Current Landscape
The current technical setup for BTCUSD around $66,952 is characterized by conflicting signals across different timeframes and a lack of strong trending momentum. The 1-hour chart shows a neutral RSI (51.95) and positive MACD momentum, suggesting potential for short-term upside, with resistance at $66,961 and support at $66,834. However, the daily chart presents a more bearish outlook with a lower RSI (43.36), negative MACD, and a weak ADX (19.17), indicating a lack of sustained upward trend. This technical ambiguity, coupled with mixed institutional sentiment and a cautious macroeconomic backdrop, suggests that the market is in a 'watch and wait' mode. A decisive break above $67,219.67 (4H resistance) would be needed to signal a stronger bullish case, targeting higher levels. Conversely, a failure to hold support at $66,658.67 (4H support) could lead to a test of the daily support zone near $65,559. The current price of $66,952 is a critical pivot, and confirmation from increased volume or clearer macro signals will be essential before committing to significant positions.
The interplay between Bitcoin's price action and the broader crypto market is also noteworthy. While BTCUSD has been consolidating, some altcoins have shown surges, as indicated in recent market news. This can sometimes lead to a 'flight to safety' within the crypto space, where capital moves from larger, more established assets like Bitcoin to smaller, more speculative altcoins. However, often, a strong Bitcoin performance is a prerequisite for a healthy altcoin market. The current consolidation might be a necessary pause before Bitcoin can lead another significant leg up for the entire crypto ecosystem. The dominance of Bitcoin within the total crypto market cap is a key metric to watch; if it starts to decline significantly while altcoins surge, it could indicate a shift in market leadership, but for now, the focus remains on BTCUSD's ability to break its current range around $66,952.
The recent price action, particularly the consolidation around $66,952, suggests that the market is absorbing recent news and preparing for the next phase. The divergence in corporate holdings and the mixed technical signals create an environment where patience is a virtue. For traders, the key will be to identify clear breakout or breakdown scenarios, rather than trying to anticipate moves within the current tight range. The influence of the DXY at 99.68 and the performance of equity indices will remain critical external factors. As we look towards the coming week, all eyes will be on upcoming economic data and any shifts in institutional sentiment that could provide the catalyst needed to break Bitcoin out of its current equilibrium. The $66,952 level remains a critical battleground, and its resolution will likely set the tone for the near-term future of the cryptocurrency market.
The strength of the underlying Bitcoin network, evidenced by its hash rate and developer activity, provides a long-term bullish undercurrent. However, short-to-medium term price action is heavily influenced by macroeconomic factors and speculative flows. The current price of $66,952 represents a point where these forces are in delicate balance. Without a clear catalyst, BTCUSD risks remaining range-bound, potentially leading to frustration for traders eager for decisive moves. Yet, it is precisely in these periods of consolidation that the groundwork for the next major trend is often laid. The key for investors is to remain disciplined, manage risk effectively, and wait for high-probability setups to emerge, rather than forcing trades in an uncertain market. The market always provides opportunities; the challenge is to identify them when they align with sound technical and fundamental analysis.
The narrative of Bitcoin as an inflation hedge versus a risk-on asset continues to be a focal point. If inflation proves persistent, as some indicators suggest, Bitcoin's 'digital gold' narrative could gain traction, potentially driving demand. However, if central banks maintain a hawkish stance to combat inflation, the higher interest rate environment could continue to suppress risk assets. The current price of $66,952 is a reflection of this ongoing debate. The technical indicators, while offering some short-term signals, do not provide a clear directional mandate. Therefore, the resolution of this macroeconomic tug-of-war, alongside decisive technical breaks, will likely dictate Bitcoin's trajectory in the coming weeks. The market is at a critical juncture, and the ability to navigate this uncertainty with a well-defined strategy will be key to success.
The recent price action around $66,952 has highlighted the importance of multi-timeframe analysis. While the 1-hour chart may offer fleeting opportunities, the daily and even 4-hour timeframes suggest a market lacking strong directional conviction. The ADX values across all these charts consistently point to weak trends, reinforcing the idea that we are in a consolidation phase. This means that breakout strategies, confirmed by increased volume and follow-through, are likely to be more profitable than trying to trade within the tight intraday ranges. The key support at $66,834 and resistance at $66,961 on the 1-hour chart are immediate reference points, but the larger picture painted by the daily indicators suggests that the market is waiting for a more significant catalyst to break free from its current equilibrium. The $66,952 level serves as a pivot, and its resolution will be critical.
The crypto ecosystem is not static; innovation continues even during price consolidation. Developments in Layer 2 scaling solutions, as highlighted in recent news concerning Ethereum, aim to address transaction fee volatility, which is crucial for mass adoption. While this is specific to Ethereum, the principle applies to the broader crypto space, including Bitcoin. Solutions that enhance utility, security, and accessibility for Bitcoin holders, such as new wrapped Bitcoin initiatives, contribute to its long-term value proposition. These fundamental improvements, while not always immediately reflected in the spot price of BTCUSD at $66,952, are essential for sustainable growth and can provide a backdrop of underlying strength that supports future rallies.
The current market sentiment, characterized by mixed signals and a lack of clear direction around $66,952, necessitates a cautious approach. Traders should be prepared for potential volatility as key economic data is released and institutional flows become clearer. The technical picture suggests that a decisive break above $67,219.67 or a confirmed drop below $66,658.67 could trigger significant price movement. Until then, focusing on risk management, waiting for high-probability setups, and maintaining a disciplined trading strategy will be paramount. The market is in a state of flux, and adaptability will be the key to navigating the opportunities and challenges that lie ahead.
The historical context of Bitcoin's price action reveals that periods of consolidation often precede significant trends. Following sharp rallies or corrections, the market frequently enters a phase of equilibrium as participants reassess conditions. The current sideways movement around $66,952 is not unusual in this regard. It's a period where the market digests information, recalibrates expectations, and sets the stage for the next directional move. Understanding that these phases are a natural part of market cycles can help investors maintain perspective and avoid making impulsive decisions based on short-term price fluctuations. The strength of the network and continued development in the crypto space provide a fundamental basis for optimism, even amidst current technical ambiguity.
The correlation with gold prices, currently around $4,676.18 and showing a daily decline, also adds an interesting dimension. Both Bitcoin and gold are sometimes viewed as inflation hedges or safe-haven assets. However, their correlation can shift. Currently, with gold showing weakness and the DXY showing strength, it suggests a broader 'risk-off' sentiment might be at play, which would typically pressure Bitcoin as well. If gold were to rebound significantly, it might signal a shift back towards safe-haven demand, which could indirectly benefit Bitcoin if it's perceived as a digital alternative. However, the current price action around $66,952 for BTCUSD seems more influenced by its correlation with risk assets like equities and the dollar's strength.
The market is currently in a state of flux, with conflicting signals from technical indicators and a lack of clear fundamental catalysts. The price of BTCUSD around $66,952 reflects this uncertainty. While short-term traders might find opportunities within the tight range, longer-term investors should await clearer directional confirmation. The upcoming week's economic data releases and any significant shifts in institutional sentiment will be crucial in determining Bitcoin's next move. Patience, discipline, and a focus on risk management are essential for navigating this period of consolidation and preparing for future opportunities.
The resilience of the Bitcoin network itself remains a strong underlying factor. Despite price fluctuations, the hash rate continues to indicate a secure and robust network, a crucial element for long-term value. Coupled with ongoing developments in DeFi and the potential for further institutional adoption, the fundamental case for Bitcoin remains intact, even if short-term price action is choppy around $66,952. It is this combination of evolving utility and macroeconomic uncertainty that creates the current trading environment. The ability to discern between short-term noise and long-term trends will be the hallmark of successful trading and investing in the current market conditions.
The current price action around $66,952 for BTCUSD suggests a market in equilibrium, but one that is poised for movement. The mixed technical indicators, ranging from neutral RSI readings to bearish daily MACD signals, highlight the indecision. The critical support at $66,834 and resistance at $66,961 on the hourly chart are immediate reference points. However, the broader context provided by the daily chart's weak ADX (19.17) and bearish RSI (43.36) indicates that a significant trend is yet to be established. Therefore, a strategy focused on waiting for a confirmed breakout above key resistance levels or a decisive breakdown below support, supported by increased volume and clearer macroeconomic signals, would be the most prudent approach. The market is currently a tightrope walk, and confirmation will be key before taking significant directional bets.
The ongoing narrative surrounding Bitcoin's role in a diversified investment portfolio continues to evolve. As institutional interest grows, and products like ETFs become more established, Bitcoin is increasingly being assessed not just as a speculative asset but as a component within broader asset allocation strategies. This institutional lens can lead to different trading dynamics compared to retail-driven markets. The current consolidation around $66,952 could be seen as a period where institutions are reassessing their positions in light of macro data and regulatory developments. The clarity that emerges from these factors will significantly influence Bitcoin's future price trajectory, moving it beyond purely speculative trading and towards a more established asset class. The market is at a critical juncture, and the interplay of these forces will shape the coming weeks.
The technical indicators provide a mixed bag of signals, typical for a market consolidating around a significant price level like $66,952. On the 1-hour chart, the RSI at 51.95 is neutral, while the MACD shows positive momentum. However, the ADX at 17.58 suggests a weak trend, implying that any short-term moves may lack follow-through. The daily chart paints a slightly more bearish picture, with an RSI of 43.36 indicating downward pressure and a negative MACD signal. This technical divergence underscores the need for caution. A break above the immediate 1-hour resistance at $66,961, confirmed by daily momentum, could signal upside potential towards the 4-hour resistance at $67,219.67. Conversely, a break below the 1-hour support at $66,834 could lead to a retest of lower levels, with the daily support cluster around $65,559 being a key area to watch. The current price point is a critical pivot, and confirmation will be vital.
The influence of macroeconomic data releases in the upcoming week cannot be overstated. With the DXY holding firm around 99.68 and equity markets showing mixed performance, any deviations in US employment or inflation data could trigger significant volatility. For instance, stronger-than-expected jobs numbers could reinforce the 'higher for longer' narrative for interest rates, potentially pressuring BTCUSD. Conversely, weaker data might fuel hopes for rate cuts, providing a tailwind for risk assets. Traders should closely monitor these releases as they could be the catalysts needed to break Bitcoin out of its current consolidation phase around $66,952 and establish a clearer trend. The market is highly sensitive to these macro signals, and any surprises could lead to rapid price adjustments.
The ongoing developments within the broader crypto ecosystem, such as innovations in Layer 2 solutions and the competitive landscape for wrapped Bitcoin products, contribute to the long-term value proposition of digital assets. While these fundamental improvements may not immediately move the spot price of BTCUSD at $66,952, they are crucial for the sustainable growth of the crypto market. A robust and expanding ecosystem enhances utility and adoption, providing a solid foundation for future price appreciation. The current consolidation phase can be seen as a period where the market digests these underlying strengths against the backdrop of macroeconomic uncertainty and short-term technical signals.
The recent news highlighting the divergence in corporate Bitcoin holdings is a significant indicator of institutional sentiment. While some are selling at a loss, others are holding firm, suggesting a divided market among major players. This lack of a unified institutional view contributes to the current price consolidation around $66,952. A clear trend will likely emerge only when there is a more cohesive stance from these large holders, either through coordinated accumulation or significant sell-offs. Until then, price action may remain range-bound, dictated by short-term technicals and macroeconomic fluctuations. The market is waiting for a decisive signal from the institutional side to break this stalemate.
BTCUSD is currently trading at a critical juncture around $66,952, characterized by mixed technical signals, uncertain institutional sentiment, and a cautious macroeconomic outlook. The narrow trading range on the hourly chart, with support at $66,834 and resistance at $66,961, highlights the market's indecision. While short-term opportunities may exist, a clearer directional bias is needed for significant moves. The upcoming week's economic data releases and any shifts in institutional flows will be key catalysts. For now, patience, risk management, and a focus on confirmed breakouts or breakdowns are the most prudent strategies.
The market is currently in a delicate balance, with BTCUSD trading at $66,952. Technical indicators offer conflicting signals, and institutional sentiment appears divided. The upcoming week's economic data releases, particularly from the US, hold the potential to be significant catalysts. Traders should remain vigilant, focusing on risk management and waiting for clear confirmation of a trend before committing to large positions. The market always presents opportunities, but patience and discipline are key to navigating these periods of consolidation and uncertainty.
Frequently Asked Questions: BTCUSD Analysis
What happens if BTCUSD breaks below the $66,834 support level?
A break below $66,834 on the 1-hour chart could trigger further selling pressure, potentially testing the $66,658.67 support on the 4-hour timeframe. This would invalidate the current consolidation and signal a move towards lower levels.
Should I buy BTCUSD at current levels of $66,952 given the mixed technical signals?
Given the conflicting indicators and weak trend signals across timeframes, buying at current levels carries significant risk. A more prudent approach would be to wait for a confirmed breakout above resistance or a confirmed hold of support, ideally with increased volume and clearer macroeconomic catalysts.
Is the RSI at 43.36 on the daily chart a sell signal for BTCUSD?
An RSI of 43.36 on the daily chart indicates downward pressure but is not yet in oversold territory. It suggests that bearish momentum is building, but a direct sell signal would typically require confirmation from other indicators like a bearish MACD crossover or a break of key support levels.
How will upcoming US economic data affect BTCUSD around $66,952 this week?
Upcoming US economic data, especially employment and inflation figures, could be major catalysts. Stronger-than-expected data might reinforce 'higher for longer' rates, pressuring BTCUSD, while weaker data could fuel rate cut hopes, benefiting risk assets like Bitcoin. This could be the trigger to break the $66,952 consolidation.
Track markets in real-time
AI-powered analysis, technical indicators and real-time price data.
Join Our Telegram Channel
Breaking market news, AI analysis and trading signals instantly.
Join Channel