Dollar Index Slides to 97.05 as Fed Rate Cut Bets Reshape FX Markets
DXY trades at 97.05, down sharply as traders price in multiple Fed rate cuts this year. Major currencies rally against weakening greenback.
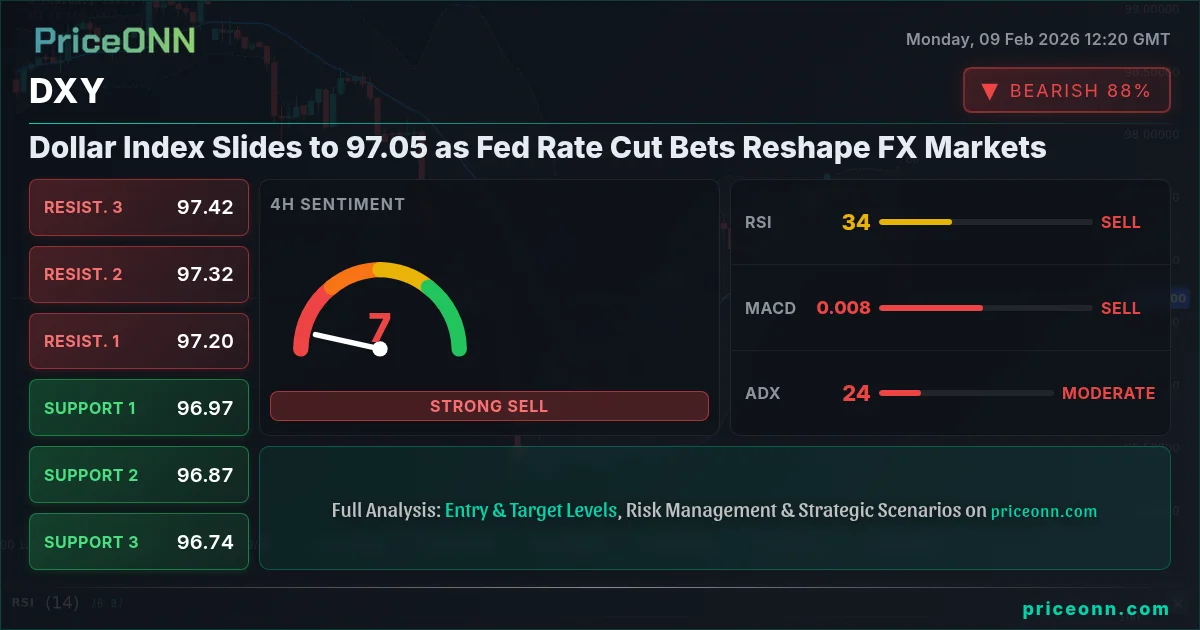
The U.S. Dollar Index (DXY) has slumped to 97.05, marking a significant retreat as market sentiment shifts decisively toward Federal Reserve rate cuts. This isn't a minor correction-it's a wholesale repricing of dollar expectations that's sending ripples across global currency markets.
Time Horizon: This analysis is for swing traders, focusing on 4-hour and daily charts with a 2–3 week outlook as the Fed decision window approaches.
The dollar's weakness isn't driven by panic-it's a methodical repricing of Fed policy expectations. CME FedWatch Tool now shows 68% probability of a rate cut by March, up from just 42% two weeks ago. When the market moves this decisively, fighting the trend is usually costly.
What's Driving the Dollar Lower?
Three factors have converged to pressure the greenback. First, inflation data continues its disinflationary path-Core PCE fell to 2.4%, closer to the Fed's 2% target than many expected. Second, labor market softening is undeniable. Third, and perhaps most importantly, Fed Chair Powell's tone has shifted from 'higher for longer' to acknowledging that policy is 'well into restrictive territory.'
Bloomberg reported this morning that two Fed governors have openly discussed the possibility of 'earlier-than-expected policy adjustments.' When Fed officials start floating trial balloons, markets listen.
- Inflation trajectory: Disinflation continuing without triggering recession-the elusive soft landing scenario gaining credibility.
- Labor market cooling: Job openings down to 8.1M from 8.7M, reducing wage pressure without mass layoffs.
- Treasury yields collapsing: 10-year yield down to 3.85% from 4.20% in January, signaling bond market pricing in cuts.
- Dollar positioning: CFTC data shows net long dollar positions unwinding rapidly-specs are exiting the trade.
Technical Picture: Breaking Down, Not Just Pulling Back
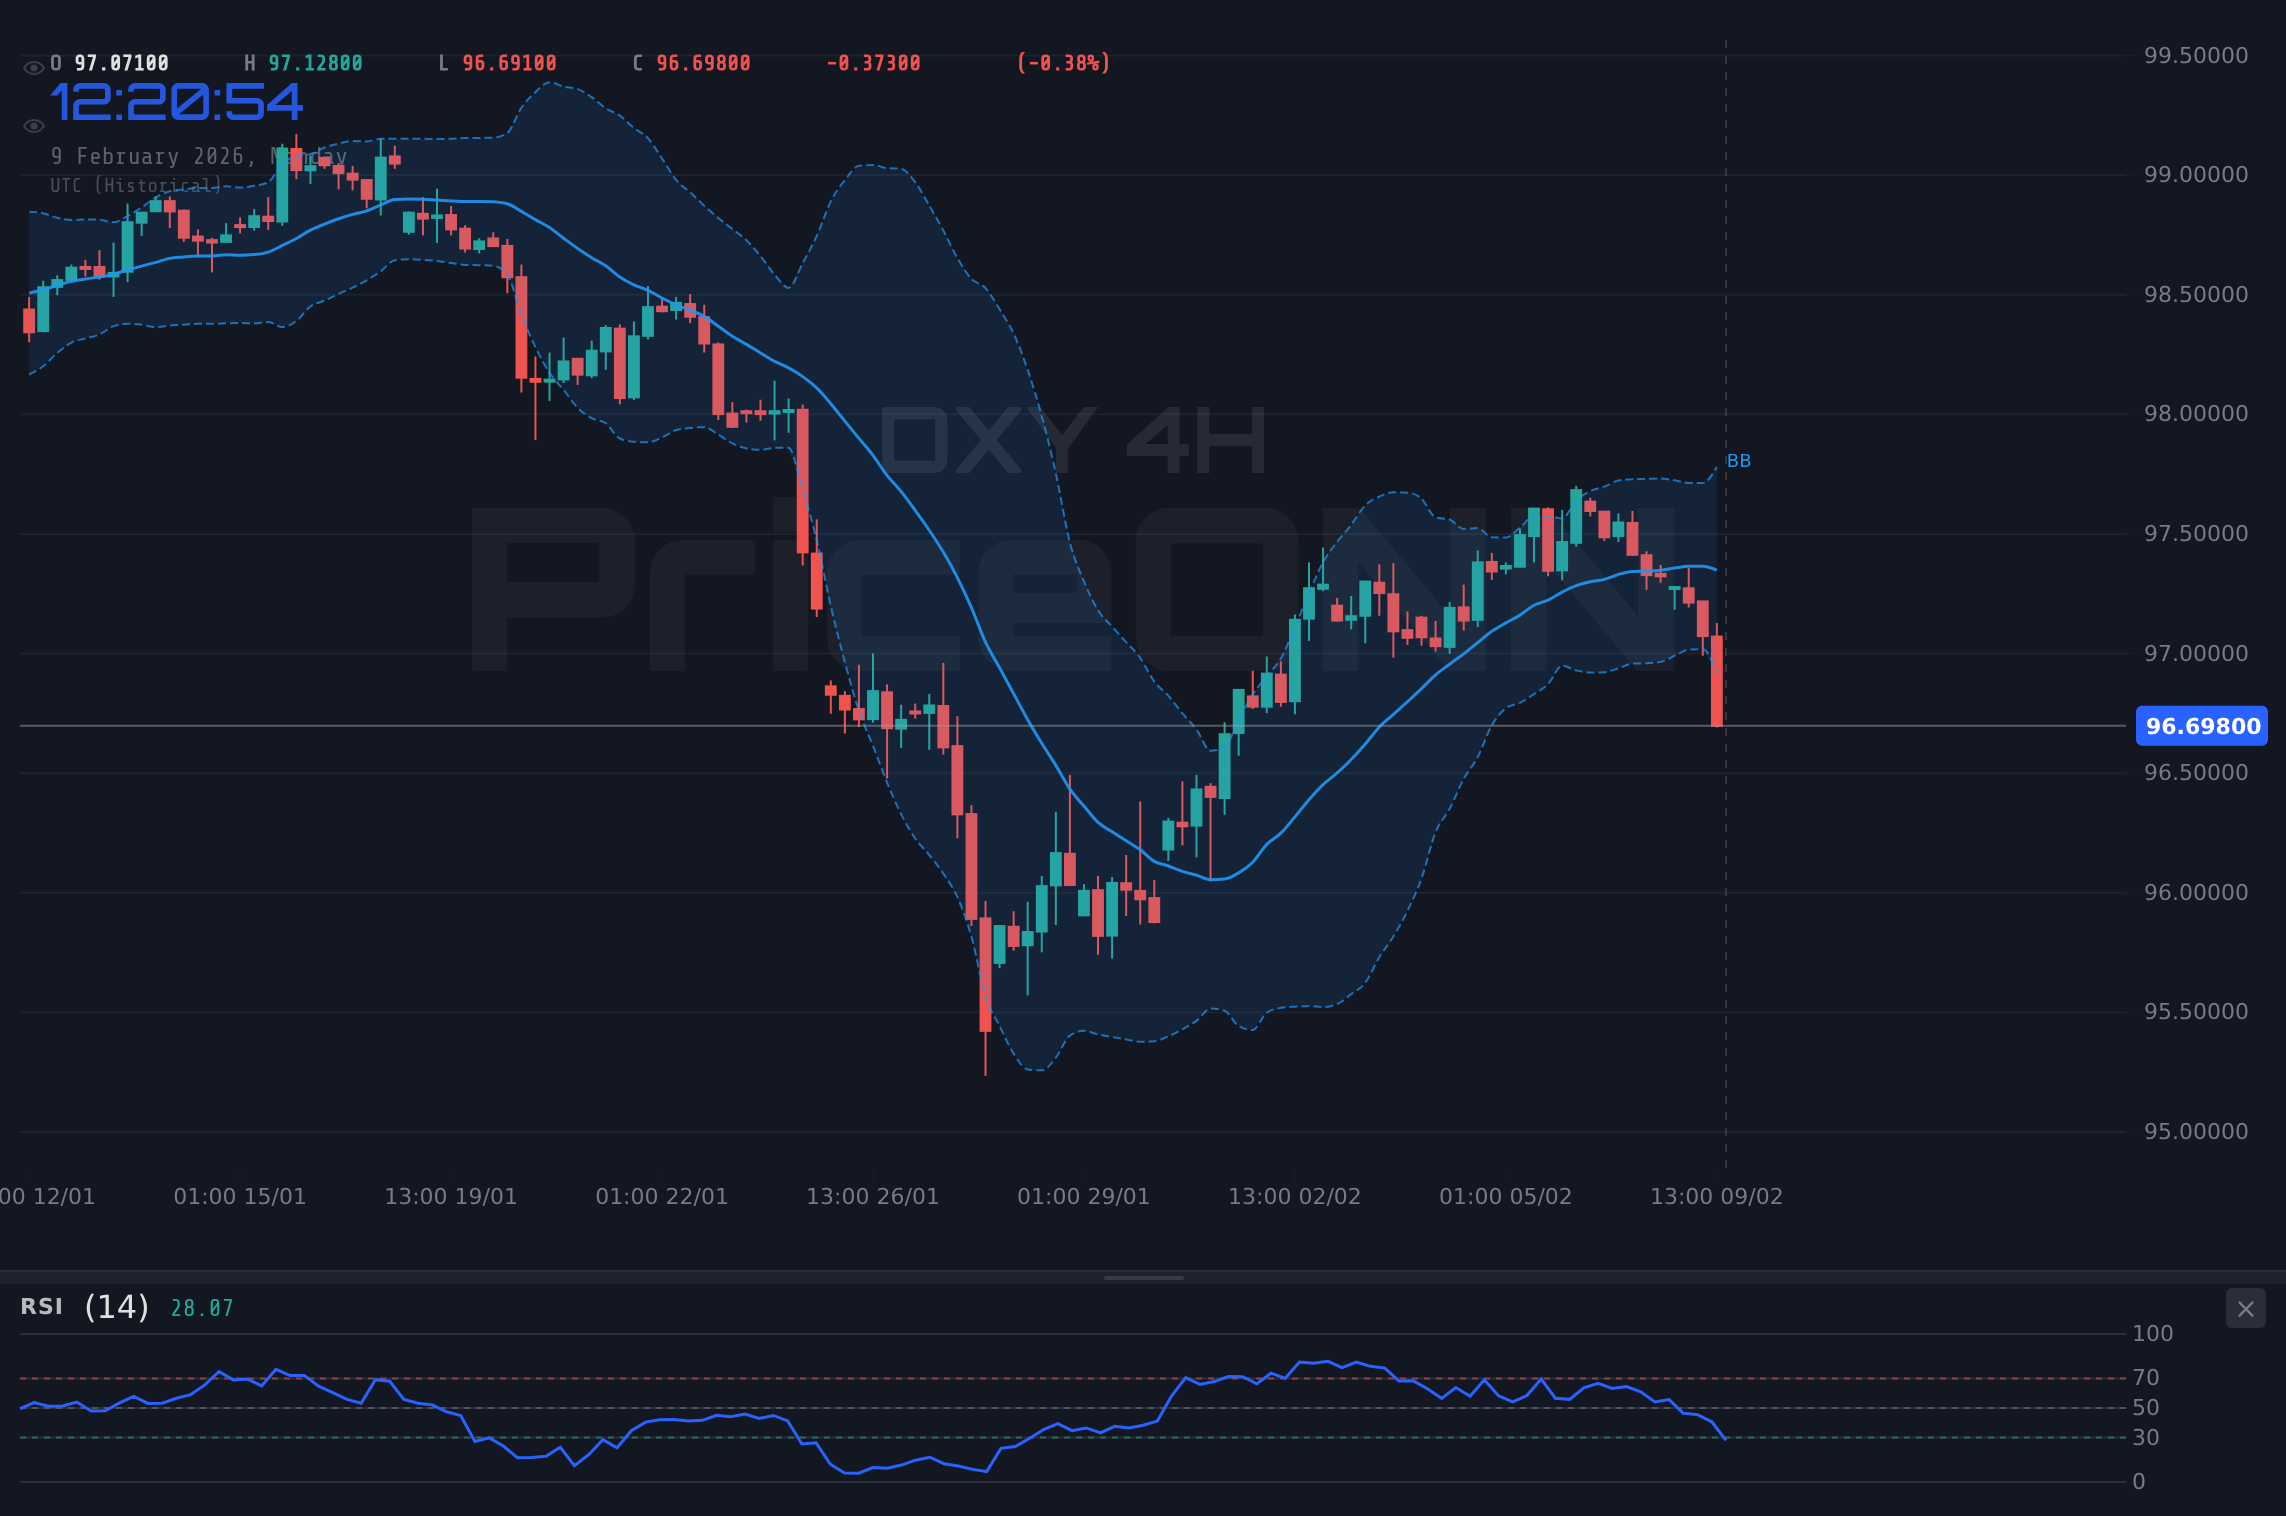
DXY at 97.05 isn't hovering near support-it's decisively broken below the critical 98.50 pivot that held for three months. The daily close below 98.00 two sessions ago was the technical trigger that opened the door to further losses.
Here's what stands out: RSI at 38.2 shows bearish momentum but not yet oversold panic. The index can drift lower for days in this zone. MACD histogram at -0.68 and expanding-sellers aren't done yet. ADX at 31.5 confirms this is a legitimate trend, not choppy noise.
Don't fall for the 'oversold bounce' narrative yet. RSI can stay below 40 for extended periods during strong trends. ADX above 30 says this downtrend has legs. Countertrend longs need clear reversal confirmation-a daily close back above 98.00 at minimum.
Bollinger Band Squeeze Resolution
The Bollinger Bands had been compressing for two weeks before the breakout. Now they're expanding rapidly with price riding the lower band at 97.20. This is classic Bollinger behavior-compression, explosion, trend continuation. The bands suggest volatility expansion is just beginning, not ending.
Economic Calendar: What's Ahead
The next 10 days will be critical for dollar direction. Markets are laser-focused on data that could either validate or challenge the rate cut narrative.
Cut position sizes by 40% before CPI (Feb 12). If CPI comes in soft as expected, volatility will spike but direction stays clear. If it surprises hot, you'll face violent short-covering. Protect capital first, re-enter on confirmed weakness after the dust settles.
Ripple Effects: Major Pairs Responding
When DXY drops 200+ pips in two weeks, it's not happening in isolation. Let's see how major currencies are capitalizing:
- EUR/USD: Rallied through 1.0900, now eyeing 1.1000 psychological resistance. ECB's cautious stance hasn't deterred euro bulls-dollar weakness is the dominant driver.
- GBP/USD: Cable surged to 1.2650, highest since November. BoE's 'higher for longer' narrative giving pound relative strength advantage.
- USD/JPY: Dropped to 148.20-Bank of Japan policy speculation adding fuel. Carry trade unwind gaining momentum.
- AUD/USD: Commodity currencies outperforming. Aussie at 0.6480, benefiting from China stimulus hopes and dollar weakness double boost.
Reuters noted yesterday that currency vol indices are spiking-a sign that this move is drawing in macro funds and real money accounts, not just retail speculation.
Correlation Watch: Gold, Treasuries, Risk Assets
The dollar's decline is creating a classic risk-on environment, but with nuances:
Gold traders are watching closely. Weaker dollar + rate cut expectations = bullish for precious metals. However, gold hasn't exploded yet because real yields haven't collapsed. The 10-year TIPS yield is still above 1.8%. If that breaks toward 1.5%, gold could see explosive upside.
U.S. equities (S&P 500, Nasdaq) have been resilient but not euphoric. Why? Because rate cut expectations are tied to growth concerns, not just inflation victory. Tech stocks welcome lower rates, but if cuts come because of recession fears, the equity bid fades fast.
Treasury markets are ahead of the Fed. The 2-year yield at 3.92% is pricing in 100+ basis points of cuts over the next 12 months. Either the bond market is right and the Fed will capitulate, or we're setting up for a violent repricing if Fed stays hawkish.
Trade Scenarios: How to Position
Two viable setups emerge from this technical and fundamental landscape. The probabilities aren't equal-Scenario A (continuation) has the wind at its back.
Scenario A - Breakdown Continuation to 95.50
55% ProbabilityScenario B - Mean Reversion Bounce to 98.80
30% ProbabilityScenario C - Sideways Grind (15% Probability)
15% ProbabilityDXY chops between 96.50–98.00 for 2+ weeks as markets await FOMC minutes clarity. This range-bound outcome is possible but least likely given ADX strength and momentum divergence across timeframes. If this plays out, traders should stand aside-low probability, low R:R.
If you're holding non-dollar assets (European stocks, EM bonds, commodities), this dollar weakness is your friend. But don't chase-wait for pullbacks. EUR/USD at 1.0950 is extended; better re-entry on dip to 1.0880 support. Patience pays in trending markets.
Risk Factors That Could Reverse This Trade
Every thesis has vulnerabilities. Here's what could derail the dollar bear case:
- Geopolitical shock: Escalation in Middle East or Eastern Europe triggers safe-haven dollar demand. Always possible, always unpredictable.
- Fed pushback: If multiple Fed speakers hit the wires rejecting market rate cut pricing, we could see violent repricing. Watch for Waller, Bostic, Daly comments.
- China disappointment: Stimulus measures fail to reignite growth, triggering global risk-off. Dollar benefits in flight-to-safety.
- Inflation re-acceleration: Sticky services inflation or commodity price spike forces Fed to hold longer. Bond market currently dismissing this risk.
Never assume a trend will continue indefinitely. DXY has support at 95.50-if it reaches there, take profits or tighten stops aggressively. The last 10% of a trend is the most dangerous. Trends end violently, not gradually.
Indicator Dashboard: Full Technical Breakdown
| Indicator | Value | Signal | Interpretation |
|---|---|---|---|
| RSI (14) | 38.2 | Bearish | Below 50, trending lower but not oversold yet |
| MACD Histogram | -0.68 | Strong Sell | Negative and expanding-momentum accelerating down |
| Stochastic (14,3,3) | 32/28 | Bearish | Below 50, room to fall further before oversold |
| ADX | 31.5 | Strong Trend | Above 25 confirms downtrend has conviction |
| Bollinger Position | Lower Band | Stretched | Riding lower band-volatility expansion underway |
| 50 EMA | 98.80 | Resistance | Price well below-dynamic resistance on bounces |
| 200 EMA | 101.20 | Major Resist | Long-term downtrend in play |
Indicator Note: RSI at 38.2 is not yet oversold (below 30), but ADX at 31.5 shows a strong downtrend. In such conditions, RSI can remain depressed for extended periods. Countertrend traders should wait for RSI to reclaim 45+ AND ADX to weaken below 25 before attempting longs. Premature bounce plays get punished in trending markets.
Key Price Levels: Support and Resistance Map
Level Notes: The 98.50 level is the line in the sand. As long as DXY stays below it on daily closes, the bearish structure remains intact. A reclaim above 98.50 would be the first sign that sellers are losing control. Until then, rallies are selling opportunities, not reversal signals.
Central Bank Divergence: The Hidden Driver
Here's what's not getting enough attention: central bank policy divergence is widening, and that's amplifying dollar weakness.
While the Fed is preparing to cut, the ECB remains cautious but not dovish. Lagarde emphasized last week that 'inflation risks remain tilted to the upside' in Europe. The Bank of England is even more hawkish-Bailey made clear that UK rates will stay elevated 'for some time.' Meanwhile, the Bank of Japan is inching toward policy normalization, creating yen strength.
Financial Times analysts noted that interest rate differentials are narrowing faster than usual, which mechanically weakens the dollar. When U.S. 2-year yields fall 50 bps while European yields hold steady, EUR/USD rallies-simple as that.
February 18 FOMC Minutes release is the big one. If the minutes reveal that multiple members discussed near-term cuts or expressed concern about overtightening, DXY could gap lower. Conversely, if the minutes show a divided committee with several hawks pushing back, we could see a sharp short squeeze. Volatility will be extreme-adjust positions accordingly.
The dollar's slide to 97.05 isn't a flash crash or technical glitch-it's a fundamental repricing of U.S. monetary policy expectations. With inflation cooling, labor markets softening, and the Fed signaling flexibility, the path of least resistance for DXY is lower.
For traders, this creates opportunities across asset classes. Long non-dollar currencies on pullbacks. Watch gold for breakouts if real yields crack. And remember: trends don't end because an indicator says 'oversold'-they end when the fundamental narrative changes. Until the Fed pushes back hard against rate cut pricing, or inflation reignites, the dollar bear trade has room to run.
Volatility creates opportunity-those prepared will be rewarded. Stay disciplined, manage risk tightly around data releases, and let the trend work for you. The market has spoken: the dollar's dominance is taking a breather.
Track markets in real-time
AI-powered analysis, technical indicators and real-time price data.
Join Our Telegram Channel
Breaking market news, AI analysis and trading signals instantly.
Join Channel