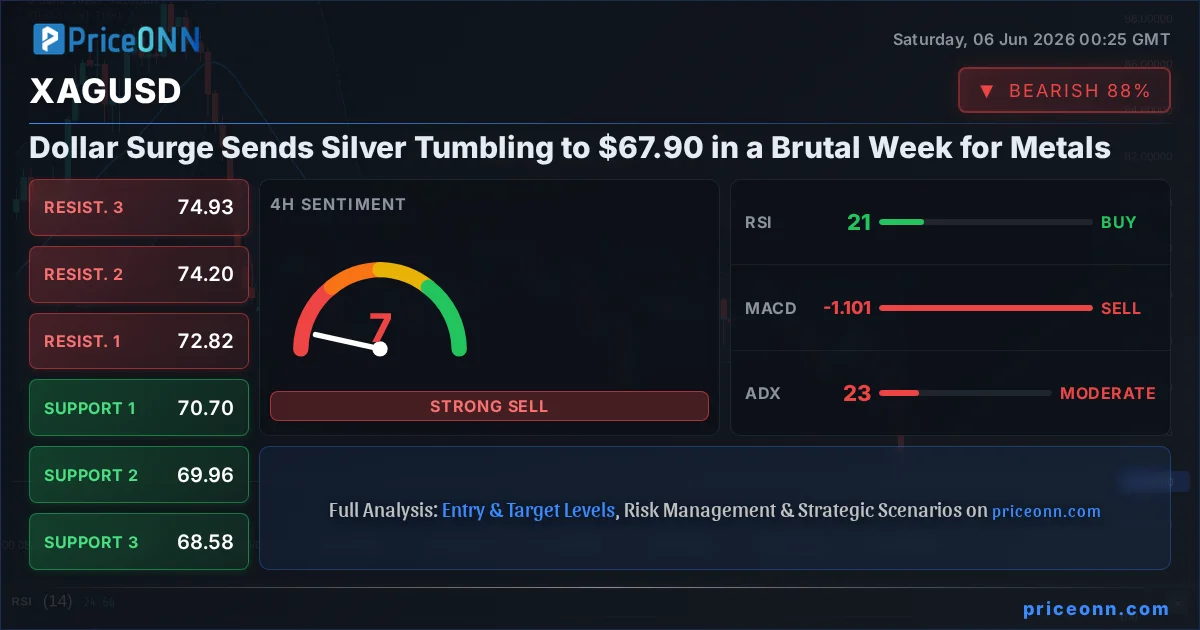
Earlier in the week, silver looked untouchable. By Friday's close, it looked like a wreck. XAGUSD finished at $67.90, down a punishing 6.58% on the session and carrying the scars of a slide that tore through every level bulls assumed was safe. So here is the question that every honest XAGUSD weekly outlook has to answer: was this the start of something darker, or the kind of capitulation that quietly lays the foundation for the next leg up?
This is a fight, plain and simple. On one side stand the bargain hunters, staring at an RSI reading buried in the teens and muttering "this is the dip." On the other side stand the momentum sellers, who just watched the dollar smash through resistance and have zero interest in catching a falling knife. Both camps have a case. Both camps have data. Let's put them in the ring and let the price action referee.
- XAGUSD closed the week at $67.90, down 6.58% on Friday alone, after probing the $75 zone earlier in the week; the gold-silver ratio sits near 64 as silver underperforms gold's milder 2.4% drop.
- The hourly RSI is pinned at 18.91 and Stochastic at K=5.25 / D=8.29, both screaming oversold, while ADX at 53.14 confirms one of the strongest downtrends the chart has printed all year.
- First support that still sits below price is $67.84, then $67.44 and $66.90; the bulls' first real hurdle is resistance at $68.77, followed by $69.31 and $69.71.
- A surging Dollar Index at 99.80 (up 0.57%, RSI 80.95) is the engine behind the metals selloff, and next week's Fed countdown plus US inflation data will decide whether the pressure eases or intensifies.
Time Horizon: This is a weekend review built for swing traders and position players planning the week ahead. Markets are closed; every level below is drawn from Friday's close, not live trading.
The Week That Snapped Silver's Momentum
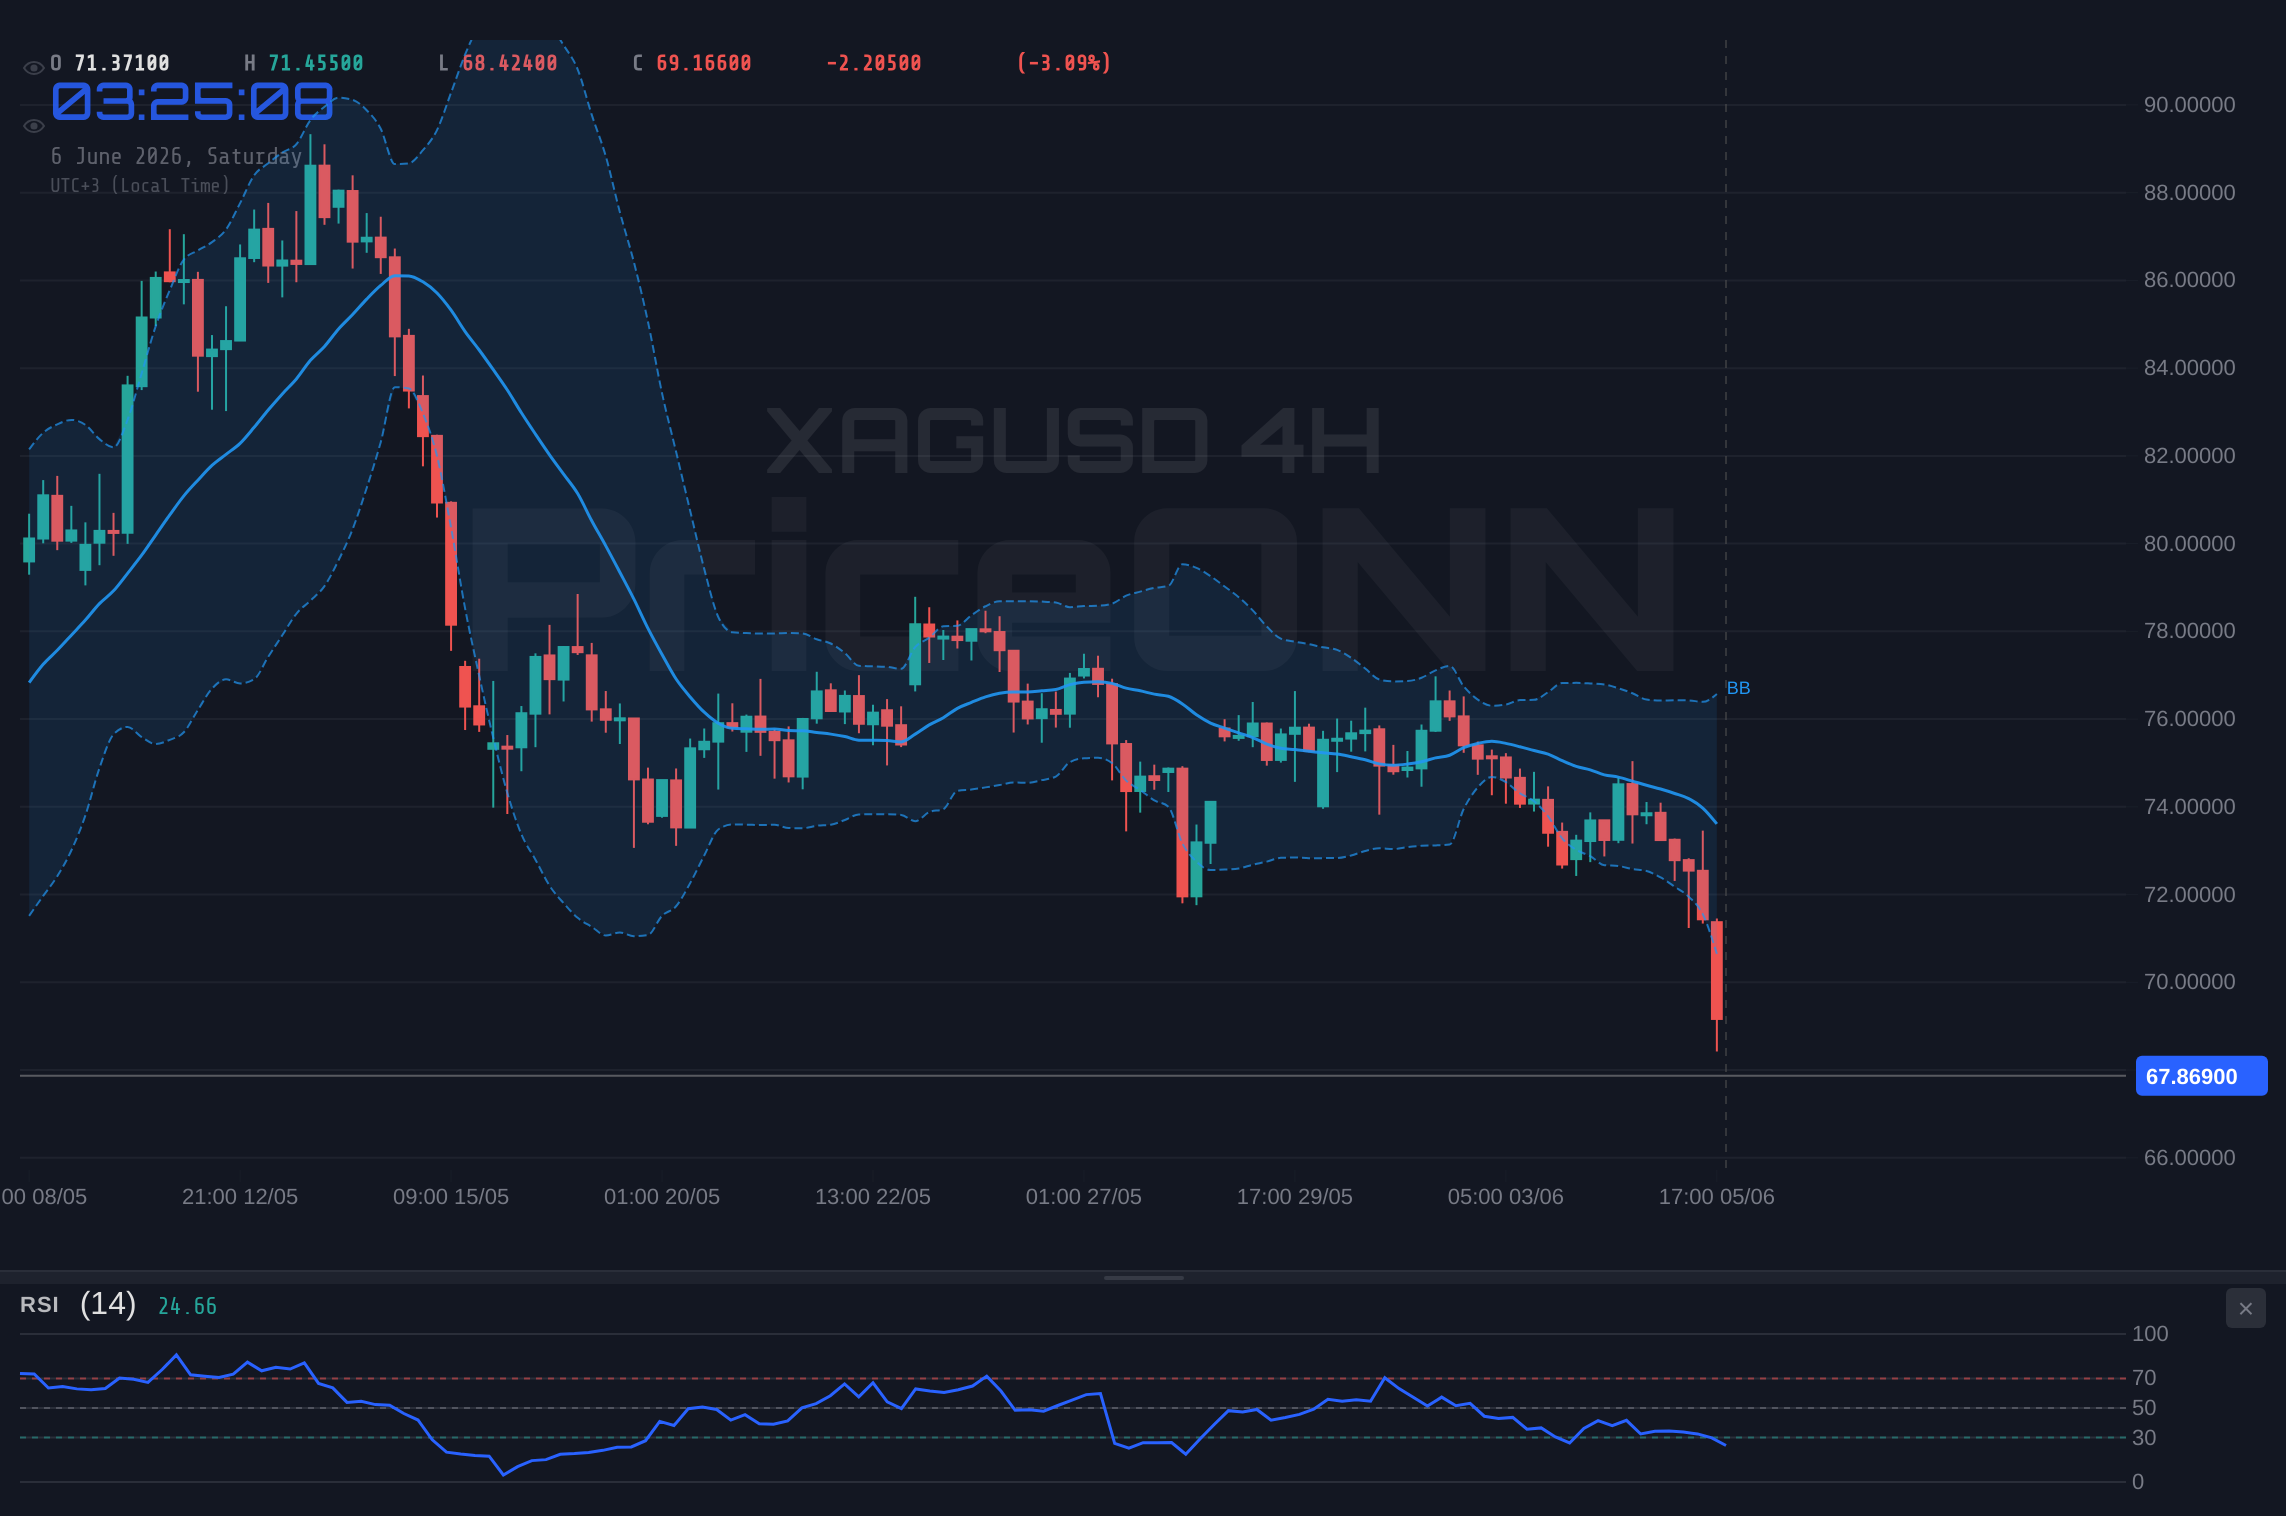
Let's set the scene before the bulls and bears start swinging. Silver spent the early part of the week flirting with the mid-70s, tagging a high around $75.04 and looking every bit like a market that wanted higher. Then the floor gave way. Friday's session was a textbook liquidity grab to the downside: stops below the low-70s were swept, the move accelerated, and XAGUSD bled roughly $4.78 in a single day to settle at $67.90. That is a 6.58% daily decline, and for context, gold fell only 2.4% over the same stretch. Silver did what silver always does; it moved twice as violently as its yellow cousin in both directions.
The gold-silver ratio tells the story in one number. With gold at 4,327.75 and silver at 67.90, the ratio sits near 64. When silver leads a rally, that ratio compresses; when fear and dollar strength dominate, silver gets dumped first and hardest, and the ratio expands. This week it expanded. That is the signature of a risk-off purge, not an orderly rotation, and it matters for how we read everything that follows.
This was not an isolated metals story either. Brent crude cratered 5.24% to $95.65, WTI dropped 6.21% to $91.75, and even ethereum got obliterated, sliding 9.94% to $1,596.38. When commodities and high-beta assets all bleed together on the same day, the common denominator is almost always one thing: the dollar. And the dollar had a monster week.
The Bull Case for XAGUSD After the Washout
Start with the most obvious argument the bulls own: this market is stretched to a breaking point on the downside. The hourly RSI sits at 18.91. Readings under 20 are rare, and they tend not to last. Historically, when silver's short-term RSI plunges this deep, the metal is closer to a reflex bounce than a fresh leg lower, because the selling has already exhausted the willing sellers. Stack the Stochastic on top of that, pinned at K=5.25 and D=8.29, and you have an oscillator picture that looks like a coiled spring. Bargain hunters live for exactly this kind of reading.
The 4-hour chart reinforces the oversold thesis. RSI there reads 21.17, still firmly in oversold territory, and price has pierced the lower Bollinger Band, which often marks the point of maximum pessimism rather than the start of an open-ended collapse. Bulls will point out that the daily RSI, at 34.96, has not even reached oversold yet, which leaves room for a snap-back without the bigger trend being threatened. In their eyes, $67.90 is the kind of level where smart money starts scaling into a beaten-down asset that the market has temporarily left for dead.
There is also a structural argument. The very first support beneath the close, at $67.84, held into Friday's bell. The next shelves at $67.44 and $66.90 give bulls a tight, well-defined zone to lean against. If buyers can defend the $66.90 to $67.84 band early next week, the case for a relief rally toward the $68.77 resistance, and possibly $69.31, becomes credible. Silver's history is littered with these violent shakeouts that resolve into sharp recoveries once the dollar pauses for breath.
An hourly RSI of 18.91 paired with a Stochastic %K of 5.25 is the kind of confluence that precedes mean-reversion bounces. If the dollar's rally stalls on profit-taking, silver is positioned to be the fastest mover off the floor.
Finally, bulls lean on the longer-term fundamental backdrop. Silver is not just a precious metal; it is an industrial one, with deep ties to solar, electronics, and electrification demand. A panic-driven 6.58% repricing does nothing to the structural demand story. If anything, lower prices invite physical buyers and long-term accumulators who do not care about an hourly candle. For them, a sub-$68 print is an opportunity to build exposure at a discount that did not exist a week ago.
The Bear Case: Why $67.90 May Not Be the Floor
Now the other corner, and the bears have the heavier punches right now. The single most important number on the entire chart is the ADX at 53.14 on the hourly. That is not a "weak trend that could flip" reading; that is a freight train. An ADX above 50 tells you the downtrend has conviction, momentum, and follow-through. Trying to buy into a trend this strong simply because the RSI looks oversold is how accounts get vaporized. Oversold can stay oversold for a long time when the trend is this dominant.
The bears also own the momentum picture. The MACD is negative and sitting below its signal line across the hourly, 4-hour, and daily timeframes; there is no bullish divergence flashing, no crossover hinting at a turn. On the daily chart, price has closed below the lower Bollinger Band, and the daily Stochastic, at K=20.24 versus D=46.44, still points lower with %K beneath %D. The overall signal scoreboard is brutal: the daily timeframe reads SELL with eight bearish signals and zero bullish ones. That is about as one-sided as a technical read gets.
Here is the most uncomfortable detail for bulls. Every meaningful support level on the 4-hour and daily charts now sits above Friday's close. The 4-hour support shelf at $68.58 and the daily supports at $69.04, $70.82, and $71.75 have all been violated and flipped into overhead resistance. When a market knifes below its entire support structure in a single session, those old floors become ceilings. That is exactly why the bears argue the path of least resistance points toward $67.44 and then $66.90, the only support levels left standing beneath the current price.
ADX at 53.14 plus a clean break below the 4-hour and daily support structure means this is a trend-following environment, not a dip-buying one. Until the dollar cools, every bounce risks becoming a fresh selling opportunity.
And then there is the dollar, which is really the bears' whole thesis in one chart. More on that next, because you cannot understand silver's collapse without understanding what the greenback just did.
Why the Dollar's Breakout Is the Real Story for XAGUSD
Silver is priced in dollars, so when the dollar rips higher, silver mechanically gets cheaper, and right now the Dollar Index is ripping. The DXY closed at 99.80, up 0.57% on the day, with the hourly trend reading a maximum-strength uptrend. Its hourly RSI is at 80.95 and the daily signal board is a clean sweep: eight buy signals, zero sells. When the dollar's daily read is that bullish and silver's daily read is that bearish, you are looking at two sides of the same trade. The metal did not fall in a vacuum; it fell because the dollar took the elevator up.
The catalyst was fundamental. According to coverage from the back half of the week, the dollar strengthened broadly after a much stronger-than-expected US employment report, with USD/JPY clearing the 160 handle as traders concluded the Federal Reserve has every reason to stay patient on rate cuts. A robust labor market means the Fed is in no hurry to ease, real yields stay elevated, and non-yielding assets like silver lose their relative shine. That is the macro chain reaction that turned a soft tape into a 6.58% rout.
For traders running multi-timeframe analysis, the cross-asset confirmation is hard to ignore. Gold's parallel 2.4% drop, crude's collapse, and the broad commodity weakness all line up with a single driver: a hawkish repricing of Fed expectations on the back of strong jobs data. As long as that narrative holds, the dollar has the wind at its back, and silver fights an uphill battle. The bears do not need silver-specific bad news; they just need the dollar to keep doing what it is doing.
But here is the nuance that keeps this from being a slam dunk. The DXY's hourly RSI at 80.95 is deeply overbought, and the daily Stochastic at K=84.14 is stretched. A dollar that is this extended is vulnerable to a pullback, and the moment the greenback exhales, oversold silver is primed to bounce hard. That is the tension the entire next week hinges on: an exhausted seller in silver versus an exhausted buyer in the dollar, each waiting for the other to blink.
What Different Traders Should Watch Into Next Week
The read changes depending on your time horizon, so let's break it down. For the short-term scalper, the hourly oversold readings are a magnet for quick mean-reversion trades, but the 53.14 ADX is a flashing warning that any bounce can be sold aggressively. Scalpers should treat $67.84 and $67.44 as decision points and not assume a single green candle ends the downtrend.
The swing trader has the cleaner setup to wait for. The smart play is patience: let the dollar's overbought condition resolve and watch whether silver can reclaim $68.77 on a closing basis. A swing long has no technical confirmation until that first resistance flips back to support. Conversely, a swing short remains the higher-probability side as long as price stays capped below $68.77 and the daily MACD holds negative.
The long-term position trader cares less about the hourly noise and more about whether the structural floor near $66.90 holds. For accumulators, a violent washout to deep oversold is historically where value appears, but they should size for the reality that the daily trend has not yet flipped bullish. The discipline here is simple: scale in, do not lunge, and let the weekly close tell you whether the worst is over.
The single cleanest confirmation signal next week is the $68.77 level. A decisive hourly close back above it would tell you the oversold bounce has teeth. Failure there keeps the bears firmly in control and reopens $67.44 and $66.90 as targets.
The Fed Countdown and the Data That Decides Silver's Fate
Fundamentals will drive the next move more than any oscillator, and the calendar ahead is loaded. Market commentary heading into the weekend framed it bluntly: the Fed countdown has begun, with incoming US inflation data positioned to reshape rate expectations just as Fed Chair Warsh approaches his first meeting. That combination is exactly the kind of event risk that can either supercharge the dollar or knock it off its perch.
Here is the logic chain silver traders need to map. If next week's US inflation prints come in hot, it reinforces the strong-payrolls narrative, cements Fed patience, lifts the dollar further, and piles more pressure on XAGUSD; in that scenario, $67.44 and $66.90 come into play quickly. If inflation surprises to the downside, the entire hawkish trade unwinds, the overbought dollar finally corrects, and silver's deeply oversold setup becomes the fuel for a rapid snap-back toward $68.77 and beyond. The data is the gatekeeper, and right now it is firmly in control of the wheel.
On the high-impact USD docket, the upcoming releases carry forecasts that traders are already positioning around, including a consumer confidence figure pegged near 110 against a prior 109 and a services activity reading around 53.6. The actual numbers are what matter; a string of beats keeps the dollar bid, while misses give the metals bulls their opening. Geopolitical risk is the wildcard layered on top: the same week-ahead coverage flagged elevated risk premia, and any flare-up that drives safe-haven demand could complicate the dollar-strength story and put a surprise bid under silver.
The Verdict: Who Wins the $67.90 Standoff?
So who takes this round? Honest answer: the bears are still landing the cleaner blows, but the bulls are loading up for a counterpunch. The weight of evidence right now favors the downside. A 53.14 ADX, a clean break below the entire 4-hour and daily support structure, negative MACD across every timeframe, and a dollar in a confirmed uptrend are not signals you fade lightly. The trend is down, and the trend has conviction.
But, and this is the part that keeps it interesting, the rubber band is stretched about as far as it goes. An hourly RSI of 18.91 and a Stochastic near 5 do not stay that way forever, and the dollar driving all of this is itself screaming overbought at an RSI of 80.95. This sets up a classic standoff. The base case is that bears retain control while price stays below $68.77, with $67.44 and $66.90 as the magnets. The reversal trigger is equally clear: reclaim $68.77 on a closing basis, ideally on the back of a dollar pullback or soft inflation data, and the oversold bounce gets real legs.
The thesis that the bears win fails the moment XAGUSD closes back above $68.77 with conviction. The thesis that the bulls win fails if $66.90 gives way and the daily candle closes beneath it. Those are your two lines in the sand, and next week's inflation data will likely be the hand that draws them.
The Trend Continues: Bears Press the Advantage
50% ProbabilityThe Oversold Pause: Range and Repair
30% ProbabilityThe Snap-Back: Dollar Exhaustion Fuels a Bounce
20% ProbabilityFrequently Asked Questions: XAGUSD Analysis
What happens if XAGUSD breaks below $66.90 support?
A daily close below $66.90 would clear the last remaining support beneath Friday's $67.90 close, leaving silver in open air with no nearby technical floor. Given the hourly ADX at 53.14, that kind of break would likely accelerate rather than stabilize, and it is the level that invalidates the bullish snap-back thesis entirely.
Is the RSI at 18.91 a buy signal for XAGUSD right now?
Not on its own. An hourly RSI of 18.91 confirms silver is deeply oversold, but with ADX at 53.14 signaling a powerful downtrend, oversold can persist far longer than dip-buyers expect. The cleaner confirmation is a closing break back above $68.77 resistance, which would suggest the bounce has actually started rather than just being statistically overdue.
Why did silver fall 6.58% while gold only dropped 2.4%?
Silver is a higher-beta metal that historically moves roughly twice as fast as gold in both directions, which is exactly what happened this week as the gold-silver ratio expanded toward 64. The shared catalyst was a surging dollar after strong US payrolls reinforced Fed patience, and in a risk-off dollar spike, silver gets sold first and hardest.
How will next week's US inflation data affect XAGUSD?
Inflation is the gatekeeper for the dollar and therefore for silver. A hot print would reinforce Fed patience, push the Dollar Index higher from 99.80, and pressure XAGUSD toward $67.44 and $66.90; a soft print would unwind the hawkish trade, correct the overbought dollar, and give oversold silver room to rebound toward $68.77 and $69.31.
The week ahead is genuinely binary, and that is what makes it tradable. Mark $68.77 above and $66.90 below, let the inflation data and the Fed countdown resolve the standoff, and remember that the most violent washouts in silver have a habit of planting the seeds for the sharpest recoveries. Patience and discipline win here; the market always offers a second entry to those who wait for confirmation instead of guessing the bottom.
Track markets in real-time
AI-powered analysis, technical indicators and real-time price data.
Join Our Telegram Channel
Breaking market news, AI analysis and trading signals instantly.
Join Channel