
DowJones30 Tests $46,604.50 Resistance Amid AI Job Fears and Geopolitical Tensions
DowJones30 at $46,604.50 faces resistance as AI job displacement fears and Middle East tensions weigh. Technicals show a choppy market.
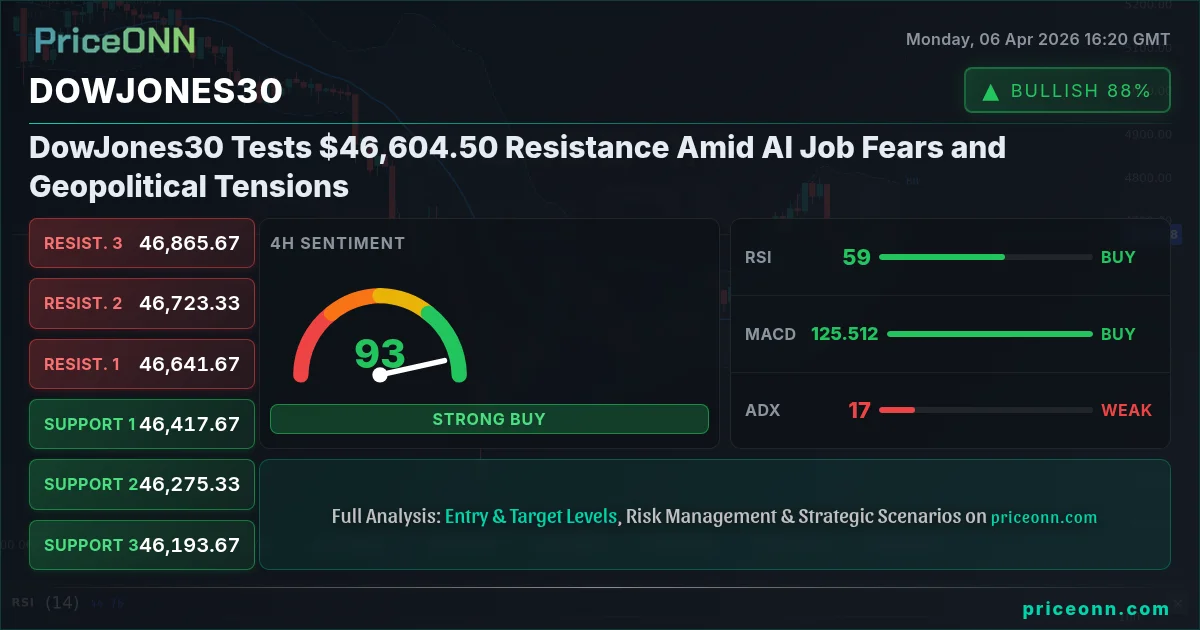
The specter of artificial intelligence automating jobs, coupled with escalating geopolitical tensions and persistent inflation concerns, is creating a complex backdrop for major indices like the DowJones30. As the index hovers around the critical $46,604.50 mark, traders are caught between the relentless march of technological advancement and the age-old anxieties of war and economic instability. This delicate balance is painting a picture of a market at a crossroads, where short-term fluctuations mask deeper, structural shifts.
- The DowJones30 is currently trading at $46,604.50, testing key resistance levels.
- RSI at 63.39 on the 1H chart suggests bullish momentum is present but not yet overbought, while the 1D RSI at 46.77 indicates a cautious approach is warranted.
- Critical resistance sits at $46,707.33, a level that has historically capped upward moves.
- The strength of the US Dollar Index (DXY) at 99.73 is a key factor, potentially pressuring global risk assets.
- AI's dual role as a job disruptor and a driver of economic growth presents a significant dichotomy for market participants.
The narrative surrounding artificial intelligence's impact on the labor market is becoming increasingly prominent. While some envision AI as a catalyst for unprecedented productivity gains and the creation of new, high-skilled jobs, a growing chorus of concern points to widespread job displacement across various sectors. This duality creates a fundamental tension: will AI ultimately boost corporate earnings and drive stock markets higher, or will it lead to social unrest and economic stagnation due to mass unemployment? For the DowJones30, a market historically driven by established industrial and financial giants, the implications are profound. Companies that successfully integrate AI could see significant operational efficiencies and profit margins expand, while those slow to adapt may face obsolescence. This uncertainty is a key driver of market volatility, making it difficult for investors to form a clear, long-term thesis.
Navigating Geopolitical Headwinds
Adding another layer of complexity is the persistent geopolitical uncertainty. The Middle East remains a flashpoint, with ongoing tensions threatening global energy supplies and potentially reigniting inflationary pressures. Crude oil prices, currently seeing Brent at $112.05 and WTI at $111.78, remain sensitive to any escalation. Higher energy costs directly impact corporate bottom lines and consumer spending, creating headwinds for economic growth and, consequently, for stock indices like the DowJones30. The correlation is clear: rising oil prices often coincide with a weaker US Dollar Index (DXY), currently hovering around 99.73, and a general risk-off sentiment that can lead investors to shed riskier assets such as equities in favor of safe-haven assets like gold. This intricate web of correlations means that developments in one corner of the globe can have ripple effects across seemingly unrelated markets.
The Bank of Japan's policy stance also continues to be a point of focus. While other central banks have been tightening monetary policy, the BoJ has maintained its ultra-loose stance. However, speculation about a potential shift, driven by rising inflation in Japan and global monetary policy normalization, is growing. Should the BoJ signal a pivot, it could lead to significant currency market movements, impacting global capital flows and risk appetite. For instance, a stronger Yen could potentially dampen demand for certain Japanese exports, while also affecting carry trades that often involve borrowing in low-yielding currencies like the Yen to invest in higher-yielding assets. This global monetary policy divergence adds another layer of uncertainty to the already complex market environment, influencing decisions across all asset classes.
Technical Picture: A Cautious Stance at Resistance
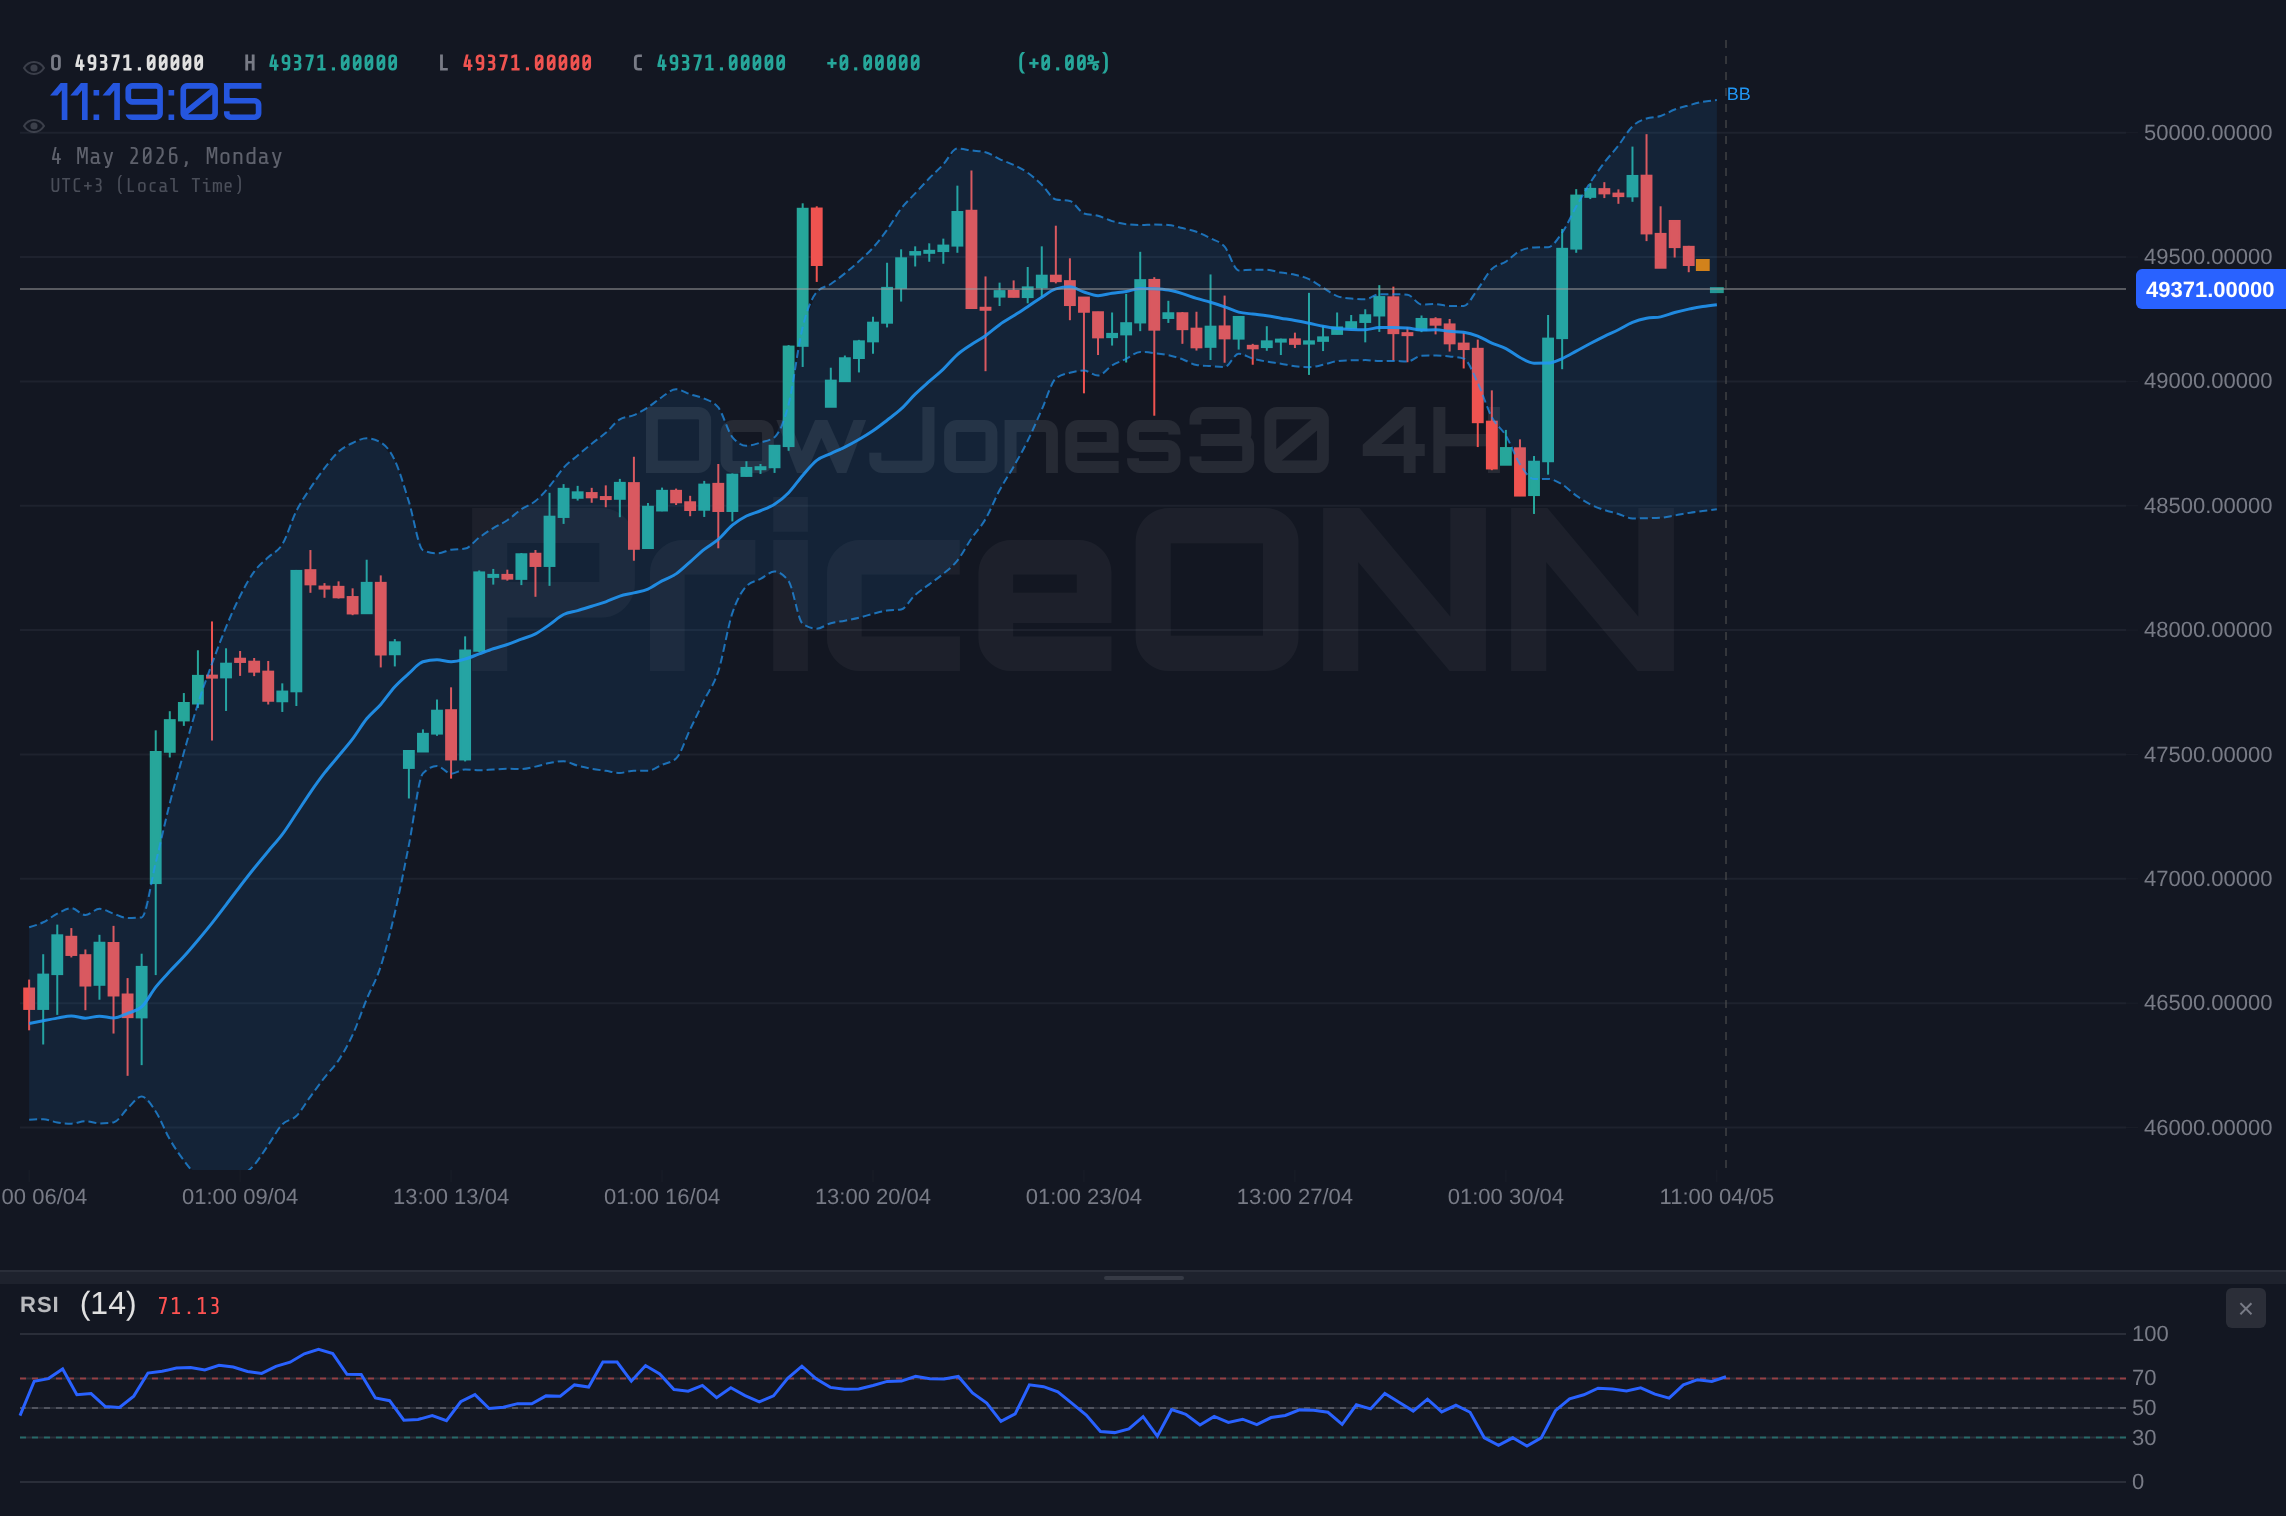
Technically, the DowJones30 is currently at a crucial juncture. On the 1-hour chart, the trend is showing strength, with an ADX reading of 16.14 suggesting a moderate trend is in play. The RSI at 63.39 indicates positive momentum but is not yet in overbought territory, leaving room for further upside. However, the daily chart presents a more cautious outlook. The ADX at 38.29 points to a strong downward trend, and the RSI at 45.77 suggests that while the selling pressure might be easing, the bulls have not yet seized control. This divergence in signals across different timeframes highlights the choppiness of the current market.
The current price of $46,604.50 places the DowJones30 squarely against significant resistance. The daily chart indicates a key resistance level at $46,707.33, with further resistance points at $46,837.67 and $46,978.33. For the index to break out convincingly to the upside, it would need to overcome these levels with significant volume and conviction. The 4-hour chart shows resistance at $46,641.67 and $46,723.33. A failure to break above these immediate resistance levels could signal a continuation of the current consolidation or even a reversal. The market is essentially in a 'watch zone' – a period where significant price action is needed to confirm a direction.
The MACD indicator on the 1-hour chart shows positive momentum, with the MACD line above the signal line, suggesting a potential for short-term gains. However, on the daily chart, the MACD is showing negative momentum, with the histogram below the zero line and the MACD line below its signal line. This conflict in MACD signals across timeframes reinforces the idea of a market that is struggling to establish a clear direction. Traders often look for confluence across multiple indicators and timeframes before committing to a trade. In this environment, patience is paramount, waiting for a clearer signal rather than trying to force a trade in ambiguous conditions.
The ADX reading of 17.41 on the 4-hour chart and 38.29 on the daily chart indicates a lack of strong trend conviction. While the 1-hour chart shows some bullish signs, the broader daily trend suggests caution. A break above the immediate resistance at $46,707.33 is needed to invalidate the bearish bias suggested by the daily indicators.
The AI Factor: Job Creation vs. Destruction
The debate around AI's impact on employment is far from settled. Proponents argue that AI will augment human capabilities, leading to increased efficiency and the creation of entirely new job categories that we can't even conceive of yet. They point to historical technological shifts, such as the Industrial Revolution or the advent of personal computers, which ultimately led to more jobs and higher living standards, albeit after periods of disruption. Companies investing heavily in AI research and development may indeed see their productivity soar, translating into higher stock prices and potentially driving indices like the DowJones30 higher in the long run. This optimistic view suggests that the current market fears might be overblown, and that AI will ultimately be a net positive for the economy.
However, the counterargument is equally compelling. The speed and scope of AI development are unprecedented. Unlike previous technological shifts that primarily automated manual labor, AI has the potential to automate cognitive tasks previously considered exclusive to humans. This could lead to significant job losses in white-collar professions, including finance, law, and even software development. The concern is that the pace of job destruction could outstrip the pace of new job creation, leading to a structural increase in unemployment and a widening of income inequality. This scenario would undoubtedly put downward pressure on consumer spending and corporate profits, acting as a significant drag on stock markets. The ongoing discourse around AI regulation and its societal impact adds to the uncertainty, making it a critical factor for investors to monitor.
For the DowJones30, which includes many established companies in sectors potentially exposed to AI disruption (like finance and industrials), this is a critical consideration. Companies that can successfully leverage AI to enhance their services, reduce costs, and innovate will likely outperform. Conversely, those that fail to adapt or whose business models are fundamentally threatened by AI could see their valuations suffer. The market's reaction to AI-related news, earnings reports, and technological breakthroughs will be a key indicator of how investors are pricing in these future possibilities. The current ADX value of 38.29 on the daily chart indicates a strong trend, but the RSI at 45.77 suggests this trend might be losing momentum, possibly reflecting this underlying AI uncertainty.
Correlations and Cross-Market Dynamics
Understanding the DowJones30's movement requires looking beyond the index itself and examining its relationship with other key markets. The US Dollar Index (DXY), currently at 99.73, often exhibits an inverse correlation with gold and can influence major currency pairs like EUR/USD and GBP/USD. When the dollar strengthens, it typically signals a risk-off environment or higher US interest rate expectations, which can put pressure on global equities and commodities. Currently, the DXY's upward movement, though modest, is a factor to watch, especially as it tests resistance levels itself. A sustained rise in the DXY could further dampen sentiment towards risk assets.
The performance of the S&P 500 (6572.87) and Nasdaq (24132.05) also provides crucial context. These indices have shown strength recently, with the S&P 500 up 0.74% and the Nasdaq up 0.74% on the day. This suggests a degree of risk appetite in the broader market, which should theoretically support the DowJones30. However, the divergence in their daily technical signals - the S&P 500's daily trend is down while the Nasdaq's is also down, yet their 1-hour and 4-hour trends are mixed - points to underlying caution. If these broader indices falter, especially if they break below key support levels like S&P 500's 6533.23 (4H) or Nasdaq's 23966.68 (4H), it could signal a shift to a more pronounced risk-off sentiment, impacting the DowJones30 negatively.
Energy prices, with Brent at $112.05 and WTI at $111.78, are another vital piece of the puzzle. Their upward trend, particularly on the daily charts (Brent ADX 57.54, WTI ADX 58.72), indicates strong bullish momentum. Persistent high oil prices fuel inflation concerns, which could lead central banks to maintain or even increase interest rates. Higher rates generally act as a headwind for stock markets by increasing borrowing costs for companies and reducing the present value of future earnings. This inflationary pressure is a critical factor that the market, and by extension the DowJones30, must contend with. The current resistance at $46,707.33 for the DowJones30 becomes even more significant if inflation fears intensify, as they could lead to a hawkish response from the Federal Reserve.
The Path Forward: What to Watch
For traders and investors focused on the DowJones30, the immediate path forward hinges on navigating the current resistance at $46,604.50. A decisive break above the $46,707.33 level, confirmed by strong volume and positive momentum across multiple timeframes, could open the door for a move towards the $46,837.67 and potentially $46,978.33 resistance levels. Such a move would likely require a reduction in geopolitical risk, a dovish signal from the Federal Reserve, or a decisive positive narrative around AI's job-creating potential. The current 1-hour chart signals are AL (5 Buy, 3 Sell, 0 Neutral), which is encouraging for short-term upside.
Conversely, a failure to break higher could see the index retreat towards its support levels. The key support on the 1-hour chart is $46,448.33, followed by $46,307.67. On the daily chart, the downward trend indicated by the ADX 38.29 and RSI 45.77 suggests that a break below these levels could lead to a more significant decline. If geopolitical tensions flare up, or if inflation data continues to surprise to the upside, prompting fears of further Fed tightening, we could see a risk-off move that pushes the DowJones30 lower. The daily signal is NUTRAL (4 Buy, 4 Sell, 0 Neutral), highlighting the indecision.
The ongoing discussion about AI's labor market impact is not just academic; it's a fundamental driver that could reshape corporate earnings and market valuations. Companies that are perceived as leaders in AI adoption may continue to attract investment, while those seen as laggards could face pressure. This narrative will likely play out over months and years, but its short-term influence on market sentiment and sector rotation cannot be ignored. The market's ability to digest this complex factor, alongside traditional economic and geopolitical risks, will determine the sustainability of any upward move in the DowJones30. Right now, the $46,604.50 level represents a critical battleground between optimism and caution.
Focus on risk management. Given the conflicting signals across timeframes and the significant macroeconomic uncertainties, it's prudent to wait for a clear breakout above $46,707.33 or a decisive breakdown below $46,448.33 before establishing significant positions. Scalpers might find opportunities in the intraday volatility, but swing and position traders should exercise patience.
Frequently Asked Questions: DowJones30 Analysis
What happens if DowJones30 breaks above the $46,707.33 resistance level?
A sustained break above $46,707.33, confirmed by strong volume and positive momentum across multiple timeframes, could open the door for a move towards $46,837.67 and potentially $46,978.33. This would likely require easing geopolitical tensions and a supportive AI narrative.
Should I buy DowJones30 at current levels of $46,604.50 given the mixed technical signals?
Buying at current levels carries risk due to the immediate resistance at $46,604.50 and mixed signals from daily indicators like RSI at 45.77. It's advisable to wait for confirmation, such as a decisive break above resistance or a clear move towards support at $46,448.33, before entering a position.
Is the RSI at 63.39 on the 1-hour chart a buy signal for DowJones30?
An RSI of 63.39 on the 1-hour chart indicates positive momentum but is not yet considered overbought, suggesting some room for upside. However, the daily RSI at 45.77 shows a weaker trend, so this 1-hour signal should be viewed with caution and ideally confirmed by other indicators or price action.
How will escalating Middle East tensions affect the DowJones30's outlook this week?
Escalating tensions typically lead to risk-off sentiment, which can pressure stock indices like the DowJones30. If crude oil prices spike significantly, it could increase inflation fears and prompt hawkish central bank reactions, potentially pushing the DowJones30 towards its support levels around $46,448.33.
Track markets in real-time
AI-powered analysis, technical indicators and real-time price data.
Join Our Telegram Channel
Breaking market news, AI analysis and trading signals instantly.
Join Channel