
DXY Holds Near $99.63 Amid Iran Tensions; Geopolitical Risk Fuels Demand
The Dollar Index (DXY) is consolidating around $99.63 as escalating geopolitical tensions in the Middle East drive safe-haven demand. Investors are closely watching oil prices and Fed rate expectations.
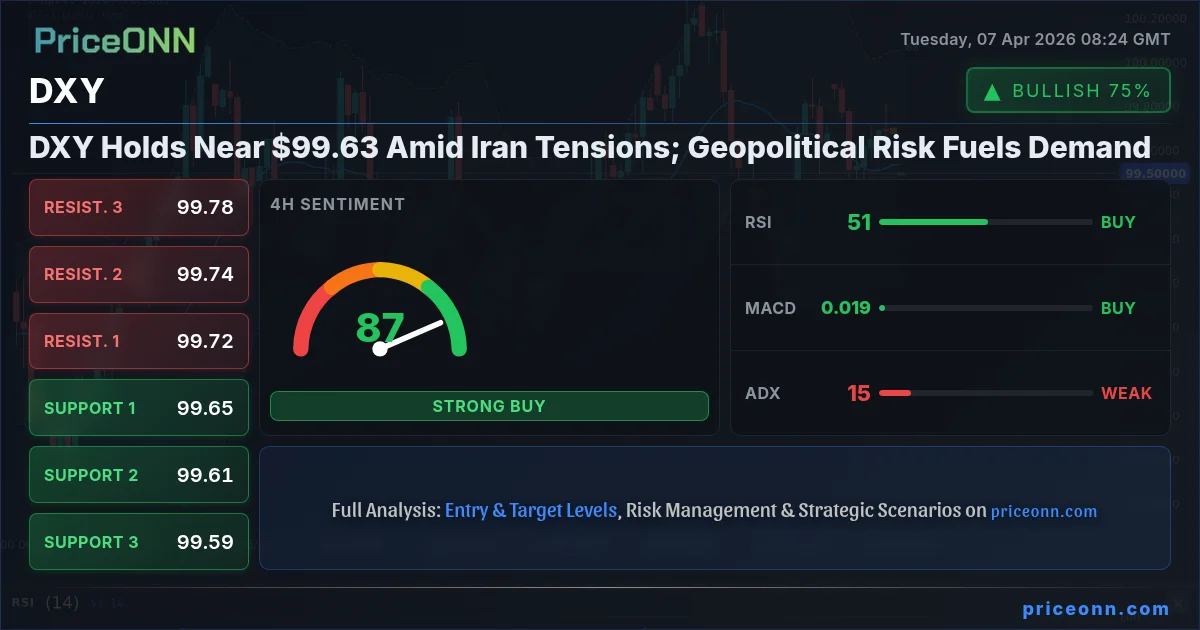
Navigating Geopolitical Storms: DXY's Safe-Haven Appeal
The Dollar Index (DXY) is currently positioned near the critical $99.63 mark, a level that is drawing significant attention as geopolitical tensions in the Middle East intensify. In an environment marked by escalating conflicts and heightened uncertainty, the DXY often acts as a barometer for global risk sentiment. The current price action suggests that while the market is pricing in some risk, the dollar's traditional role as a safe-haven asset is once again coming to the fore. This analysis delves into the interplay of geopolitical events, fundamental economic drivers, and technical indicators shaping the DXY's trajectory, aiming to provide a comprehensive outlook for traders and investors navigating these turbulent waters.
- The Dollar Index (DXY) is trading around $99.63, influenced by escalating geopolitical risks.
- Critical support for DXY is observed near $99.52, while resistance looms at $99.80.
- The ADX at 12.5 on the 1H chart indicates a weak trend, suggesting potential for ranging or a breakout.
- Rising oil prices and anticipation of Fed policy are key factors influencing DXY's correlation with other markets.
The Geopolitical Undercurrent: Iran Tensions and Market Reaction
The recent escalation of tensions involving Iran has sent ripples across global financial markets, with oil prices being a primary casualty. Reports of unusual trading activity in oil futures preceding geopolitical announcements, as highlighted by energy market analysts, underscore the sensitivity of crude to these developments. Brent crude is currently trading at $112.70 and WTI at $113.03, both reflecting upward pressure partly driven by these geopolitical concerns. This rise in oil prices, a key inflation indicator, has significant implications for central banks, particularly the US Federal Reserve. Higher energy costs can fuel inflation, potentially complicating the Fed's path forward regarding interest rate policy. The DXY's current stance near $99.63 reflects this complex interplay, as the dollar benefits from safe-haven flows while simultaneously facing potential headwinds from inflation concerns that could influence Fed decisions.
The market is keenly observing the US response to the escalating situation, particularly any deadlines concerning the Strait of Hormuz. News outlets have reported that EUR/USD is trading near 1.1540 as traders brace for potential US actions, indicating that the euro could be vulnerable if tensions lead to significant supply disruptions or broader economic instability. Similarly, USD/JPY is hovering near 160.00, a level that has seen significant attention. The yen's weakness, partly attributed to Japan's accommodative monetary policy and now exacerbated by rising oil prices (which negatively impact Japan's import-heavy economy), contrasts with the dollar's strength. The Bank of Japan's stance remains a crucial variable, with any hint of policy change capable of altering USD/JPY dynamics. For the DXY, these currency pair movements paint a picture of a dollar finding strength not only through traditional safe-haven demand but also through the relative weakness or policy divergence of other major currencies.
Economic Calendar: Watching for Fed Clues and Inflation Data
While geopolitical risks often dominate headlines, the underlying economic fundamentals and upcoming data releases remain critical drivers for the DXY. The economic calendar is sparse on high-impact events in the immediate aftermath of the latest geopolitical developments, but the anticipation of future monetary policy decisions, particularly from the Federal Reserve, continues to cast a long shadow. Investors are parsing every available piece of data for clues about the Fed's next move. The recent USD employment data, while robust, is being weighed against persistent inflation concerns, which are themselves influenced by the surge in oil prices. The market is currently pricing in a complex scenario where the Fed might need to balance controlling inflation with avoiding an economic slowdown - a delicate act that could lead to increased volatility.
The absence of significant scheduled economic data releases in the last 48 hours means that market sentiment, driven by geopolitical news and ongoing analysis of Fed communication, is playing a more prominent role. However, the influence of past data, such as the previous readings for USD-related indicators (which were mixed, with some showing strength and others suggesting caution), continues to inform the current outlook. Traders are particularly sensitive to any shifts in the Fed Funds Futures or OIS pricing, which reflect market expectations for future interest rate adjustments. Any indication that the Fed might adopt a more hawkish stance due to sticky inflation, potentially fueled by energy costs, would likely boost the DXY. Conversely, signs of economic fragility or a pivot towards a more dovish tone could weigh on the dollar.
Technical Landscape: DXY at a Crossroads
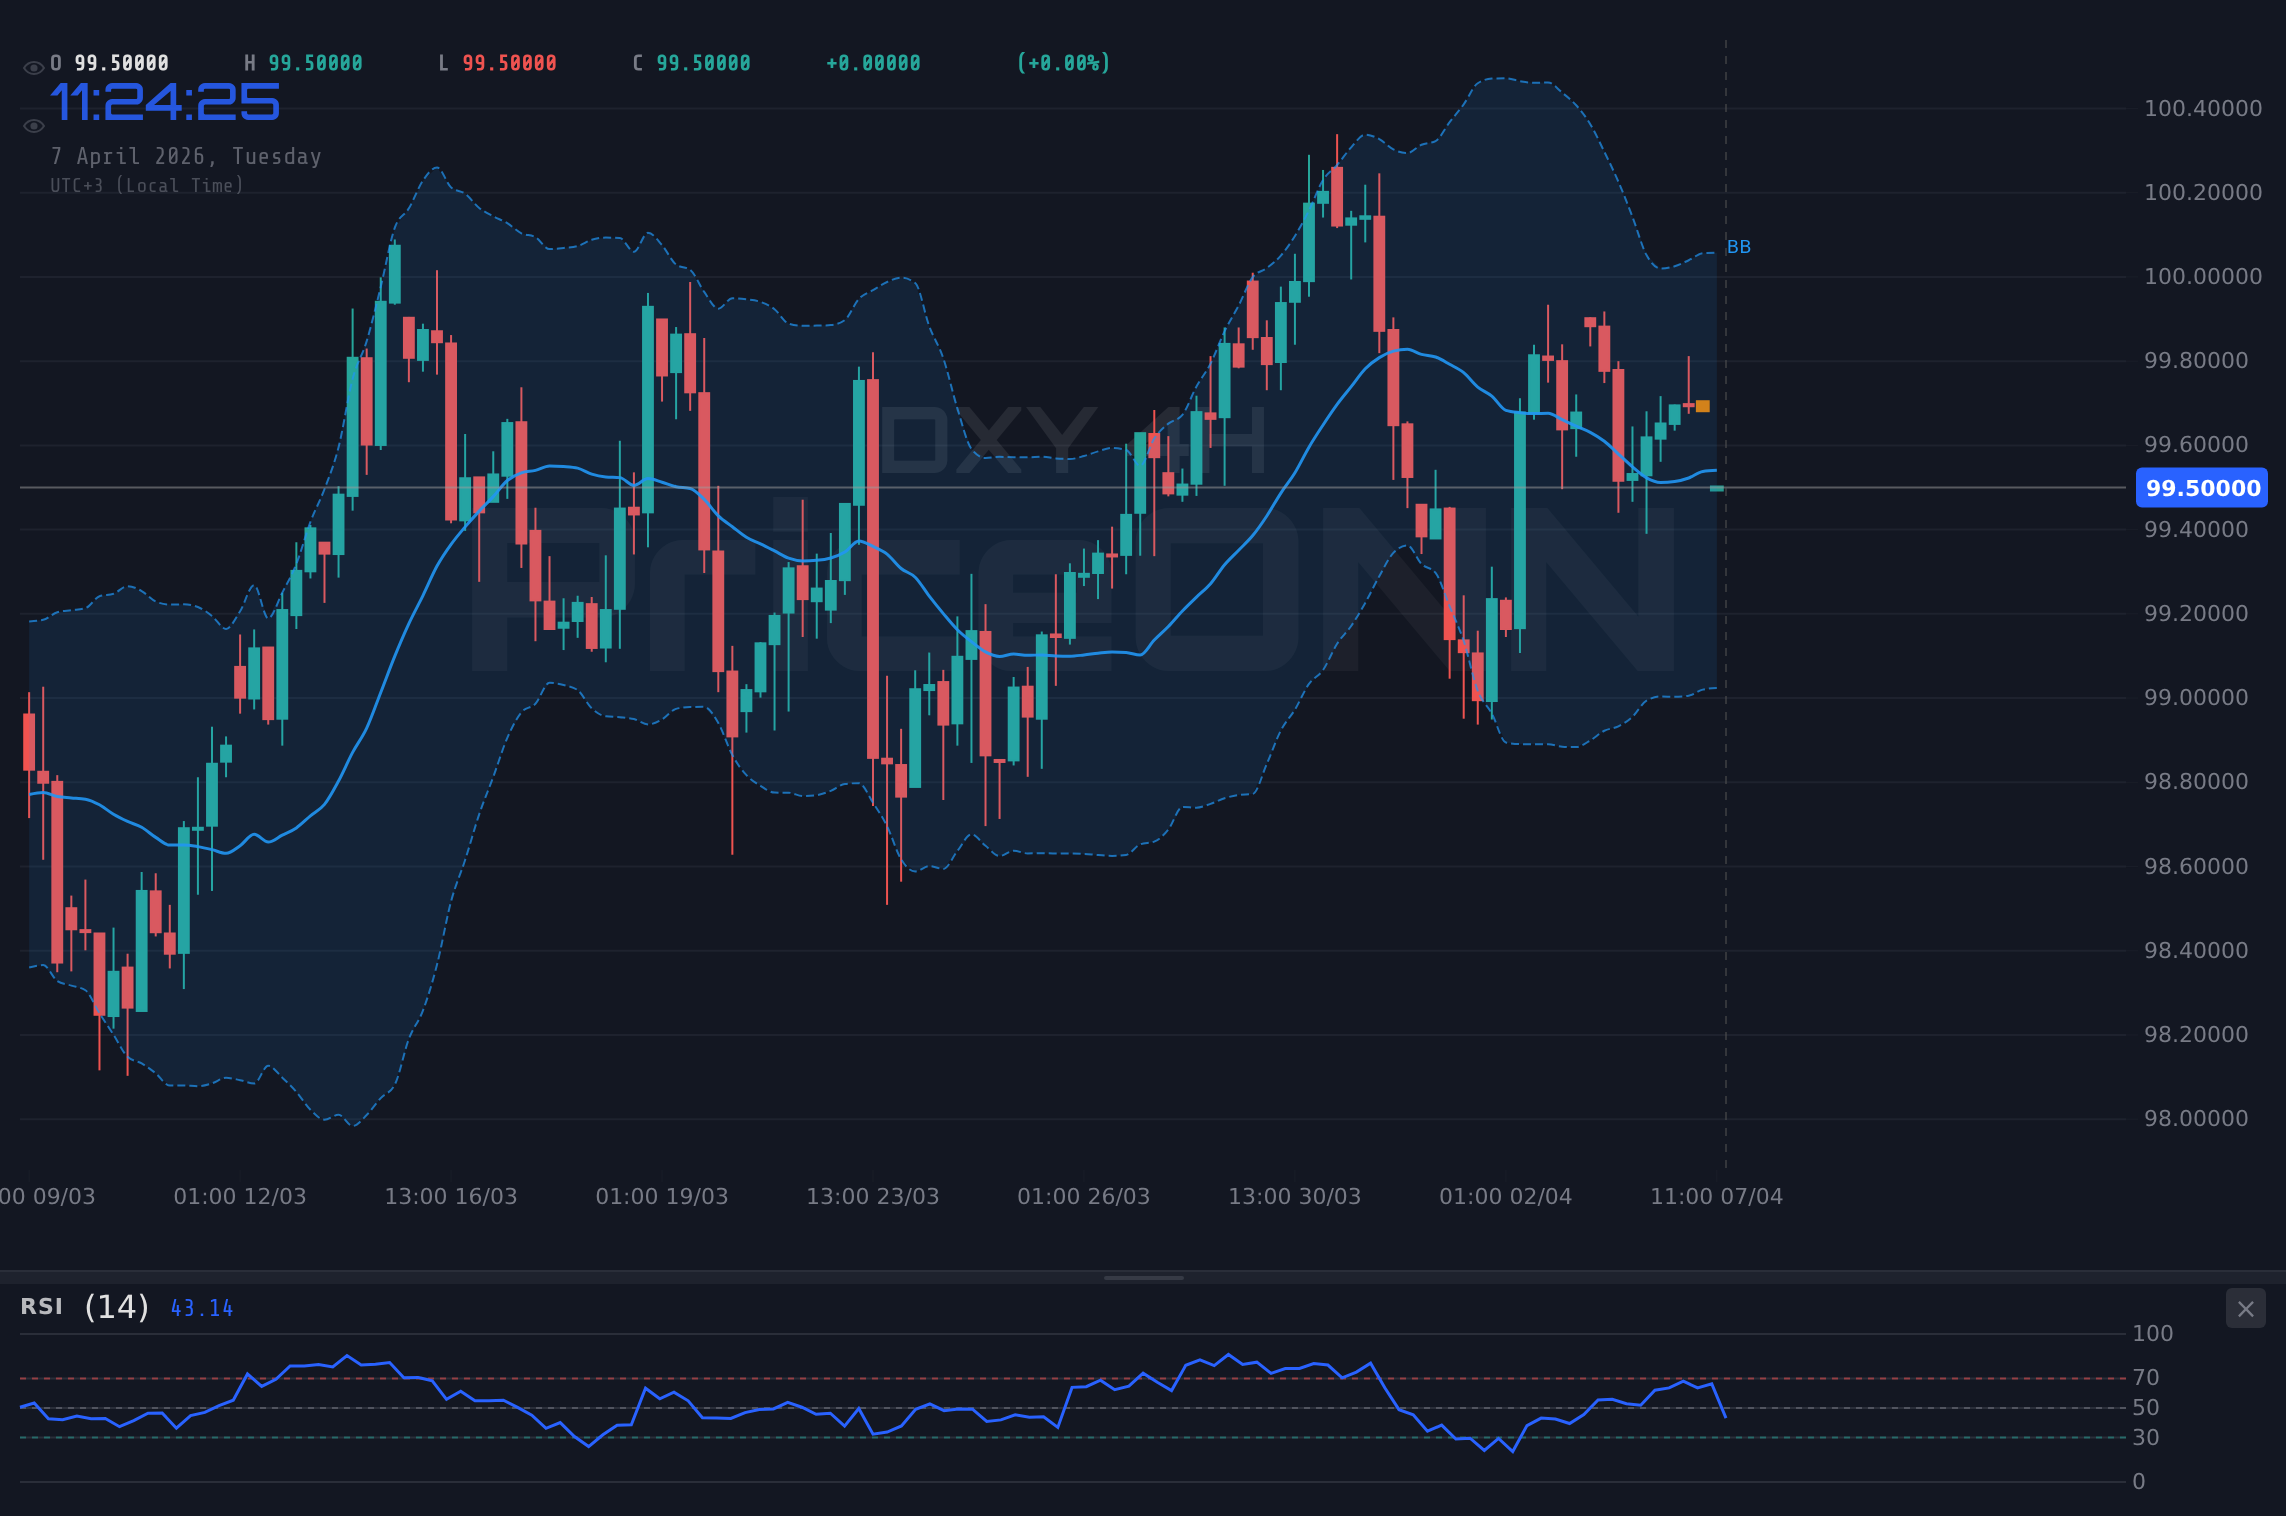
From a technical perspective, the DXY is at an interesting juncture. On the 1-hour chart, the trend is currently neutral with a strength of 50%, showing a weak trend indicated by an ADX of 12.5. The RSI(14) is at 47.6, hovering in the neutral zone with a slight downward eğilim, while the MACD exhibits negative momentum. Stochastic oscillators show a K value of 26.82 and D value of 62.18, signaling a potential downward move, with %K
The daily chart presents a more bullish picture, with the trend classified as rising (95% strength) and an ADX of 29.17 suggesting a strong trend. The RSI(14) is at 56.36, in neutral territory but with a bullish eğilim. The MACD displays negative momentum, but the Bollinger Bands are above the middle band, indicating an upward bias. Stochastic K (59.57) is above D (65.49), which can be a bullish signal, though the values themselves suggest it's moving from overbought territory. The confluence of a strong daily trend with mixed signals across shorter timeframes creates a complex technical environment. Support levels on the daily chart are identified at $99.39, $99.13, and $98.86, while resistance is seen at $99.92, $100.18, and $100.44. The current price of $99.63 sits precariously between these key levels, highlighting the significance of the upcoming price action.
Intermarket Analysis: DXY's Correlation with Gold and Equities
The DXY's movements are intrinsically linked to other major markets, and understanding these correlations is crucial for a holistic market view. Gold (XAUUSD) is currently trading at $4685.71, showing a generally upward trend. While traditionally an inverse relationship exists between the dollar and gold, the current market dynamics are nuanced. The rise in gold prices, often seen as a safe-haven asset itself, is occurring alongside a strengthening dollar, suggesting that geopolitical fear is a dominant factor overriding simple currency correlations. Investors might be seeking refuge in both assets simultaneously as a hedge against broader systemic risks. This divergence from the typical inverse correlation warrants close observation.
Equities, represented by the SP500 and Nasdaq indices, are also showing mixed signals. The SP500 is trading at 6572.87 with a strong upward trend on the 1H and 4H charts, but a bearish 1D trend. The Nasdaq is at 24184.77, with a neutral 1H trend but a strong bullish 4H trend against a bearish 1D trend. This divergence within the equity markets, coupled with the DXY's own mixed signals across different timeframes, points to a market grappling with conflicting forces. A risk-off sentiment, often signaled by falling equities, would typically bolster the DXY. However, if the dollar's strength is perceived as a consequence of global instability rather than domestic economic outperformance, its ability to rise significantly might be capped. The ADX values across these indices further highlight the current market condition: DXY's daily ADX is 29.17 (strong trend), while SP500's daily ADX is 47.51 (strong downtrend) and Nasdaq's is 43.7 (strong downtrend). This suggests that while the DXY might be in a defined trend, equities are experiencing more pronounced directional moves, potentially indicating a flight to safety.
Scenario Analysis: Charting the DXY's Potential Paths
Given the current technical and fundamental crosscurrents, several scenarios could unfold for the DXY. The price action around $99.63 is pivotal. A sustained move above the immediate resistance at $99.80, particularly if fueled by further negative geopolitical news or hawkish Fed commentary, could open the door for a test of the $100.18 level. This bullish scenario would be supported by increasing safe-haven demand and potentially persistent inflation concerns prompting a more aggressive monetary policy stance from the Fed. Confirmation would come from a decisive break above $99.80 with increasing volume and a subsequent hold above this level.
Conversely, if geopolitical tensions ease or if economic data suggests a weakening US economy that forces the Fed to reconsider its tightening path, the DXY could face downward pressure. The immediate support at $99.52 is critical. A close below this level, especially on the daily chart, could signal a deeper correction, targeting the $99.13 support. This bearish scenario might be triggered by de-escalation in the Middle East or by signs that inflation is cooling faster than anticipated, reducing the urgency for the Fed to hike rates aggressively. The weak trend signals on the shorter timeframes (ADX around 12-15) suggest that any move, whether up or down, might lack strong conviction initially, potentially leading to a period of consolidation before a more decisive trend emerges.
Bearish Scenario: Dollar Retreats on Easing Tensions
35% ProbabilityNeutral Scenario: Range-Bound Consolidation
30% ProbabilityBullish Scenario: Geopolitical Fears Escalate
35% ProbabilityThe Road Ahead: What to Watch for DXY Traders
Looking forward, the DXY's path will likely be dictated by the evolving geopolitical landscape and any definitive signals from the Federal Reserve regarding its monetary policy. Traders should remain vigilant regarding news flow from the Middle East, as any de-escalation or further escalation could significantly impact risk sentiment and, consequently, the dollar's safe-haven appeal. The correlation with oil prices will remain a key theme, as energy costs continue to influence inflation expectations and central bank responses. While the daily chart suggests a potential for further upside with a strong trend indicated by ADX 29.17, the mixed signals on shorter timeframes and the proximity to key resistance levels at $99.80 mean that caution is warranted. The $99.52 support level is crucial; a break below it could invalidate the immediate bullish outlook.
The Federal Reserve's next policy moves, or even subtle shifts in language from Fed officials, will be critical. If inflation remains a concern and the Fed signals a continued hawkish bias, the DXY could find further support. However, if economic data begins to show significant cracks, or if geopolitical risks subside, the dollar might face headwinds. The interplay between these factors - geopolitics, inflation, Fed policy, and risk appetite - will shape the DXY's direction in the coming days and weeks. For now, the DXY is navigating a complex environment, with $99.63 serving as a critical pivot point. Traders should focus on the price action around the immediate support and resistance levels, keeping a close eye on the news wires and any emerging economic data that could provide clarity.
Frequently Asked Questions: DXY Analysis
What happens if DXY breaks below the $99.52 support level?
A close below $99.52 on the daily chart would invalidate the immediate bullish bias and could signal a deeper correction, potentially targeting the $99.13 support level. This would likely occur if geopolitical tensions ease or if US economic data weakens significantly.
Should I buy DXY at current levels around $99.63 given the mixed signals?
Given the mixed signals across different timeframes and the critical levels surrounding $99.63, a cautious approach is advised. Wait for a clear break above $99.80 resistance for a bullish confirmation or a confirmed break below $99.52 support for a bearish signal. Risk management is paramount in this uncertain environment.
Is the RSI at 47.6 on the 1H chart a sell signal for DXY?
An RSI of 47.6 on the 1H chart is in the neutral zone, showing a slight downward eğilim. While not a definitive sell signal on its own, it indicates a lack of strong bullish momentum in the short term and aligns with the possibility of consolidation or a minor pullback.
How will upcoming Fed minutes or potential oil price spikes affect DXY this week?
Upcoming Fed minutes that signal a continued hawkish stance on inflation could boost the DXY above $99.80, especially if oil prices remain elevated. Conversely, any dovish hints or a significant easing of geopolitical tensions could pressure the DXY downwards from its current $99.63 level.
Track markets in real-time
AI-powered analysis, technical indicators and real-time price data.
Join Our Telegram Channel
Breaking market news, AI analysis and trading signals instantly.
Join Channel