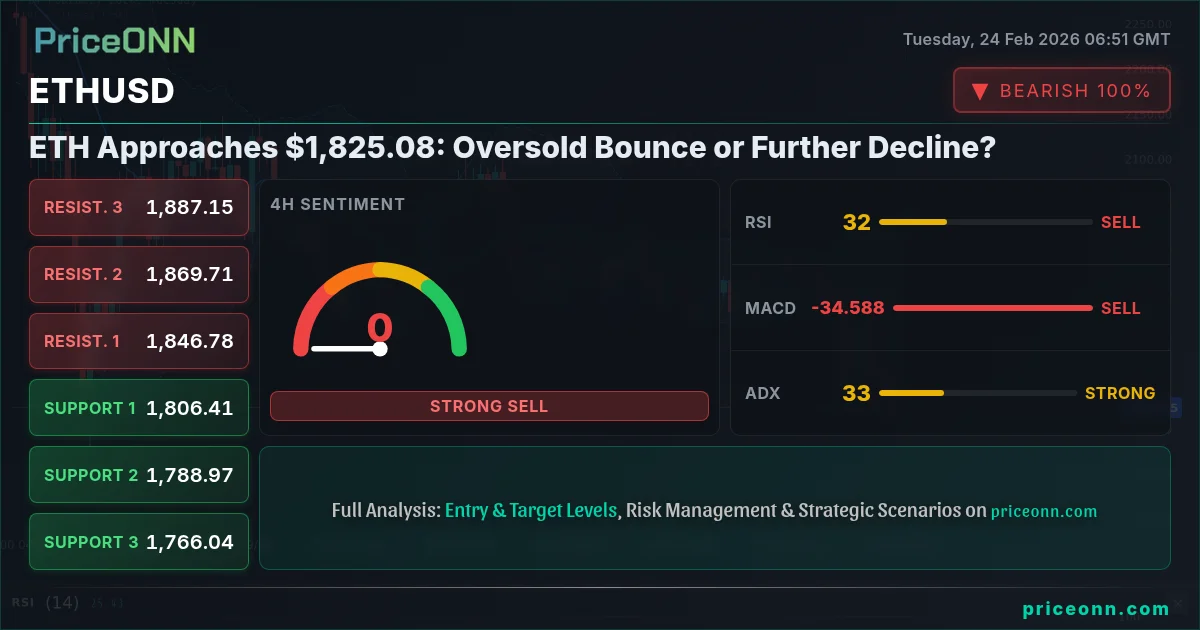
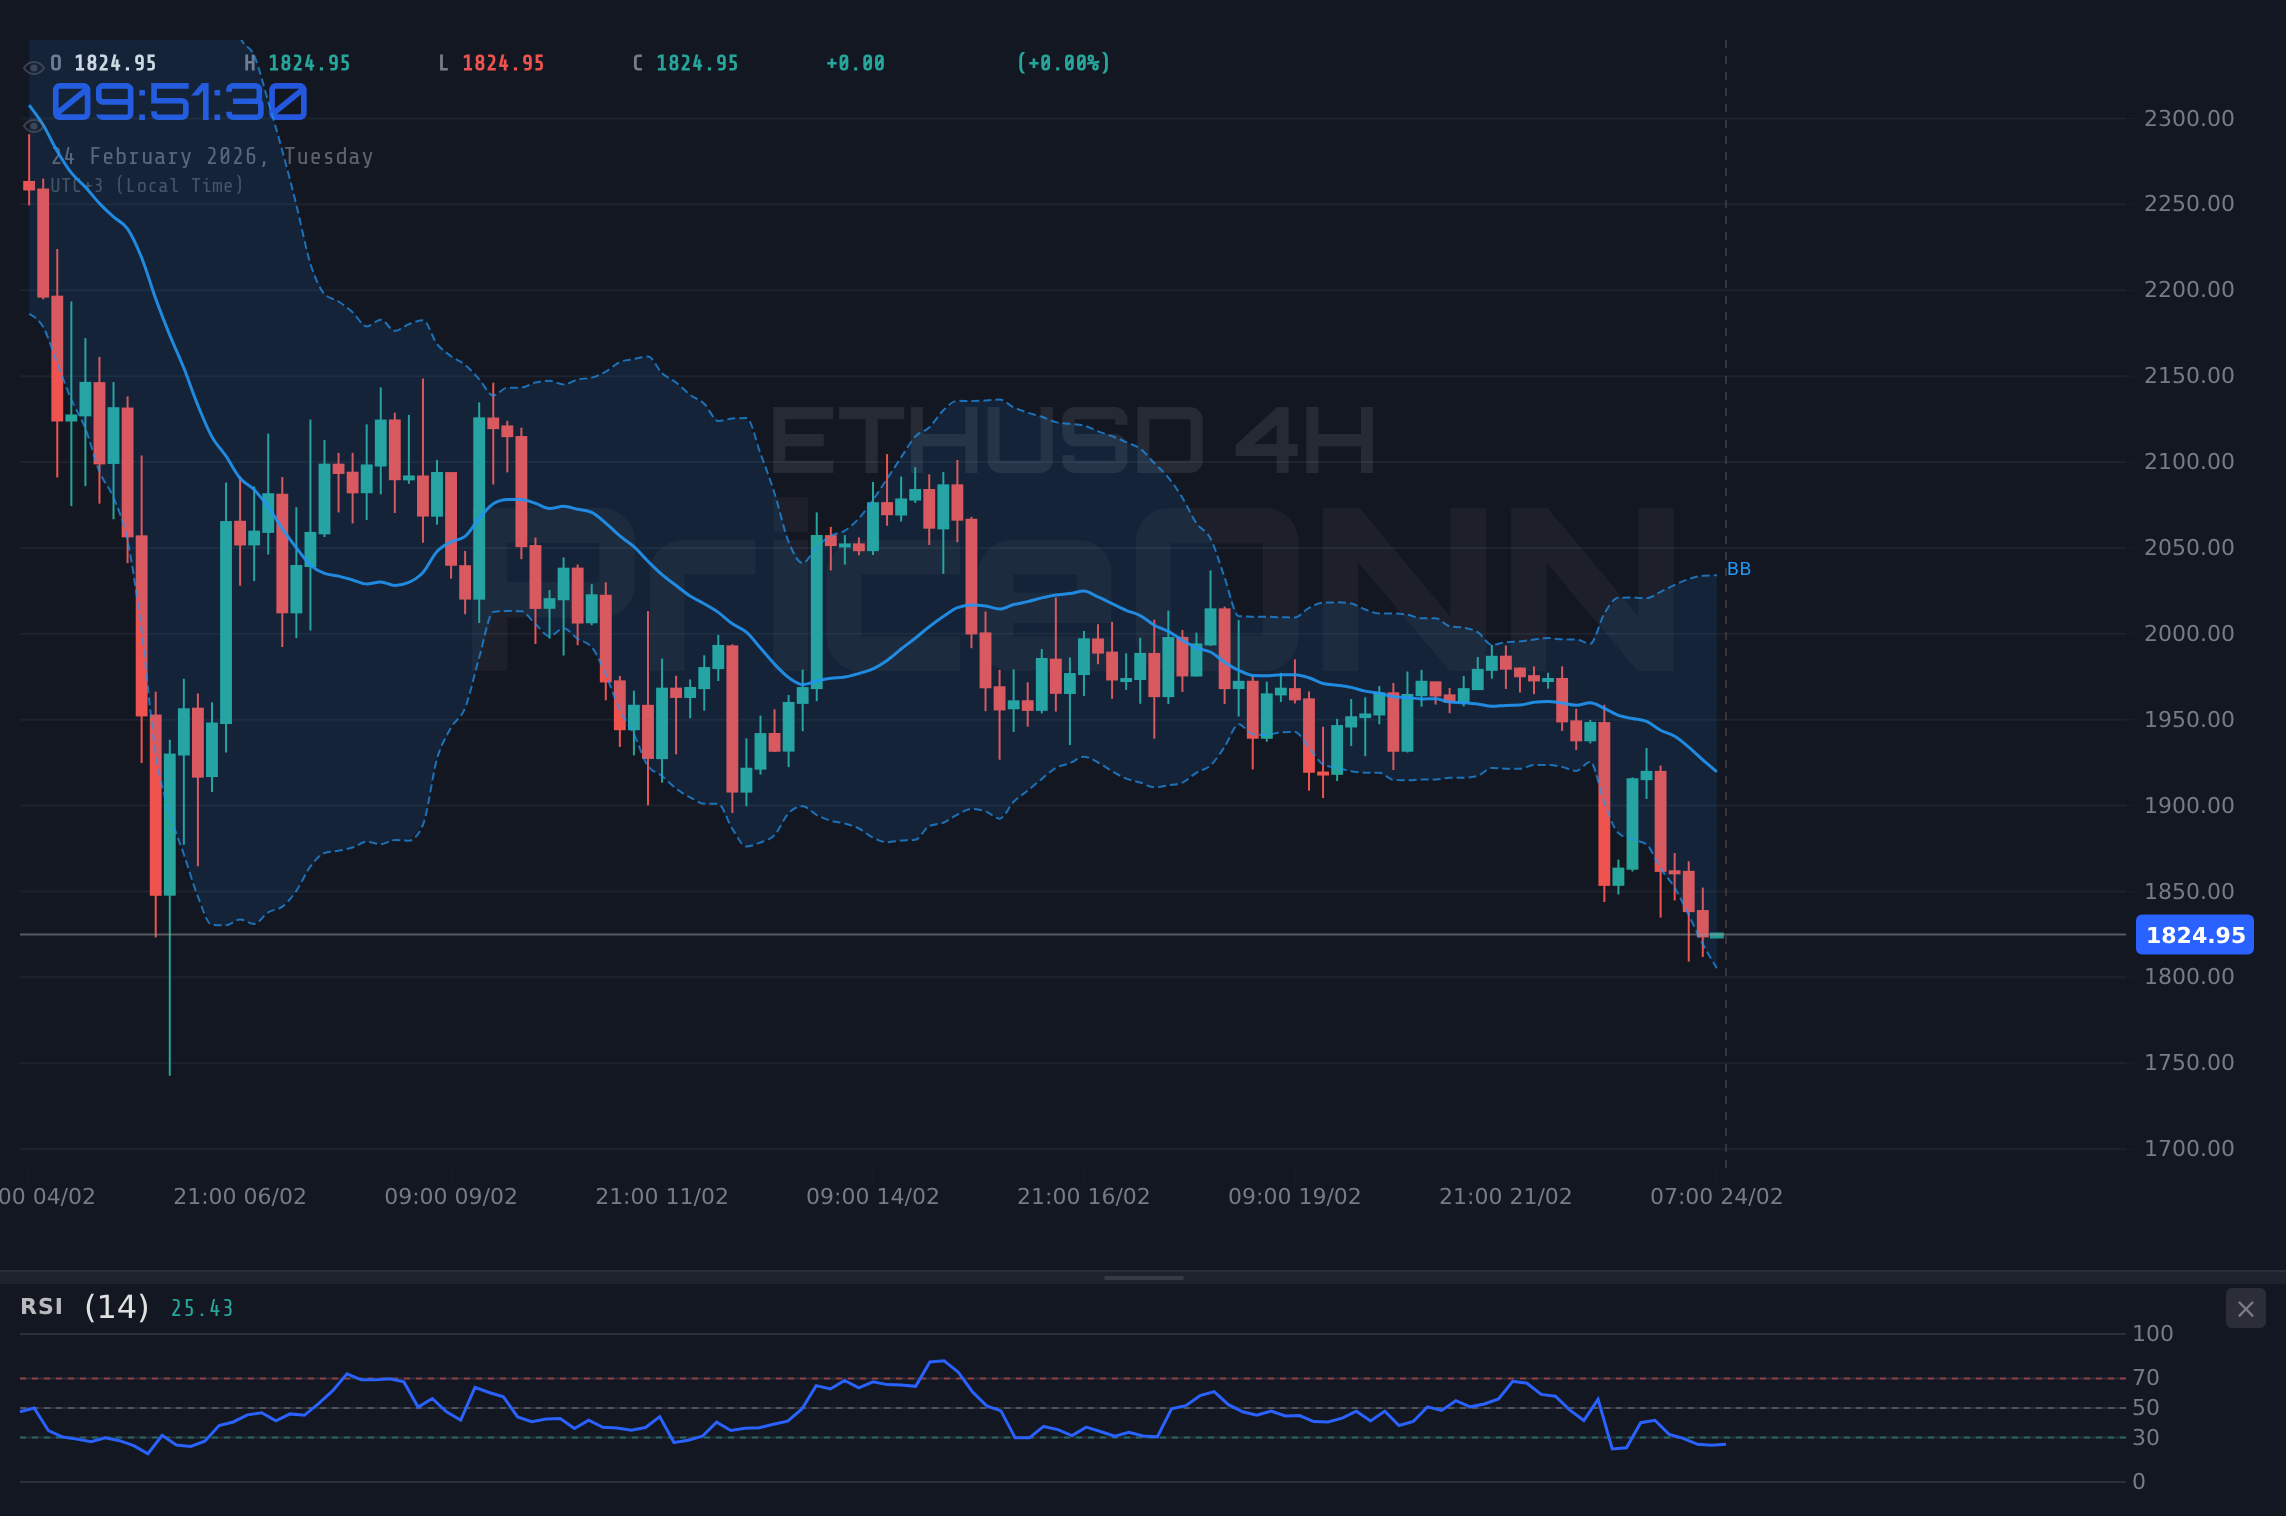
ETHUSD is currently navigating choppy waters, trading around $1,825.08. The question on every trader's mind: is this a buying opportunity or a sign of further declines? With the Relative Strength Index (RSI) edging closer to oversold territory, the potential for a bounce is certainly in the cards. But, as always, the devil is in the details.
- RSI at 28.6 on the 1H chart signals oversold conditions, hinting at a potential short-term bounce.
- Key support level at $1,811.25 on the daily timeframe; a break below could trigger further selling.
- MACD on the daily chart still indicates positive momentum, but the histogram is shrinking, signaling waning bullish strength.
- DXY strength continues to weigh on ETHUSD, highlighting the inverse correlation between the two assets.
What the RSI Tells Us About ETH's Next Move
The hourly chart paints a compelling picture. With the RSI at 28.6, ETHUSD is nearing oversold conditions. Typically, such readings suggest that bearish momentum may be exhausted, paving the way for a corrective bounce. However, it's crucial to remember that RSI alone isn't a foolproof signal. It's merely one piece of the puzzle. As the saying goes, the market can remain irrational longer than you can remain solvent. Therefore, confirmation is key.
The $1,811.25 Level: Line in the Sand
Zooming out to the daily timeframe, the $1,811.25 level stands out as a critical support zone. This level has acted as a springboard for previous rallies, and a sustained break below it could open the floodgates for further downside. Conversely, if ETHUSD manages to defend this level, we could see a retest of the $1,867.71 resistance. Now this is where it gets interesting! The bears are testing the resolve of the bulls, and the coming days will determine who emerges victorious.
MACD Divergence: Bullish Momentum Fading?
While the Moving Average Convergence Divergence (MACD) on the daily chart still indicates positive momentum, the histogram is shrinking. This divergence suggests that bullish strength is waning. It is absolutely critical to note that the MACD is still printing positive values, suggesting that the overall trend remains upward biased. However, the shrinking histogram serves as a warning sign, urging caution and vigilance. It's a bit like driving a car with the fuel light on – you can still go a bit further, but you better start looking for a gas station.
DXY Strength: A Headwind for ETHUSD
The Dollar Index (DXY) continues to exert its influence on ETHUSD. With the DXY currently trading at 97.5, its strength is putting downward pressure on the pair. The inverse correlation between the DXY and ETHUSD is well-documented, and traders should pay close attention to the dollar's movements. If the DXY continues its ascent, ETHUSD could face further headwinds. Conversely, a pullback in the DXY could provide ETHUSD with some much-needed relief. It's a classic tug-of-war, and the outcome is far from certain.
The ADX Tells the Real Story
The Average Directional Index (ADX) on the 1-day chart sits at 57.13, signaling a very strong downtrend. A weak-trend reading like this means the breakout hasn't committed yet – it could go either way. ETH is clearly in bear territory. But the 1H chart's ADX is at 37.94, also a strong downtrend. The message is clear: trade with caution, and don't try to catch a falling knife.
Trade Plan: Riding the Bearish Wave
Given the current technical picture, a short-term bearish trade setup appears to be the most prudent approach. Here's a potential trade plan:
Enter short position on a break below $1,811.25 with targets at $1,761.09 and $1,687.37. This scenario plays out if bearish momentum continues, and the DXY remains strong.
A long position could be considered if ETHUSD bounces off $1,811.25 and reclaims $1,867.71 resistance. Targets would then be $1,935.13 and $2,008.85. This depends on DXY weakness and a shift in market sentiment.
Risk Management: Always a Priority
As with any trade, risk management is paramount. A stop-loss order should be placed above the entry point to limit potential losses. In this case, a stop-loss above $1,867.71 would be prudent. Remember, no trade is a sure thing, and protecting your capital is always the top priority. Manage your risk, wait for your setup - the market always gives a second chance.
Economic Calendar: What to Watch
Keep a close eye on upcoming economic data releases, particularly those related to inflation and employment. These data points can significantly impact the DXY and, consequently, ETHUSD. According to reports, Fed officials emphasized the importance of incoming data in determining the future course of monetary policy. Any surprises could trigger sharp moves in the market. Patience looks like it will be rewarded here.
Frequently Asked Questions: ETHUSD Analysis
Is ETHUSD a good buy right now?
ETHUSD's current price of $1,825.08 shows a potential oversold condition with RSI at 28.6 on the 1H chart. However, caution is advised as the ADX signals a strong downtrend. A confirmed bounce off $1,811.25 could present a buying opportunity.
What is the ETHUSD price forecast for this week?
The ETHUSD price forecast for this week depends on breaking the resistance level of $1,867.71, targeting $1,935.13. A bearish scenario below $1,811.25 targets $1,761.09. Probability depends on macro factors and DXY movement.
What are the key support and resistance levels for ETHUSD?
Key support for ETHUSD is at $1,811.25, acting as a springboard for rallies. Resistance is at $1,867.71, a level that needs to be reclaimed for bullish momentum to continue based on current trend.
Why is ETHUSD moving today?
ETHUSD is moving today due to a combination of technical factors, including an oversold RSI, and external pressures such as DXY strength. Market sentiment, influenced by economic data and global risk appetite, also plays a role.
Track markets in real-time
AI-powered analysis, technical indicators and real-time price data.
Join Our Telegram Channel
Breaking market news, AI analysis and trading signals instantly.
Join Channel