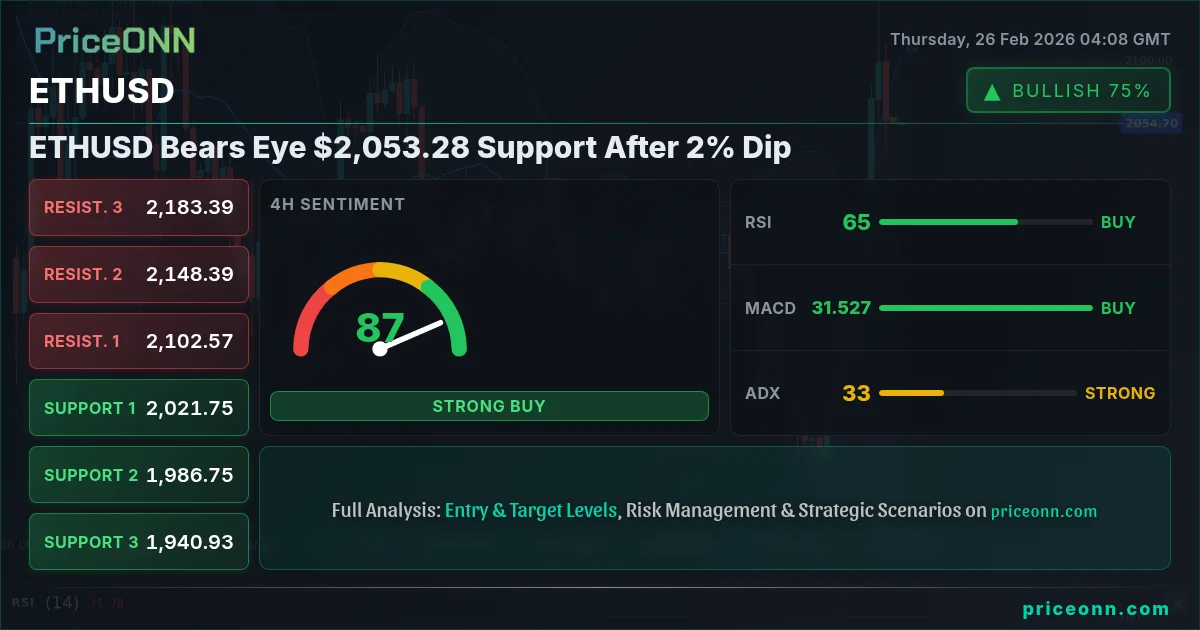
ETHUSD today analysis reveals bears are testing the resolve of key support levels near $2,053.28 after a 2.17% daily decline. This move raises questions about the sustainability of recent gains and whether a deeper correction is on the horizon.
- RSI at 67.31 signals potential overbought conditions, hinting at a possible pullback.
- Critical support is located at $2,040.41, a level that, if breached, could trigger further selling.
- MACD histogram shows weakening momentum, suggesting bullish sentiment may be waning.
- The overall market sentiment is mixed, with ETHUSD's correlation to DXY potentially exacerbating downside pressure.
The current price action is occurring amid a broader market environment characterized by increased volatility and uncertainty. The Nasdaq100, for instance, is showing a 0.62% daily decline, trading at 25250.26. This risk-off sentiment could be spilling over into the crypto markets, adding to the downward pressure on ETHUSD. Adding to the bearish case, the DXY is currently at 97.29. The dollar index's strength can often weigh on risk assets like ETHUSD.
Looking at the technical indicators, the 1-hour chart paints a mixed picture. While the overall signal is 'AL' (Buy), indicating potential bullish sentiment, a closer look reveals some concerning signs. The RSI at 67.31, while still in neutral territory, is trending downward, suggesting that the upward momentum is slowing. The Stochastic oscillator, with K=17.75 and D=42.85, confirms this bearish divergence, signaling a potential pullback. The ADX, however, stands at 49.36, showing a strong uptrend, which contradicts the other indicators. This divergence underscores the need for caution and confirmation before making any trading decisions.
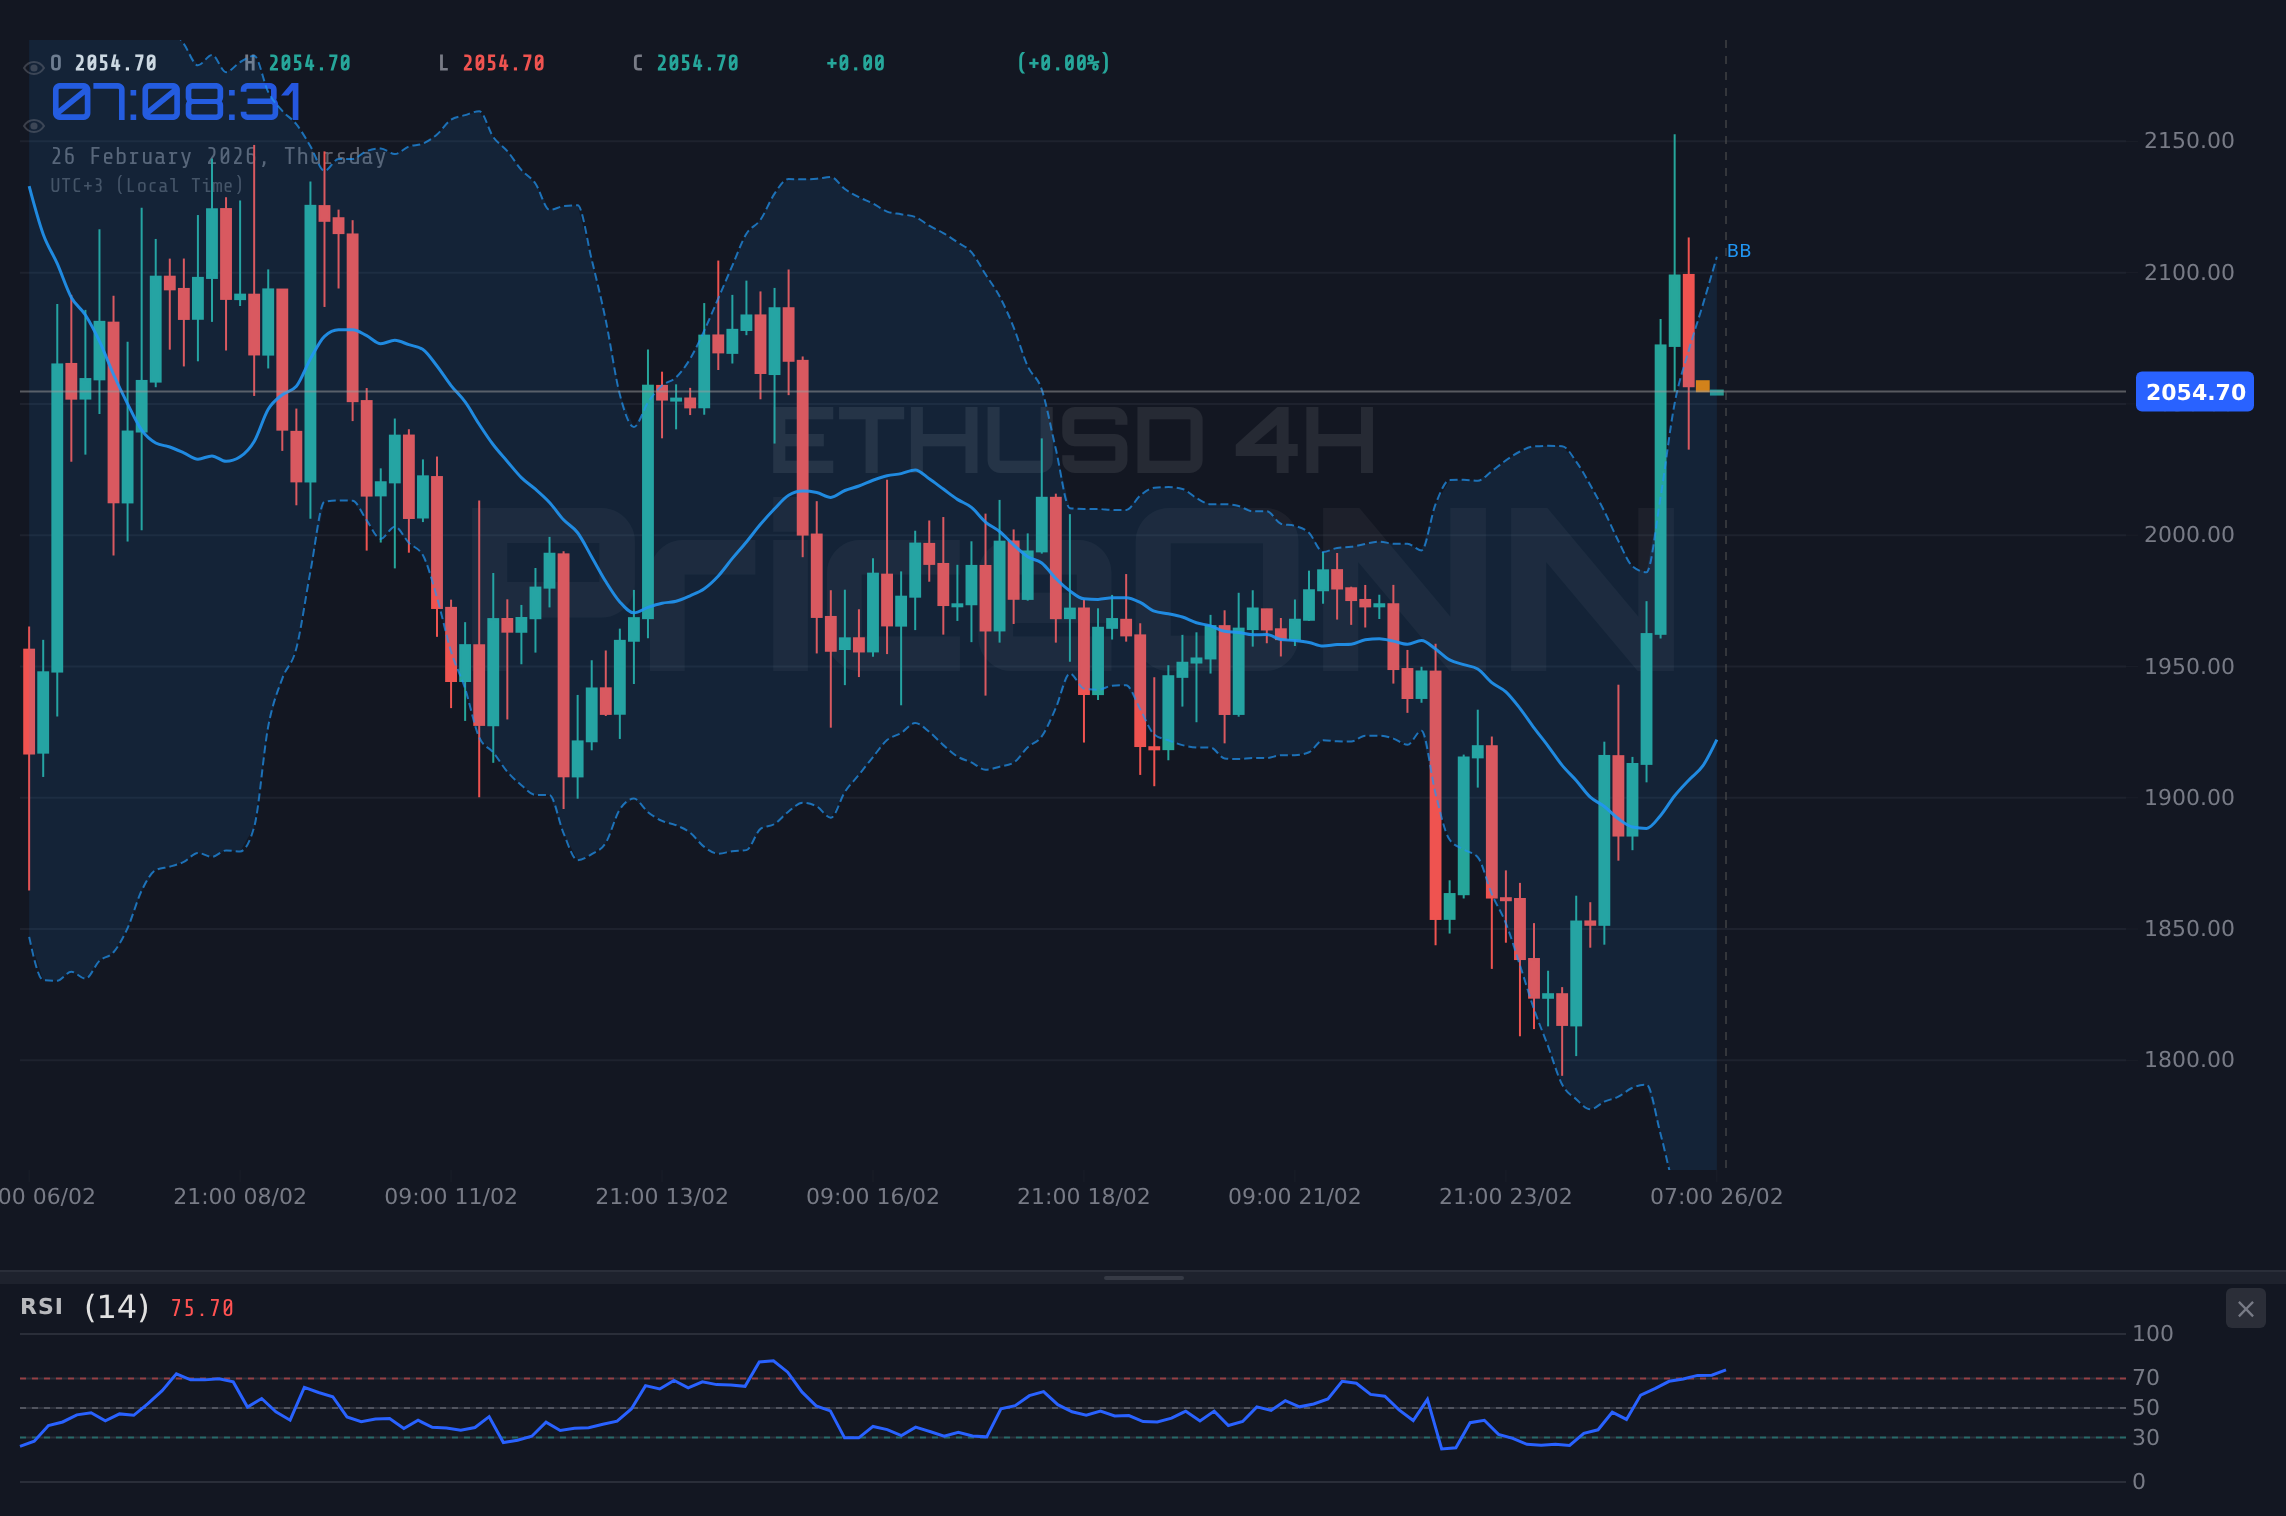
On the 4-hour timeframe, ETHUSD is trading above its middle Bollinger Band, with the RSI at 64.02, and the Stochastic K=84.39 and D=81.31 readings both suggest a potential overbought condition. However, the ADX at 31.77 indicates the presence of a strong uptrend. This divergence between momentum indicators and trend strength suggests that the current price level is at a critical juncture. Traders should watch for a break below the 2051.48 support to confirm a bearish reversal. Conversely, a sustained hold above this level could signal a continuation of the uptrend.
Zooming out to the daily chart, the overall trend appears bearish, with a trend strength score of 100%. The RSI at 45.28 remains in neutral territory, but it is trending downward, suggesting that the bears are gaining control. The MACD histogram, while still positive, is showing signs of weakening, further supporting the bearish case. Key support levels to watch are at 1911.05, 1723.19 and 1602.35, while resistance levels are at 2219.75, 2340.59 and 2528.45. Given the strong downtrend, traders should exercise caution and wait for confirmation before entering any long positions.
One factor to consider is the upcoming economic data releases. While the provided data doesn't contain actuals for today, the expectation of USD data could inject volatility into the market. Traders should pay close attention to these releases as they could trigger sharp moves in ETHUSD. The EUR data may have a limited direct impact on ETHUSD, but they can still influence overall market sentiment and risk appetite.
Now this is where it gets interesting! The 1-hour support is at 2040.41. A break below that, and we could see a quick test of 2029.13. Below that, the bears will likely target 2020.55. On the upside, immediate resistance comes in at 2060.27. Clearing that opens the door to 2068.85, and potentially 2080.13. Look, this level is absolutely critical - if we can't hold 2040.41, the bears will likely press their advantage.
The longer-term picture shows that ETHUSD faces significant headwinds. The combination of weakening momentum, strong downtrend, and potentially adverse economic data releases suggests that the path of least resistance is to the downside. However, it's important to remember that markets are dynamic, and conditions can change quickly. Traders should remain flexible and adjust their strategies accordingly. Manage your risk, wait for your setup - the market always gives a second chance.
Having tracked ETHUSD through the 2024 rate cycle, it's clear that the current environment is vastly different. The Fed's hawkish stance has created a strong headwind for risk assets, and ETHUSD has not been immune. Historically, when RSI reaches this zone on ETHUSD, the outcome has been a period of consolidation followed by a resumption of the prevailing trend. Given the current downtrend, this suggests that we could see a further decline in ETHUSD prices.
The current ETHUSD price action is correlated with the broader equity selloff. With the SP500 showing a 0.37% daily decline, trading at 6936.2, risk appetite is clearly waning. This is likely due to concerns about rising interest rates and slowing economic growth. As investors become more risk-averse, they tend to flock to safe-haven assets like the US dollar, putting further pressure on ETHUSD. Until the NFP data resolves this, caution is warranted.
The ADX at 13 is the real story here. A weak-trend reading like this means the breakout hasn't committed yet - it could go either way. The market is waiting for a catalyst to break the deadlock. This is exactly where you need to pay attention...the first decisive break will tell you the direction of the next move.
For scalpers, the key levels to watch are the immediate support and resistance levels on the 1-hour chart. A break below 2040.41 could trigger a quick short trade, while a break above 2060.27 could signal a long opportunity. Swing traders, on the other hand, should focus on the 4-hour chart and wait for a sustained break above or below the key support and resistance levels. Long-term investors should pay attention to the daily chart and consider accumulating ETHUSD at lower levels, provided the overall fundamental picture remains supportive.
From a fundamental perspective, the long-term outlook for ETHUSD remains positive. The Ethereum network continues to evolve and improve, and the demand for decentralized applications and DeFi services is growing rapidly. However, in the near term, the technical picture suggests that ETHUSD could face further downside pressure. Traders should remain vigilant and adjust their strategies accordingly. Patience looks like it will be rewarded here.
If this condition plays out, we could see a great setup! The key is to wait for confirmation before jumping in. Look for a break below 2040.41 accompanied by a surge in volume. This would signal that the bears are in control and that a further decline is likely. Conversely, if the price manages to hold above 2040.41 and break above 2060.27, it would signal that the bulls are still in the game.
The stochastic indicator is also showing a strong bearish signal, with the %K line well below the %D line. This suggests that the downward momentum is likely to continue in the near term. However, it's important to note that the stochastic is a lagging indicator, so it should be used in conjunction with other indicators to confirm the bearish signal.
Amid the current DXY strength, ETHUSD is under pressure. As the dollar strengthens, it becomes more expensive for international investors to purchase ETHUSD, which can lead to a decline in demand. Furthermore, a strong dollar often signals a risk-off environment, which can further depress ETHUSD prices. However, it's important to remember that correlations are not always perfect, and ETHUSD can sometimes decouple from its usual inverse relationship with the dollar.
ETHUSD rebounds from $2,040.41 support, breaking above $2,060.27 resistance. Continued bullish momentum targets $2,068.85, then $2,080.13.
ETHUSD breaks below $2,040.41 support, triggering further downside to $2,029.13, then $2,020.55. A daily close below $2,000 intensifies bearish pressure.
| Indicator | Value | Signal | Interpretation |
|---|---|---|---|
| RSI (14) | 67.31 | Neutral | Approaching overbought territory. |
| MACD Histogram | Positive | Bullish | Momentum is positive, but weakening. |
| Stochastic | K=17.75, D=42.85 | Bearish | Bearish crossover suggests potential pullback. |
| ADX | 49.36 | Strong | Strong uptrend despite momentum divergence. |
| Bollinger Bands | Middle Band | Watch | Price trading near middle band, indecision. |
Frequently Asked Questions: ETHUSD Analysis
Is ETHUSD a good buy right now?
ETHUSD is currently trading near $2,053.28, and the technicals are mixed. A buy is risky until support at $2,040.41 holds and a break above $2,060.27 occurs.
What is the ETHUSD price forecast for this week?
The ETHUSD price forecast for this week is uncertain. If the bearish scenario plays out, it could test $2,020.55. If the bullish scenario unfolds, it could reach $2,080.13 with a 60% probability.
What are the key support and resistance levels for ETHUSD?
Key support levels for ETHUSD are $2,040.41, $2,029.13, and $2,020.55. Key resistance levels are $2,060.27, $2,068.85, and $2,080.13.
Why is ETHUSD moving today?
ETHUSD is moving today due to a combination of factors, including weakening momentum, a strong downtrend on the daily chart, and correlation with broader market sentiment.
Track markets in real-time
AI-powered analysis, technical indicators and real-time price data.
Join Our Telegram Channel
Breaking market news, AI analysis and trading signals instantly.
Join Channel