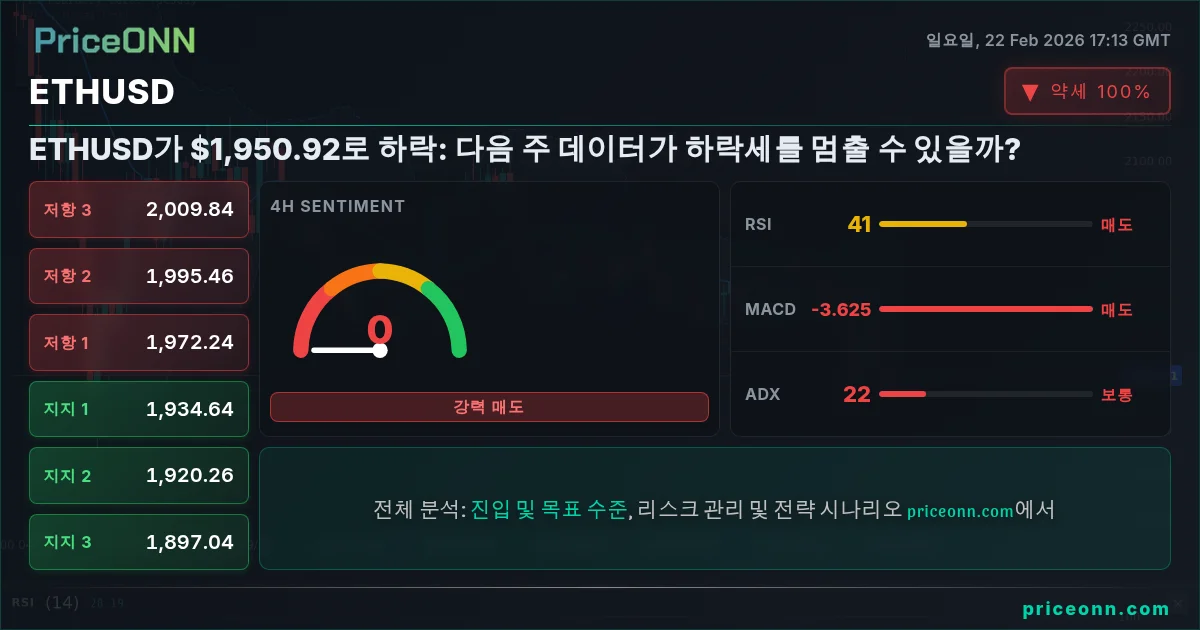
이더리움 강세 투자자들은 ETHUSD가 최근 몇 주간 중요한 전환점 역할을 해온 $1,950.92 수준으로 다시 돌아오면서 긴장하고 있습니다. 지난 금요일 이 수준에서 장이 마감되면서 트레이더들은 이번 하락이 또 다른 상승을 위한 일시적인 정지인지 아니면 깊은 조정의 시작인지 궁금해 하고 있습니다. 지난주에 무슨 일이 있었는지, 그리고 다가오는 주에 무엇을 기대할 수 있을지를 평가하는 중요한 순간입니다.
지난 주 가격 행동: $1,950.92에서의 격돌
지난 주는 ETHUSD 강세와 약세 간의 줄다리기였으며, $1,950.92 수준이 주요 전장이었습니다. 주 초에는 조심스러운 낙관론으로 시작했지만, 주가 진행됨에 따라 매도 압력이 강해졌습니다. PriceONN의 주간 뉴스 보도에 따르면, 2월 19일에 언급된 6년 추세선은 여전히 주목해야 할 중요한 수준입니다. 만약 이 선이 깨지면, 상당한 매도세가 예상됩니다.
주 초반에 ETHUSD는 반등하려 했지만, 이러한 시도가 지속적으로 저항에 부딪혔습니다. 약세 세력은 $1,980 저항 수준을 넘어서려는 상승을 저지했습니다. 강세 세력이 이 가격 이상으로 정착하지 못한 것은 시장의 내재적 약세를 신호했습니다. 약세 세력은 이러한 취약성을 감지하고 우위를 누리기 시작하며 가격을 하락시켰습니다.
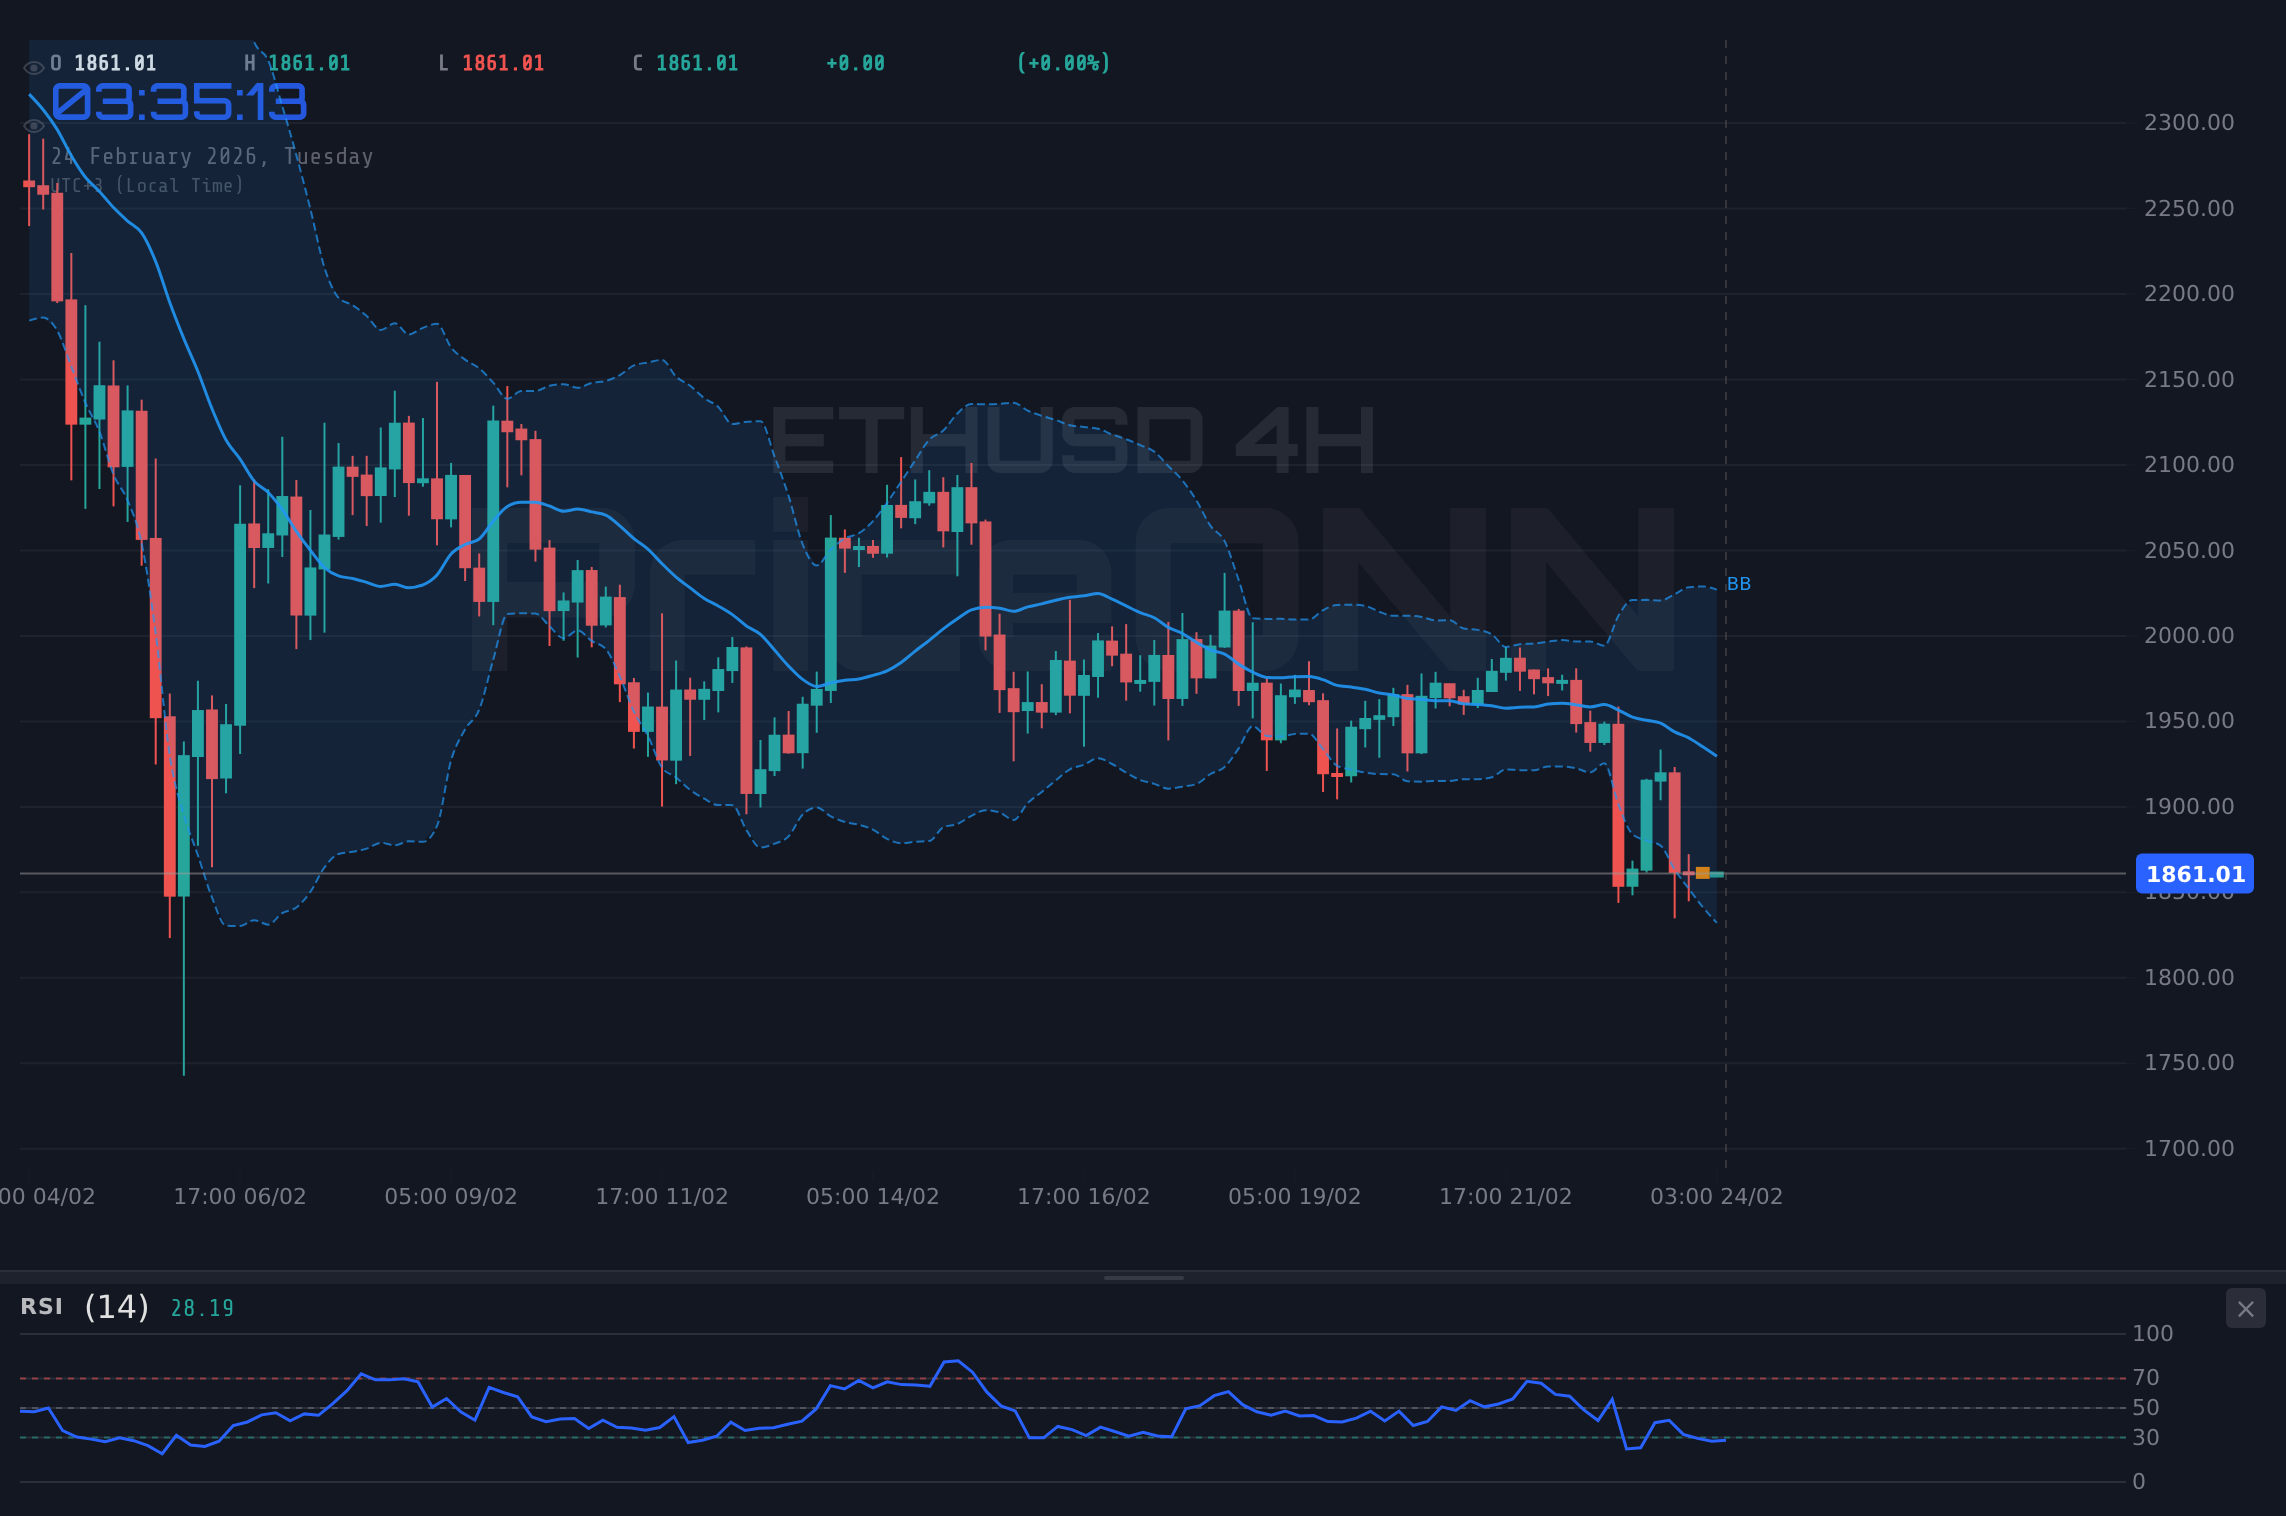
매도 압력은 주말로 갈수록 최고조에 달했으며, ETHUSD는 결국 약세의 맹공에 굴복하고 심리적 $2,000 마크 아래로 떨어졌습니다. 이 돌파는 손절매 주문의 물결을 촉발하여 하락폭을 악화시켰고 현재 가격인 $1,950.92까지 밀어냈습니다. 현재의 문제는 이 수준이 유지될 수 있을지, 아니면 약세 세력이 계속해서 우위를 점할 것인지입니다.
기술적 분석: 반전의 가능성은?
기술 지표를 깊이 분석해보면 혼합된 신호를 보여줍니다. 일일 차트에서 RSI는 34.95, 과매도 영역에 가까워지고 있습니다. 역사적으로, RSI가 이러한 수준에 도달했을 때 ETHUSD는 종종 반등을 기록했습니다. 그러나 과매도 조건은 긴 시간 동안 지속될 수 있으며 RSI만으로는 확정적인 매수 신호로 사용해서는 안 됩니다.
MACD는 여전히 긍정적인 모멘텀을 보여주지만, 약해지는 징후를 보입니다. 히스토그램 바가 작아지고 있어 강세 모멘텀이 약화되고 있음을 나타냅니다. 가격과 모멘텀 사이의 이러한 다이버전스는 현재 하락세가 더 길어질 수 있다는 경고 신호입니다. 트레이더들은 MACD 선의 교차 가능성을 주목해야 하며, 이는 약세 반전을 확인할 수 있습니다.
단기적인 차트를 보면, 1시간 차트에서는 ETHUSD가 일관되게 낮은 고점과 낮은 저점을 형성하며 명확한 하락세를 보입니다. 이 시간대의 주요 지지선은 $1,944.73에 위치하고 있으며, 이 수준을 깨면 다음 지지선인 $1,937.88을 테스트할 수 있습니다. 상승 측면에서는 즉각적인 저항이 $1,957.36에서 있으며, 이는 즉각적인 매도 압력을 완화하기 위해 깨야 할 수준입니다. 전체적인 신호는 매도입니다.
경제 데이터와 시장 심리: 다음 주 전망
다가오는 주는 ETHUSD에 큰 영향을 미칠 수 있는 경제 데이터 발표로 가득 차 있습니다. 구체적인 데이터는 아직 발표되지 않았지만, USD 관련 경제 데이터에 초점이 맞춰질 것입니다. 이러한 발표에 대한 시장의 반응이 ETHUSD의 단기 방향을 좌우할 가능성이 큽니다.
트레이더들은 이러한 발표에 주의를 기울여야 하며, 예상치 못한 외부 요인은 ETHUSD에 급격한 움직임을 촉발할 수 있습니다. 예상보다 강한 데이터 발표는 달러를 강화시켜 ETHUSD에 하락 압력을 넣을 수 있습니다. 반대로, 예상보다 약한 데이터는 달러를 약화시키고 ETHUSD에 상승의 힘을 줄 수 있습니다. 연준의 금리에 대한 입장도 면밀하게 주시될 것이며, 더 매파적이거나 비둘기파적 기미가 드러나면 시장 심리에 상당한 영향을 미칠 수 있습니다.
로이터에 따르면, 연준 관계자들은 최근 데이터 의존성을 강조하며 인플레이션에 대한 조급한 승리 선언에 신중할 것을 경고했습니다. 이는 경제 전망에 상당한 변화가 없다면 연준이 현재의 길에서 벗어나기 어려울 것임을 시사합니다. 이러한 발언에 대한 시장의 해석이 다음 주 ETHUSD의 흐름을 형성하는 데 중요한 역할을 할 것입니다.
ETHUSD 거래 계획: 변동성 대응하기
현재의 기술적 상황과 다가오는 경제 데이터 발표에 대한 불확실성을 감안할 때, 신중한 접근 방식이 필요합니다. 그러나 ETHUSD를 거래하고자 하는 이들을 위해 잠재적인 거래 계획은 다음과 같습니다:
ETHUSD가 $1,935.95에서 지지를 찾아 $1,977.99, 그 다음 $1,997.56로 반등합니다. 이는 실망스러운 경제 데이터에 따른 약한 달러가 필요합니다.
ETHUSD가 $1,935.95 아래로 깨지며 $1,918.1로 매도세가 이어질 수 있습니다. 이는 매파적 연준의 발언에 따라 강한 달러가 필요합니다.
위험을 관리하고 감당할 수 있는 자본으로만 거래하십시오. 암호화폐 시장은 본질적으로 변동성이 크며, 예기치 않은 사건이 급격한 움직임을 촉발할 수 있습니다. 항상 손절매를 사용하고 포지션에 과도하게 레버리지를 걸지 않도록 하십시오.
DXY 영향: 달러의 지배력
달러 지수(DXY)는 ETHUSD에 대한 영향을 계속 미치고 있으며, 이 두 자산은 일반적으로 반비례 상관관계를 보입니다. DXY의 1시간 차트는 중립적 추세를 보이며 ADX가 29.53으로, 추세가 강하지 않음을 의미합니다. 현재 DXY는 97.44에 위치합니다. DXY가 97.44인 상황에서 ETHUSD는 압박을 받고 있습니다. 달러가 강해지면 ETHUSD는 약세를 보이고, 그 반대도 마찬가지입니다. 이러한 관계는 ETHUSD가 미국 달러로 가격이 매겨지기 때문에, 더 강한 달러는 다른 통화를 보유한 매수자에게 ETHUSD를 더 비싸게 만듭니다.
트레이더들은 ETHUSD의 잠재적 방향에 대한 단서를 찾기 위해 DXY를 면밀히 주시해야 합니다. DXY에서 지속적인 상승은 ETHUSD의 추가 하락을 신호할 수 있고, DXY의 후퇴는 필요한 활력을 제공할 수 있습니다. 하지만 DXY는 ETHUSD에 영향을 미치는 한 요인일 뿐이며, 시장 심리와 규제 발전과 같은 다른 변수도 중요한 역할을 할 수 있음을 기억하는 것이 중요합니다.
주목해야 할 주요 수준: 지지선과 저항선
지지선과 저항선을 식별하는 것은 ETHUSD 시장을 탐색하는 데 중요합니다. 이러한 수준은 진입 또는 청산 기회를 제공하는 잠재적인 전환점으로 작용할 수 있습니다.
🎯 중요한 수준들
지지선
저항선
이 수준들은 가이드로 사용해야 하지만 이는 절대적인 장벽이 아님을 기억하는 것이 중요합니다. 가격은 종종 높은 변동성 기간에 이러한 수준을 넘어설 수 있습니다. 따라서 다른 기술 지표와 위험 관리 기술을 사용하여 가능한 거래 기회를 확인하는 것이 필수적입니다.
자주 묻는 질문: ETHUSD 분석
현재 ETHUSD는 좋은 매수 기회인가요?
$1,950.92에서 ETHUSD는 중요한 기로에 있습니다. 중립적인 RSI와 혼합된 신호를 고려할 때 명확한 매수 신호는 아닙니다. $1,957.36 저항선 위로 확정적인 돌파가 발생하면 더 강한 매수 기회를 나타낼 것입니다.
이번 주 ETHUSD 가격 전망은 어떤가요?
이번 주 ETHUSD 가격 전망은 USD 경제 데이터에 크게 의존합니다. 데이터가 약하다면 $1,977.99에 도달할 확률이 40%, 데이터가 강세라면 $1,935.95로 하락할 확률이 60%입니다.
ETHUSD의 주요 지지선과 저항선은 무엇인가요?
ETHUSD의 주요 지지선은 $1,944.73, $1,937.88, $1,932.1에 있으며, 저항선은 $1,957.36, $1,963.14, $1,969.99입니다. 가격이 $1,950.92에서 싸움 중입니다.
오늘 ETHUSD가 움직이는 이유는 무엇인가요?
ETHUSD는 새로운 매도 압력과 다가오는 USD 경제 데이터 발표에 대한 불확실성으로 인해 오늘 움직이고 있습니다. 현재 가격은 $1,950.92 지지선을 테스트하고 있습니다.
ETHUSD는 경제 데이터와 시장 심리에 따라 다음 움직임이 크게 좌우되는 기로에 있습니다. 기술적 상황은 혼합된 신호를 제공하고 있으며, 주요 수준과 DXY를 면밀히 살피는 것이 변동성을 탐색하는 데 중요할 것입니다.