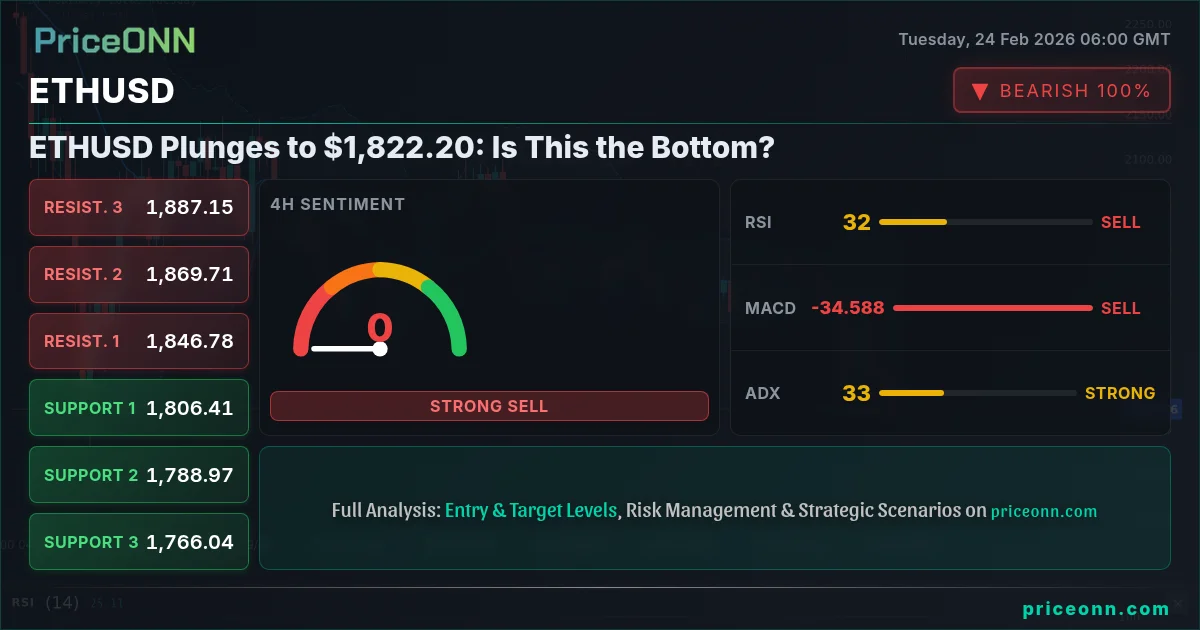
ETHUSD's recent plunge to $1,822.20 has traders wondering if this is a temporary pullback or the start of a deeper correction. The cryptocurrency pair is facing significant bearish pressure, prompting a closer look at the technical indicators and potential trade strategies.
- RSI at 28.01 signals oversold conditions on the 1H chart, suggesting potential for a short-term bounce.
- Key support sits at $1,811.25, a break below which could trigger further downside.
- MACD histogram displays negative momentum, indicating continued bearish pressure despite oversold conditions.
- DXY strength is weighing on ETHUSD, reinforcing the inverse correlation between the two assets.
Technical Indicators Paint a Bearish Picture
The technical landscape for ETHUSD is currently dominated by bearish signals. On the 1-hour chart, the Relative Strength Index (RSI) reads 28.01, venturing into oversold territory, but the underlying trend remains firmly negative. The Moving Average Convergence Divergence (MACD) histogram is displaying negative momentum, reinforcing the selling pressure. The Stochastic oscillator, with K=36.05 and D=36.72, confirms the bearish signal, although it's not yet at extreme levels that would suggest imminent reversal.
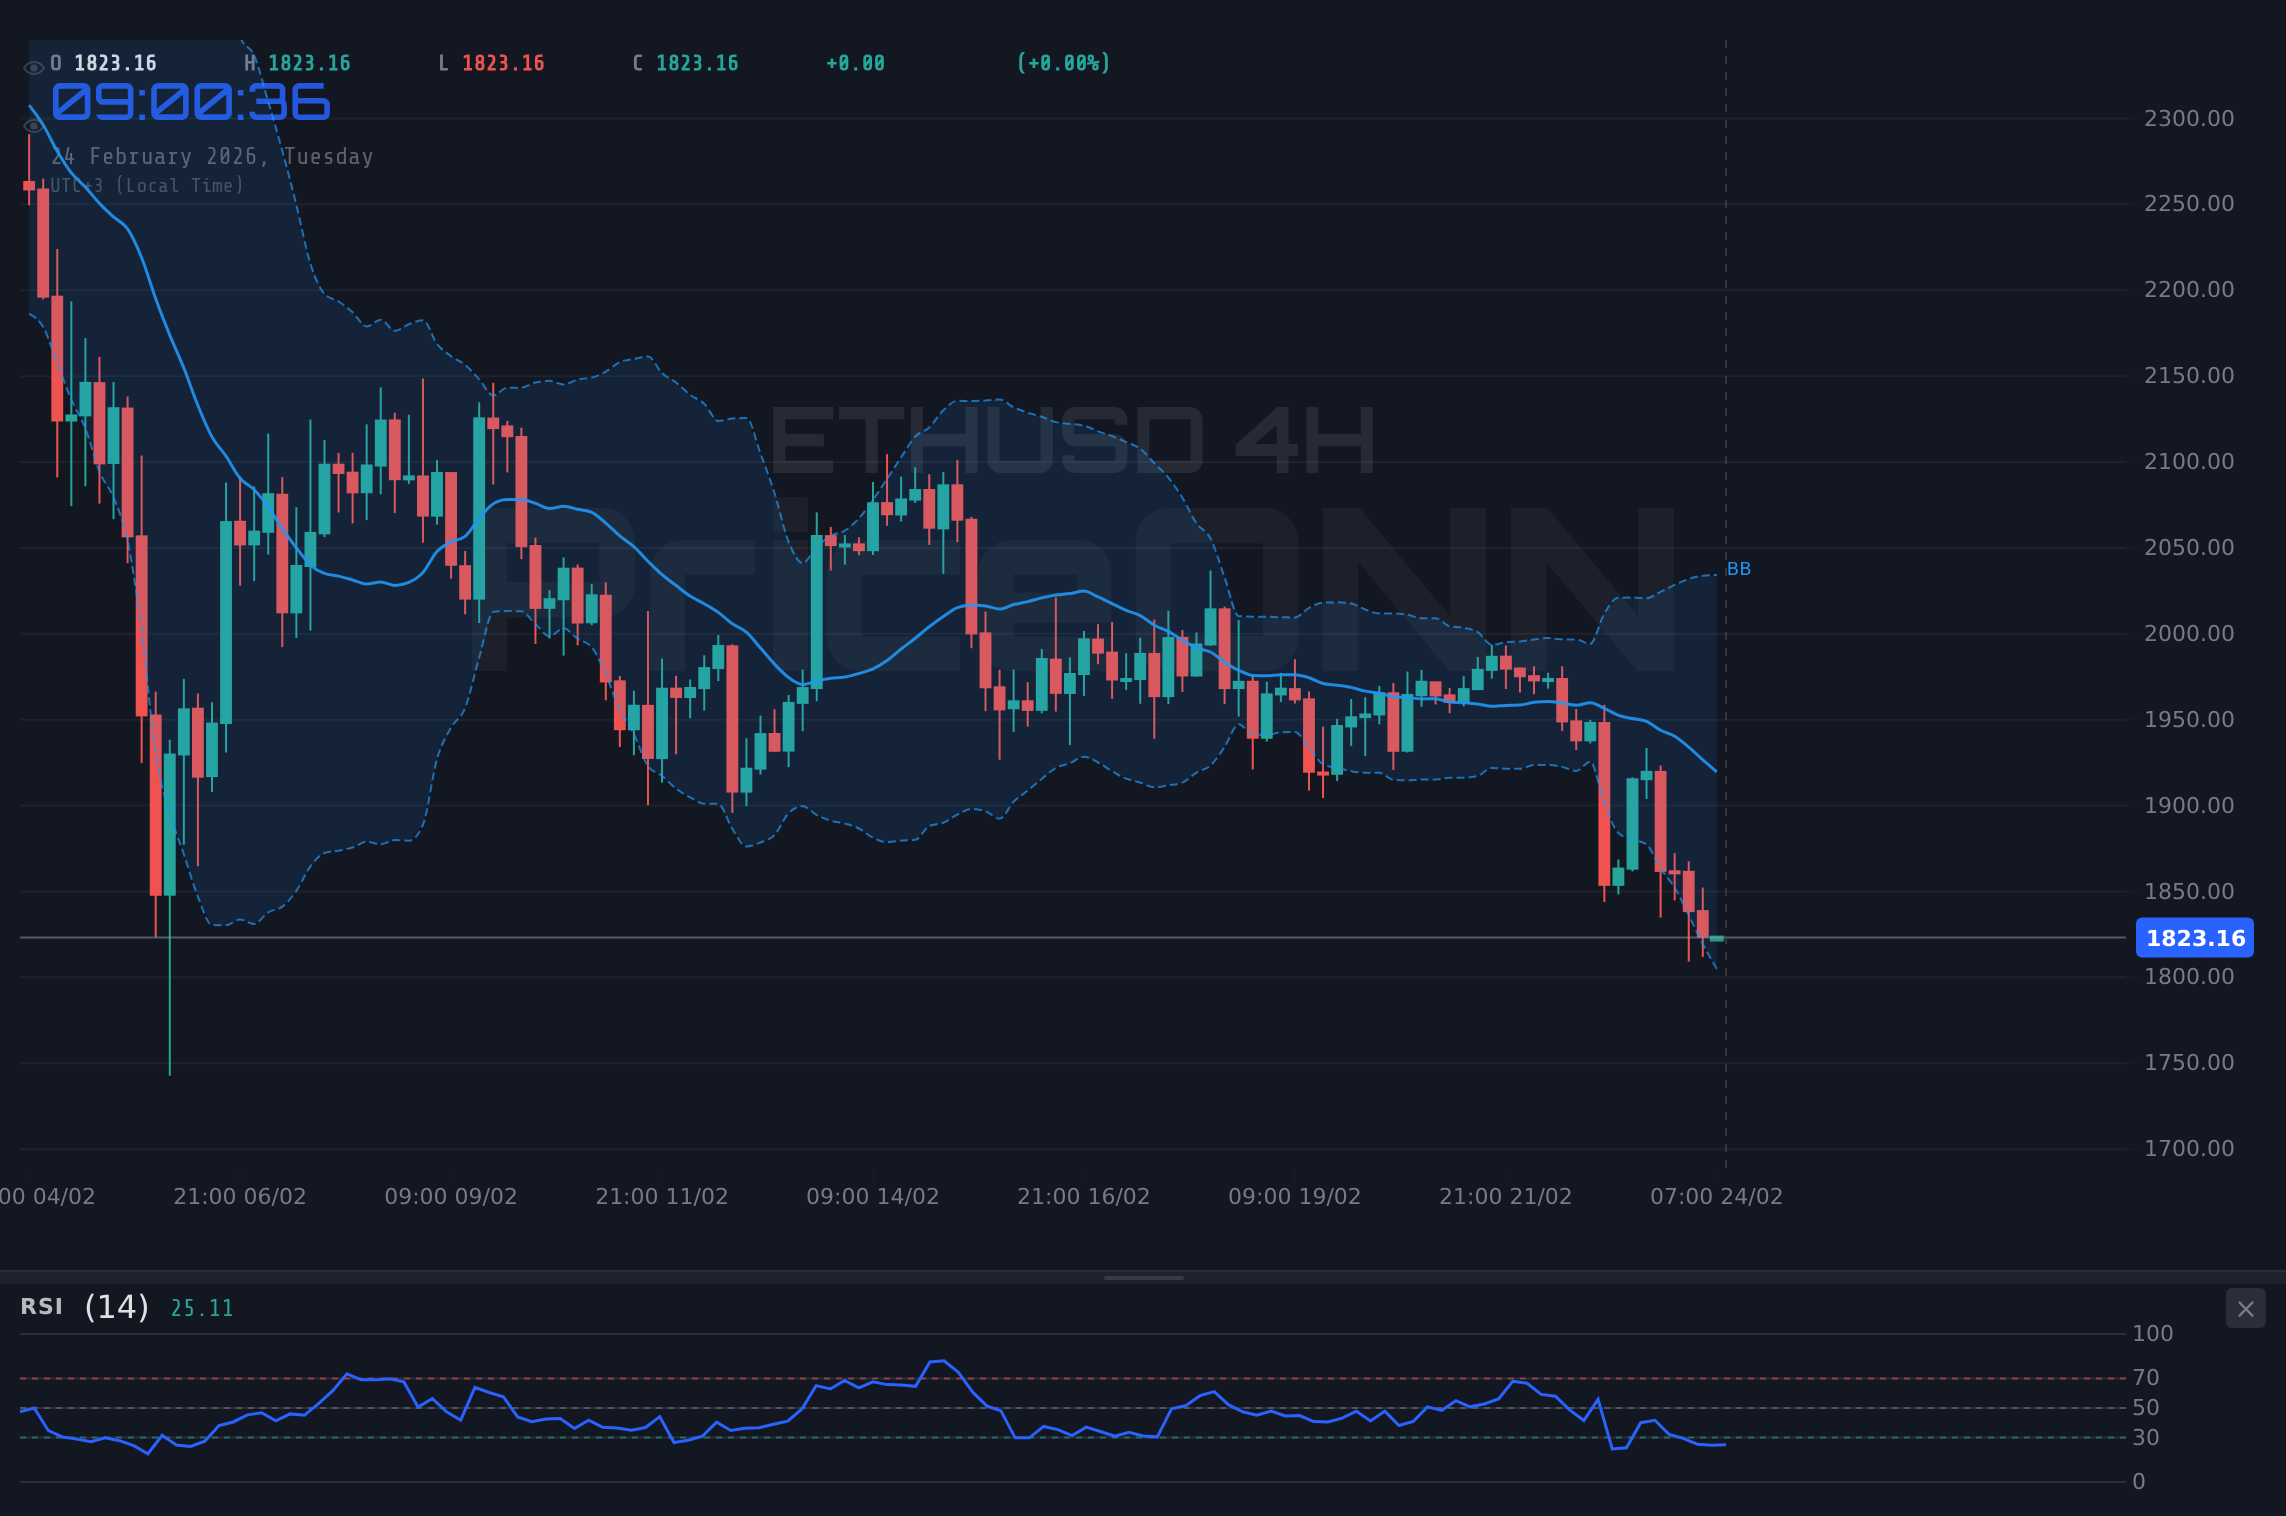
Examining the 4-hour timeframe reveals a similar story. The RSI sits at 31.58, still in neutral territory but trending downward. The MACD histogram, although showing some positive momentum in the past, has now flipped to negative, indicating a potential shift in trend. The Stochastic oscillator, with K=15.16 and D=27.83, is well below the oversold threshold, suggesting that the bearish momentum could continue in the medium term. The Average Directional Index (ADX) is at 31.21, indicating a strong downtrend. This is where it gets interesting, as the ADX confirms the strength of the bearish trend, suggesting that the downtrend has strong momentum.
The daily chart offers a broader perspective. The RSI is at 30.18, still in neutral territory but showing a negative slope. The MACD, while showing some positive momentum in the recent past, is now struggling to maintain its bullish stance. The Stochastic oscillator, with K=12.51 and D=25.84, is deeply oversold, suggesting that the market could be due for a correction. The ADX is extremely high at 57.13, confirming that the downtrend is very strong. This confluence of bearish signals across multiple timeframes suggests that the bearish pressure on ETHUSD could persist in the near term.
Key Price Levels to Watch
From a price action perspective, ETHUSD is currently testing a critical support level. Immediate support lies around $1,820.05, the 1H support level. A break below this level could trigger a further decline towards the next support at $1,811.25, as indicated by the daily chart. A breakdown below this level could open the door for a test of the $1,761.09 support level on the daily timeframe.
On the upside, immediate resistance is found at $1,840.17, the 1H resistance level. A successful break above this level could pave the way for a test of the $1,850.69 resistance level. Beyond that, the $1,935.13 resistance level on the daily chart represents a significant hurdle for the bulls. For swing traders, the $1,840.17 level is absolutely critical and a break above this level would signal a potential shift in momentum. However, until that happens, the bears remain in control.
The Bearish Trend and DXY Strength
The strength of the US Dollar Index (DXY) is playing a significant role in the current weakness of ETHUSD. The DXY is currently trading at 97.56, up 0.15% on the day, which is putting downward pressure on ETHUSD. The inverse correlation between the DXY and ETHUSD is a key factor to consider, as a stronger dollar typically translates into weaker crypto prices. DXY's technicals also support this outlook, with RSI at 62.09 on the 1H chart and ADX at 32.01 on the 4H chart, both indicating bullish momentum for the dollar.
Furthermore, the broader risk-off sentiment in the market is also weighing on ETHUSD. The SP500 is currently trading at 6850.95, up only 0.1%, while the Nasdaq100 is at 24781.76, up 0.23%. These relatively weak performances suggest that investors are hesitant to take on risk, which is further fueling the demand for safe-haven assets like the US dollar. With DXY at 97.56, ETHUSD is under pressure, a trend that is likely to continue as long as the dollar remains strong.
ETHUSD breaks above the $1,840.17 resistance level, fueled by a weakening dollar and renewed risk appetite. Target the $1,850.69 and $1,935.13 resistance levels. Continuation depends on breaking $1,935.13
ETHUSD breaks below the $1,820.05 support level, triggering a wave of selling pressure. Target the $1,811.25 and $1,761.09 support levels. Breakdown confirmed below $1,811.25
Trade Plan: Riding the Bearish Wave
Based on the current technical picture, a short trade on ETHUSD appears to be a high-probability setup. The ADX confirms the strength of the downtrend, while the RSI indicates that the market is not yet deeply oversold. The Stochastic oscillator is showing bearish momentum, and the MACD histogram is displaying negative momentum. This confluence of bearish signals suggests that the downtrend could continue in the near term.
Entry Trigger: Enter short position on a break below $1,820.05, the 1H support level.
Target 1: $1,811.25, the daily support level. This is a conservative target that could be reached within a few hours.
Target 2: $1,761.09, the daily support level. This is a more ambitious target that could be reached within a few days.
Stop/Invalidation: Place stop-loss order above $1,840.17, the 1H resistance level. This level represents a key hurdle for the bulls, and a break above it would invalidate the bearish thesis.
The market is highly volatile, and unexpected events could trigger a sudden reversal. Manage your risk carefully and use appropriate position sizing.
Economic Calendar: Upcoming Events to Watch
Traders should keep a close eye on upcoming economic data releases, as these events could have a significant impact on ETHUSD. The most important events to watch include inflation data (CPI, PCE), employment data (NFP, ADP, unemployment rate), and central bank decisions (Fed, ECB, BOJ). According to Reuters, Fed officials are closely monitoring inflation data, and a stronger-than-expected reading could prompt the central bank to accelerate its tightening cycle. This would likely put further downward pressure on ETHUSD.
The Bottom Line: Patience and Prudent Risk Management
While the technical picture for ETHUSD is currently bearish, it's important to remember that markets are cyclical and conditions can change rapidly. Patient investors should wait for the right setup and manage their risk carefully. The current weakness in ETHUSD could present an opportunity for savvy traders to profit from the downtrend, but it's essential to approach the market with caution and discipline.
Frequently Asked Questions: ETHUSD Analysis
Is ETHUSD a good buy right now?
Currently, ETHUSD is not a strong buy as it trades around $1,822.20 with significant bearish pressure. A potential buying opportunity may arise if it approaches key support levels like $1,811.25, but confirmation of a reversal is needed.
What is the ETHUSD price forecast for this week?
The ETHUSD price forecast for this week is bearish, with potential targets at $1,811.25 and $1,761.09 if the current downtrend continues. A break above $1,840.17 would be needed to change this outlook, but the overall probability favors continued downside.
What are the key support and resistance levels for ETHUSD?
Key support levels for ETHUSD are at $1,820.05, $1,811.25, and $1,761.09. Key resistance levels are at $1,840.17, $1,850.69, and $1,935.13, each posing a hurdle for bullish momentum.
Why is ETHUSD moving today?
ETHUSD is moving lower today due to a strengthening US Dollar Index (DXY) and a broader risk-off sentiment in the market. These factors are putting downward pressure on the cryptocurrency pair, driving it towards key support levels.
Technical Outlook Summary
| Indicator | Value | Signal |
|---|---|---|
| RSI (14) | 30.18 | Oversold |
| MACD Histogram | Negative | Bearish |
| Stochastic | 12.51 / 25.84 | Oversold |
| ADX | 57.13 | Strong Downtrend |
| Bollinger | Lower Band | Oversold |
Key Levels
Support Levels
Resistance Levels
Track markets in real-time
AI-powered analysis, technical indicators and real-time price data.
Join Our Telegram Channel
Breaking market news, AI analysis and trading signals instantly.
Join Channel