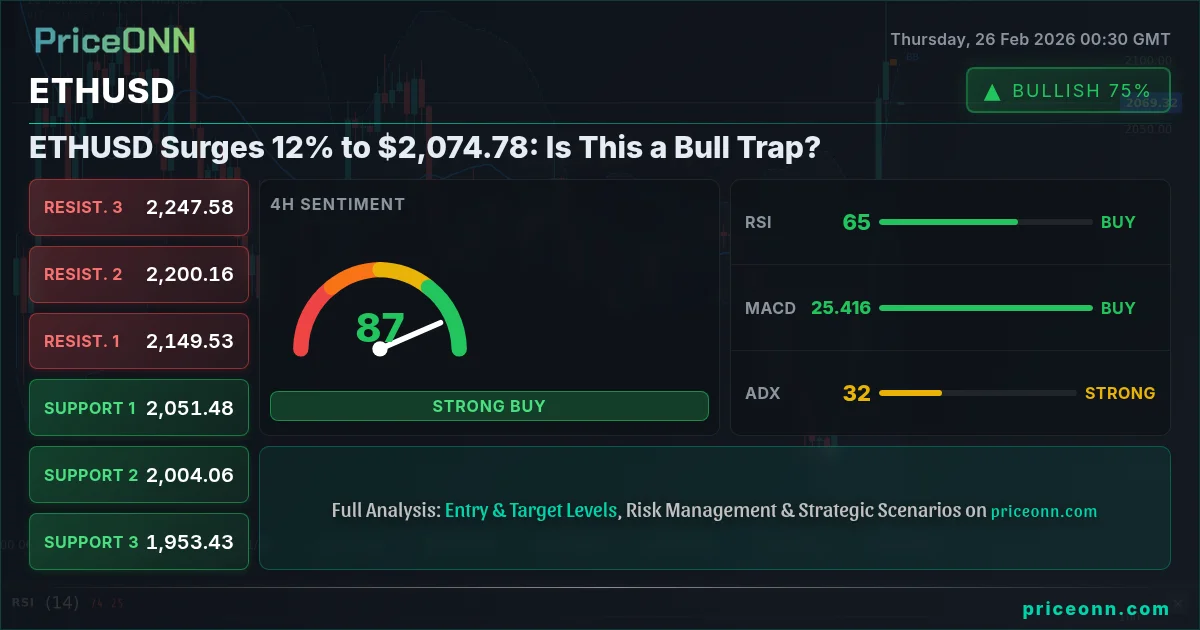
Ethereum (ETHUSD) has staged a dramatic comeback, surging 12% to $2,074.78. This rally has caught many traders off guard, prompting the critical question: Is this a sustainable reversal or a cleverly disguised bear trap designed to lure in unsuspecting bulls before another leg down? The answer hinges on a complex interplay of technical indicators, market sentiment, and upcoming economic data releases.
- RSI at 76.75 on the 1H chart signals short-term overbought conditions, suggesting a potential pullback.
- Key resistance lies at $2,106.25, with a break above needed to confirm a sustained bullish move.
- MACD on the 4H chart shows positive momentum, supporting a continued upward trend in the medium term.
- The upcoming U.S. economic data releases will be crucial in determining the direction of the dollar and, consequently, ETHUSD.
What's Fueling This ETHUSD Rally?
Several factors appear to be contributing to ETHUSD's impressive surge. First, there's a general sense of renewed risk appetite in the market, as evidenced by the SP500's 0.78% gain to 6939.75 and the Nasdaq100's 1.26% jump to 25277.51. This "risk-on" environment tends to favor higher-beta assets like cryptocurrencies, drawing capital away from safe havens like the U.S. dollar.
The DXY (Dollar Index) is currently trading at 97.35, down 0.23% on the day. A weaker dollar typically provides a tailwind for ETHUSD, as it makes the cryptocurrency relatively cheaper for investors holding other currencies. The negative momentum on the DXY could be a result of the better than expected EUR data with EUR inflation at 0.3% and EUR unemployment at 1.7%.
Technicals Paint a Mixed Picture
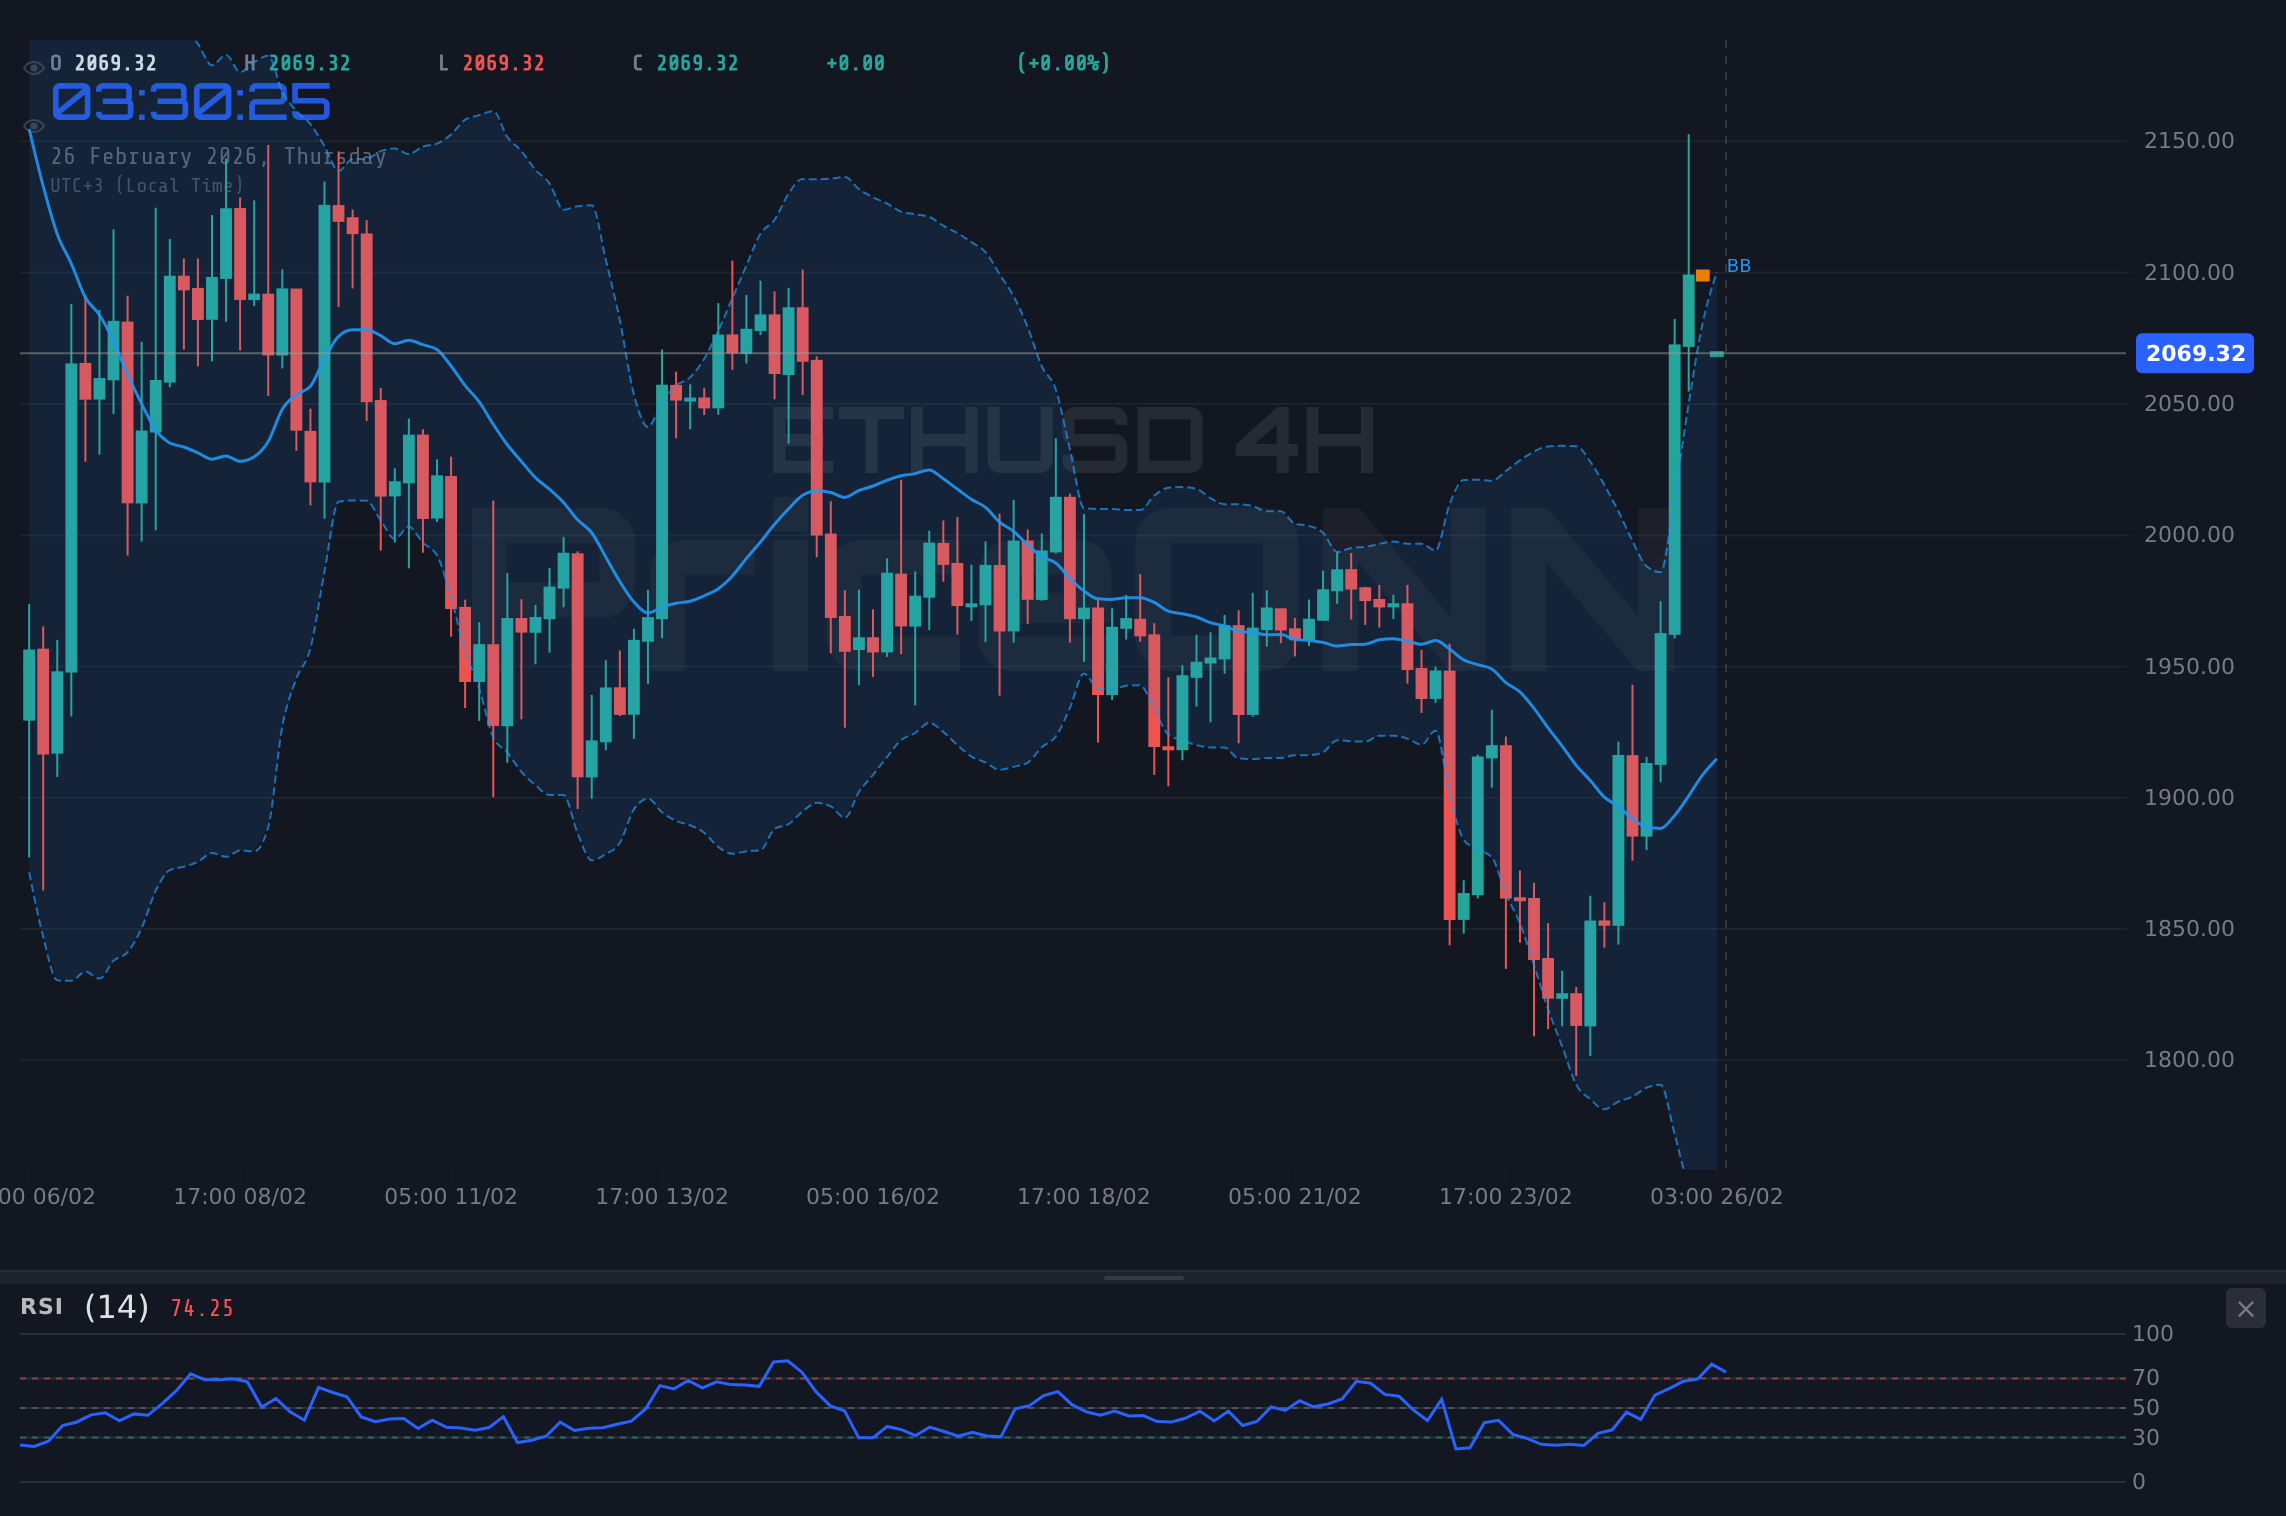
While the fundamental backdrop appears supportive, the technical picture for ETHUSD is more nuanced. On the hourly chart, the RSI is flashing a warning sign, currently at 76.75, indicating overbought conditions. This suggests that the rally may be running out of steam in the short term, and a pullback could be imminent. However, the ADX on the 1H chart is at 49.68, signaling a strong uptrend. This means the current bullish momentum is significant and shouldn't be dismissed.
Zooming out to the 4-hour chart, the technicals present a more bullish outlook. The MACD histogram is positive, indicating strong upward momentum. However, the Stochastic indicator shows a K value of 89.28, suggesting the asset is approaching overbought territory. Key resistance to watch lies at 2106.25. A decisive break above this level would likely attract further buying interest and pave the way for a test of higher targets.
The Importance of Economic Data
The near-term trajectory of ETHUSD will likely be heavily influenced by upcoming U.S. economic data releases. Investors are eagerly awaiting the data release to see how it will affect the Federal Reserve's policy outlook. Stronger-than-expected data could lead to a hawkish shift in Fed policy, boosting the dollar and potentially weighing on ETHUSD. Conversely, weaker data could reinforce expectations of a dovish pivot, weakening the dollar and providing further upside for ETHUSD.
According to Reuters, several Fed officials have recently emphasized the need for continued vigilance in the fight against inflation, suggesting that the central bank is in no hurry to cut interest rates. This hawkish rhetoric has contributed to the dollar's recent strength, putting pressure on ETHUSD. However, Bloomberg data shows that market participants are still pricing in a significant probability of rate cuts later this year, creating a potential tug-of-war between the Fed and the market.
Key Levels to Watch for ETHUSD
For bullish traders, the immediate focus is on breaking above the 2106.25 resistance level. A successful breakout could trigger a rally towards 2130.71 and potentially even 2148.01. On the downside, key support levels to watch are 2064.49, 2047.19, and 2022.73. A break below 2064.49 would invalidate the bullish thesis and open the door for a deeper correction.
It's also worth noting that the 1D timeframe still shows a bearish trend, with an ADX of 54.14. This is in contrast to the shorter timeframes, which are showing a more bullish picture. This divergence suggests that the current rally may be a counter-trend move within a larger downtrend. The 1D RSI is at 46.16, leaving plenty of room for further upside before reaching overbought territory.
ETHUSD Trade Plan
ETHUSD breaks above 2106.25 resistance, fueled by positive market sentiment and continued dollar weakness. Targets include 2130.71 and 2148.01, with potential for further gains if the rally gains momentum.
ETHUSD fails to sustain the breakout and falls below 2064.49 support, triggering a correction. Targets include 2047.19 and 2022.73, with potential for further losses if risk aversion intensifies.
Now, this is where it gets interesting! Remember, the market always gives a second chance. So, manage your risk and wait for your setup with patience. The market is a marathon, not a sprint.
The Verdict: Patience is Key
ETHUSD's 12% surge to $2,074.78 is undoubtedly impressive, but it's crucial to approach this rally with caution. The mixed technical signals, coupled with the uncertainty surrounding upcoming economic data releases, suggest that a period of consolidation or correction may be on the horizon. Until we see a decisive break above 2106.25 or a breakdown below 2064.49, patience is the name of the game. Manage your risk, wait for your setup - the market always gives a second chance.
Frequently Asked Questions: ETHUSD Analysis
Is ETHUSD a good buy right now?
ETHUSD at $2,074.78 shows bullish momentum but is overbought on the 1H chart. A buy is justified on a break above 2106.25, targeting higher levels, but with a stop-loss below 2064.49 to manage risk.
What is the ETHUSD price forecast for this week?
The ETHUSD price forecast for this week is bullish if it breaks above 2106.25, targeting 2130.71 and 2148.01. However, a failure to break higher could lead to a pullback to 2064.49 or lower, with a probability of 40%.
What are the key support and resistance levels for ETHUSD?
Key support levels for ETHUSD are 2064.49, 2047.19, and 2022.73. Key resistance levels are 2106.25, 2130.71, and 2148.01. These levels will act as potential turning points for price action.
Technical Outlook Summary
| Indicator | Value | Signal |
|---|---|---|
| RSI (14) | 46.16 | Neutral |
| MACD Histogram | Positive | Bullish |
| Stochastic | 37.31 | Bullish |
| ADX | 54.14 | Strong Downtrend |
| Bollinger | Upper Band | Watch |
Key Levels
Support Levels
Resistance Levels
Track markets in real-time
AI-powered analysis, technical indicators and real-time price data.
Join Our Telegram Channel
Breaking market news, AI analysis and trading signals instantly.
Join Channel