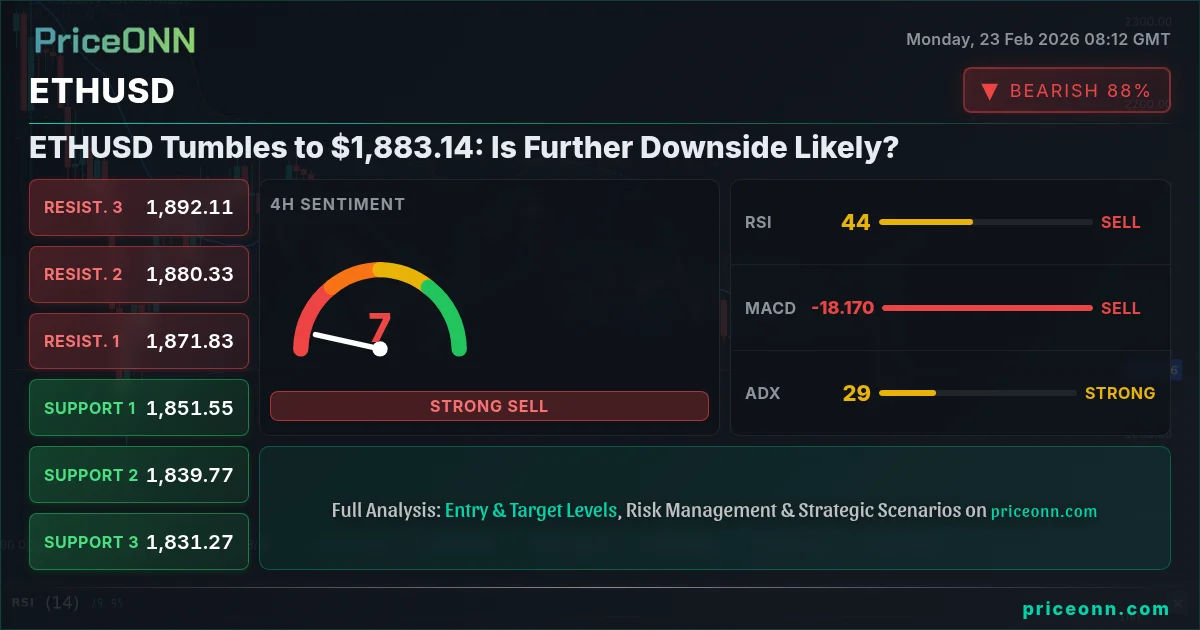
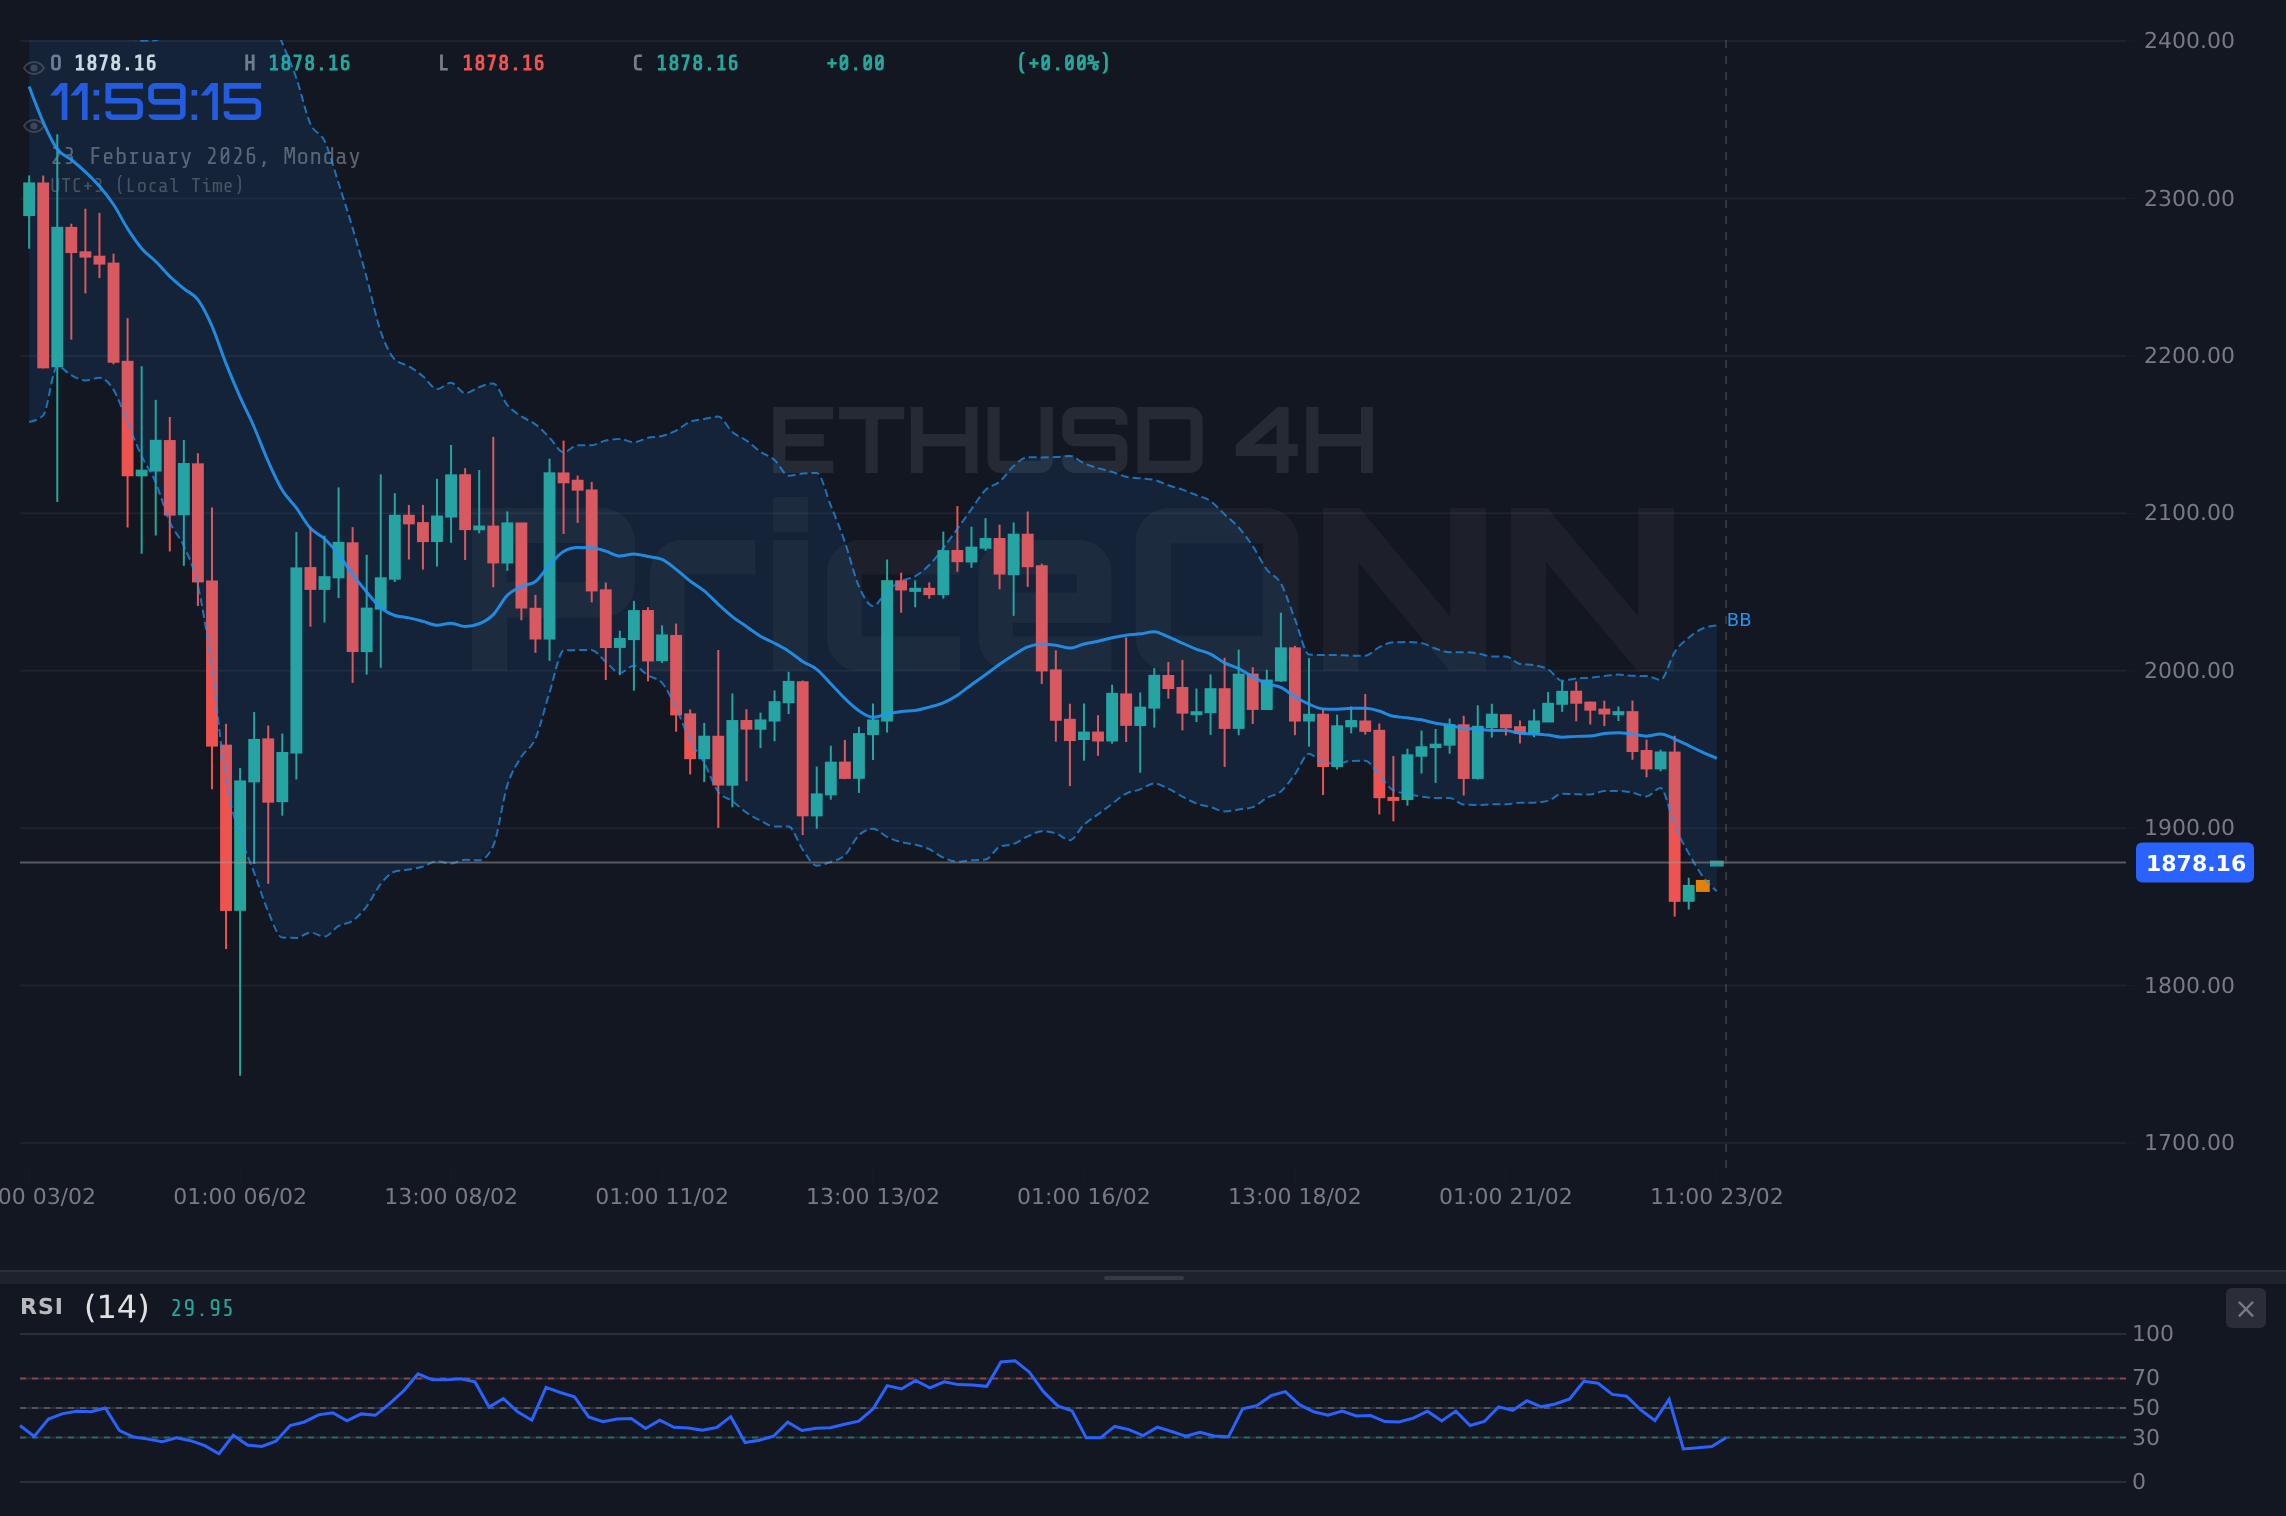
Ethereum (ETHUSD) is currently trading at $1,883.14, a significant dip that has caught the attention of traders and investors alike. This move raises critical questions about the short-term and medium-term trajectory of the cryptocurrency. Is this a temporary pullback, or does it signal the beginning of a deeper correction? Let's dive into the technical analysis to uncover potential answers.
- ETHUSD currently trades at $1,883.14, marking a significant daily decline of -3.33%.
- Key support level to watch is $1,812.22, the 4H support 1 level.
- Bearish momentum is confirmed by ADX at 28.93 on the 4H chart, indicating a strong downtrend.
- Stochastic Oscillator (4H) shows oversold conditions, hinting at a possible short-term bounce.
Technical Overview: ETHUSD's Bearish Turn
The recent price action in ETHUSD reveals a clear shift in momentum. The daily decline of -3.33% is not just a blip; it’s a signal that the bears are gaining control. Examining the shorter timeframes offers further insights. On the 1-hour chart, the Relative Strength Index (RSI) stands at 34.8, indicating that the asset is approaching oversold territory. However, it's crucial to note that oversold conditions don't automatically translate into a bullish reversal. It simply means that the selling pressure has been intense, and a temporary bounce is possible. The Moving Average Convergence Divergence (MACD) histogram, currently in negative territory, reinforces the bearish sentiment. The fact that ETHUSD is trading below its middle Bollinger Band further confirms the current downtrend.
Zooming out to the 4-hour timeframe, the picture becomes even clearer. The ADX indicator registers at 28.93, signaling a strong downtrend. This is not a weak, meandering move; it’s a decisive push by the sellers. The Stochastic Oscillator, while showing oversold conditions with K=19.58 and D=27.49, needs to be interpreted with caution. In a strong downtrend, oversold readings can persist for extended periods, offering false signals to those looking for a quick reversal. The key here is to wait for confirmation signals, such as a bullish divergence or a break above a key resistance level.
The daily chart presents a broader perspective. While the RSI at 32.33 may seem to suggest an imminent bounce, the overall trend remains bearish. The MACD, although showing positive momentum, needs to be viewed in context. It's possible that this positive momentum is simply a reflection of a minor pullback within a larger downtrend. The ADX indicator, registering a very strong downtrend at 56.66, is a critical piece of the puzzle. This high ADX value indicates that the current downtrend is not only strong but also likely to persist.
Key Price Levels to Watch
Identifying key support and resistance levels is crucial for navigating the current market conditions. On the 4-hour chart, the first support level to watch is $1,812.22. A break below this level could open the door for a further decline towards $1,770.60 and potentially even $1,697.36. On the upside, the first resistance level to monitor is $1,927.08. A sustained break above this level would be needed to negate the current bearish bias. Further resistance levels lie at $2,000.32 and $2,041.94.
It's important to remember that these levels are not static; they can shift as the market evolves. Keep an eye on price action around these levels, looking for signs of rejection or acceptance. A rejection at a resistance level would reinforce the bearish sentiment, while a sustained break above a resistance level would suggest that the bulls are regaining control.
Trade Plan: Riding the Bearish Wave
Given the current technical picture, a short-term bearish trading strategy appears to be the most prudent approach. However, it's essential to manage risk effectively and avoid impulsive decisions. Here's a potential trade plan to consider:
Enter short position if price breaks below $1,865.35 (1H support 1). Target 1: $1,812.22 (4H support 1). Target 2: $1,770.60 (4H support 2). This scenario is highly probable (65%) given the current trend and momentum.
A sustained break above $1,927.08 (4H resistance 1) would signal a potential shift in momentum. In this case, consider a long position with Target 1: $2,000.32 (4H resistance 2). Target 2: $2,041.94 (4H resistance 3). Probability: 35%.
Stop-loss: Place a stop-loss order above $1,902.51 (1H resistance 3) to protect against unexpected bullish reversals. This level acts as an invalidation point for the bearish scenario. Remember to adjust your position size to align with your risk tolerance and account size.
Economic Calendar and Potential Catalysts
While technical analysis provides valuable insights, it's crucial to consider the broader macroeconomic context. Keep a close eye on upcoming economic data releases, particularly those related to the US dollar. Any surprises in these releases could trigger significant volatility in ETHUSD. For example, any positive surprises in the upcoming USD data events could lead to further selling pressure on ETHUSD. Conversely, any negative surprises could provide a temporary boost to the cryptocurrency.
Given the current geopolitical landscape, safe-haven assets like gold (XAUUSD) and the US dollar (DXY) may experience increased demand. As the DXY is currently trending downwards at 97.14, this offers some support to ETHUSD, however, this could change rapidly. According to Reuters, the Fed is closely monitoring inflation data before making any decisions on interest rates. These decisions will significantly impact the broader market sentiment and, consequently, ETHUSD's price action.
Alternative Scenario: A Bullish Reversal?
While the current technical picture favors the bears, it's essential to consider the possibility of a bullish reversal. For this scenario to materialize, ETHUSD would need to break above several key resistance levels. A sustained break above $1,927.08 (4H resistance 1) would be the first sign that the bulls are regaining control. This would need to be followed by a break above $2,000.32 (4H resistance 2) to confirm the bullish reversal. However, until these levels are breached, the bearish bias remains intact.
Multi-Timeframe Analysis: Aligning the Signals
Combining insights from different timeframes can provide a more comprehensive understanding of ETHUSD's current market conditions. While the 1-hour and 4-hour charts suggest a bearish bias, the daily chart presents a slightly more nuanced picture. The daily RSI, although in neutral territory, is trending downwards, indicating that the selling pressure is still present. The MACD, while showing positive momentum, needs to be viewed with caution, as it could simply be reflecting a minor pullback within a larger downtrend.
The key takeaway from the multi-timeframe analysis is that the bearish momentum is dominant across the shorter timeframes, while the longer timeframe (daily) presents a more mixed picture. This suggests that the current downtrend is likely to persist in the short term, but a potential bullish reversal cannot be ruled out in the medium term. Therefore, traders should focus on short-term bearish trading strategies while remaining vigilant for signs of a potential bullish reversal.
Frequently Asked Questions: ETHUSD Analysis
Is ETHUSD a good buy right now?
Given the current bearish momentum and the price at $1,883.14, ETHUSD is not a strong buy right now. A potential buy opportunity may arise if the price breaks above $1,927.08, signaling a shift in momentum.
What is the ETHUSD price forecast for this week?
The ETHUSD price forecast for this week leans bearish, with a potential target of $1,812.22 and $1,770.60 if the downtrend continues. A bullish reversal is less likely but could target $1,927.08.
What are the key support and resistance levels for ETHUSD?
Key support levels for ETHUSD are $1,812.22 and $1,770.60. Key resistance levels are $1,927.08 and $2,000.32, all according to the 4H chart.
Why is ETHUSD moving today?
ETHUSD is moving lower today due to a combination of factors, including a broader market selloff and increasing bearish momentum, as confirmed by technical indicators like the ADX.
📊 Technical Görünüm Summaryi
| Gösterge | Değer | Sinyal |
|---|---|---|
| RSI (14) | 34.8 (1H) | Düşüş |
| MACD Histogram | Negatif (1H) | Düşüş |
| Stochastic | 26.53/15.84 (1H) | Yükseliş |
| ADX | 28.93 (4H) | Güçlü Düşüş |
| Bollinger | Alt Bant (1H) | Dikkat |
🎯 Kritik Seviyeler
Support Levels
Resistance Levels
Track markets in real-time
AI-powered analysis, technical indicators and real-time price data.
Join Our Telegram Channel
Breaking market news, AI analysis and trading signals instantly.
Join Channel