
ETHUSD Weekly Outlook: Navigating Choppy Waters at $2,051.68
ETHUSD hovers around $2,051.68 amid mixed signals. Key levels to watch next week include $2,042.71 support and $2,059.03 resistance as traders eye macro data.
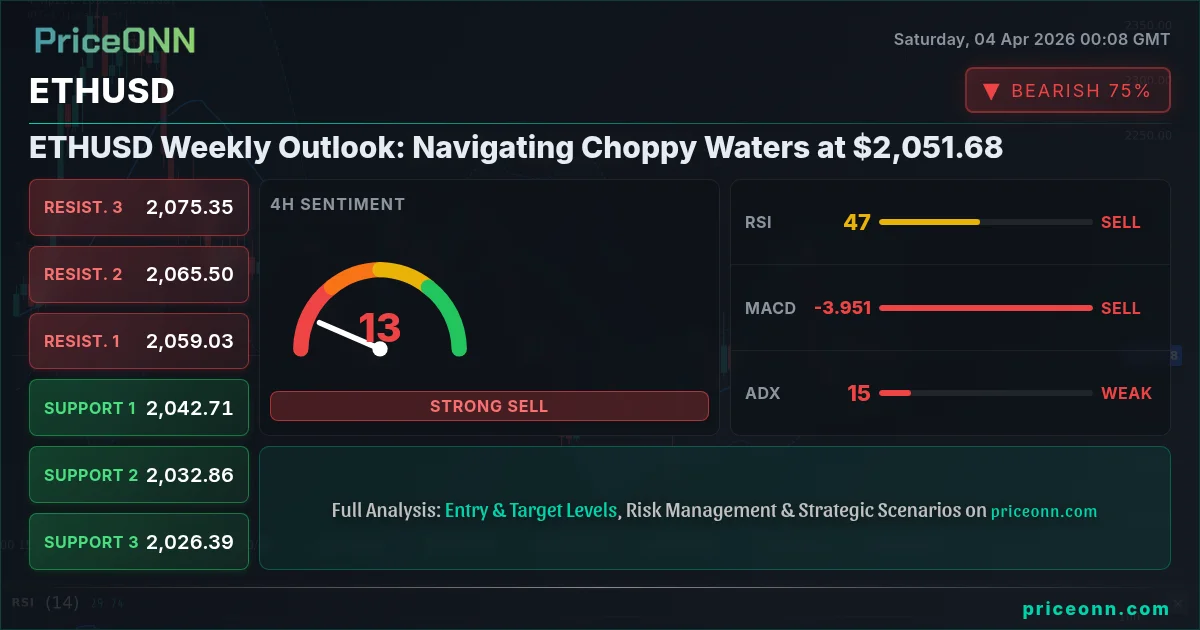
The cryptocurrency market, often a rollercoaster of volatility, finds Ethereum's native token, ETHUSD, in a particularly interesting spot this week. Trading around the critical $2,051.68 mark, ETHUSD is presenting a complex picture, characterized by conflicting technical signals and a market sentiment that’s anything but clear. Last week saw ETHUSD hover in a tight range, with significant price action confined between the support at $2,042.71 and resistance at $2,059.03 on the 4-hour chart. This consolidation phase, while lacking dramatic moves, is crucial for understanding where the digital asset might head next. The absence of a strong directional trend on the daily timeframe, with ADX hovering around a weak 13.2, suggests that the market is in a holding pattern, waiting for a catalyst to break the stalemate. This is precisely where a trader's patience and keen eye for detail become paramount. Understanding the nuances of ETHUSD's current technical setup, coupled with the broader macro-economic backdrop and crypto-specific developments, is key to navigating these choppy waters.
- ETHUSD is consolidating around $2,051.68, with the 4-hour chart showing support at $2,042.71 and resistance at $2,059.03.
- The daily ADX is a weak 13.2, indicating a lack of strong trend and suggesting a market in a holding pattern.
- On the 1-hour timeframe, RSI is at 47.47 and MACD shows positive momentum, but the 4-hour and daily charts present a more bearish outlook with negative MACD momentum and RSI below 50.
- The prevailing trend on the daily chart is neutral, with a slight bearish bias indicated by the MACD signal line.
Navigating the ETHUSD Consolidation: A Tale of Two Timeframes
The Short-Term Pulse: Mixed Signals on the Hourly Chart
Zooming into the 1-hour chart for ETHUSD, we see a fascinating interplay of indicators that, at first glance, might suggest a bullish lean. The Relative Strength Index (RSI(14)) stands at 47.47, a level that, while below the 50 mark, shows a slight upward trajectory from its recent lows, hinting that the selling pressure might be easing. More compellingly, the Moving Average Convergence Divergence (MACD) indicator is displaying positive momentum, with the MACD line currently above its signal line. This often signals a potential shift in market sentiment towards buying. The Bollinger Bands, while positioned below the middle band, are also showing an upward lean in price as it oscillates, suggesting that buyers are stepping in at lower levels. Stochastic Oscillator, with %K at 65.77 and %D at 39.84, is firmly in bullish territory and showing a clear upward crossover, reinforcing the idea of short-term buying interest. The ADX at 13.98 on this timeframe, however, paints a picture of a very weak trend, suggesting that any upward movement might lack conviction and could easily reverse. This confluence of signals on the hourly chart presents a scenario where short-term traders might be looking for an entry, anticipating a bounce from current levels. The general signal on this timeframe leans towards neutral, with an equal number of buy and sell signals, reflecting this indecision.
The price action itself, hovering around $2,051.68, is caught between the immediate support at $2,045.64 and resistance at $2,055.91. A sustained move above $2,055.91 could indeed spark a short-term rally, perhaps targeting the $2,061.94 level. Conversely, a break below $2,045.64 might invite further selling, potentially pushing ETHUSD towards the $2,041.40 support. This short-term indecision is precisely what makes the hourly chart a tricky place to base major trading decisions without broader confirmation. It’s like watching a boat bobbing in the water before a storm – there’s movement, but the overall direction is still uncertain.
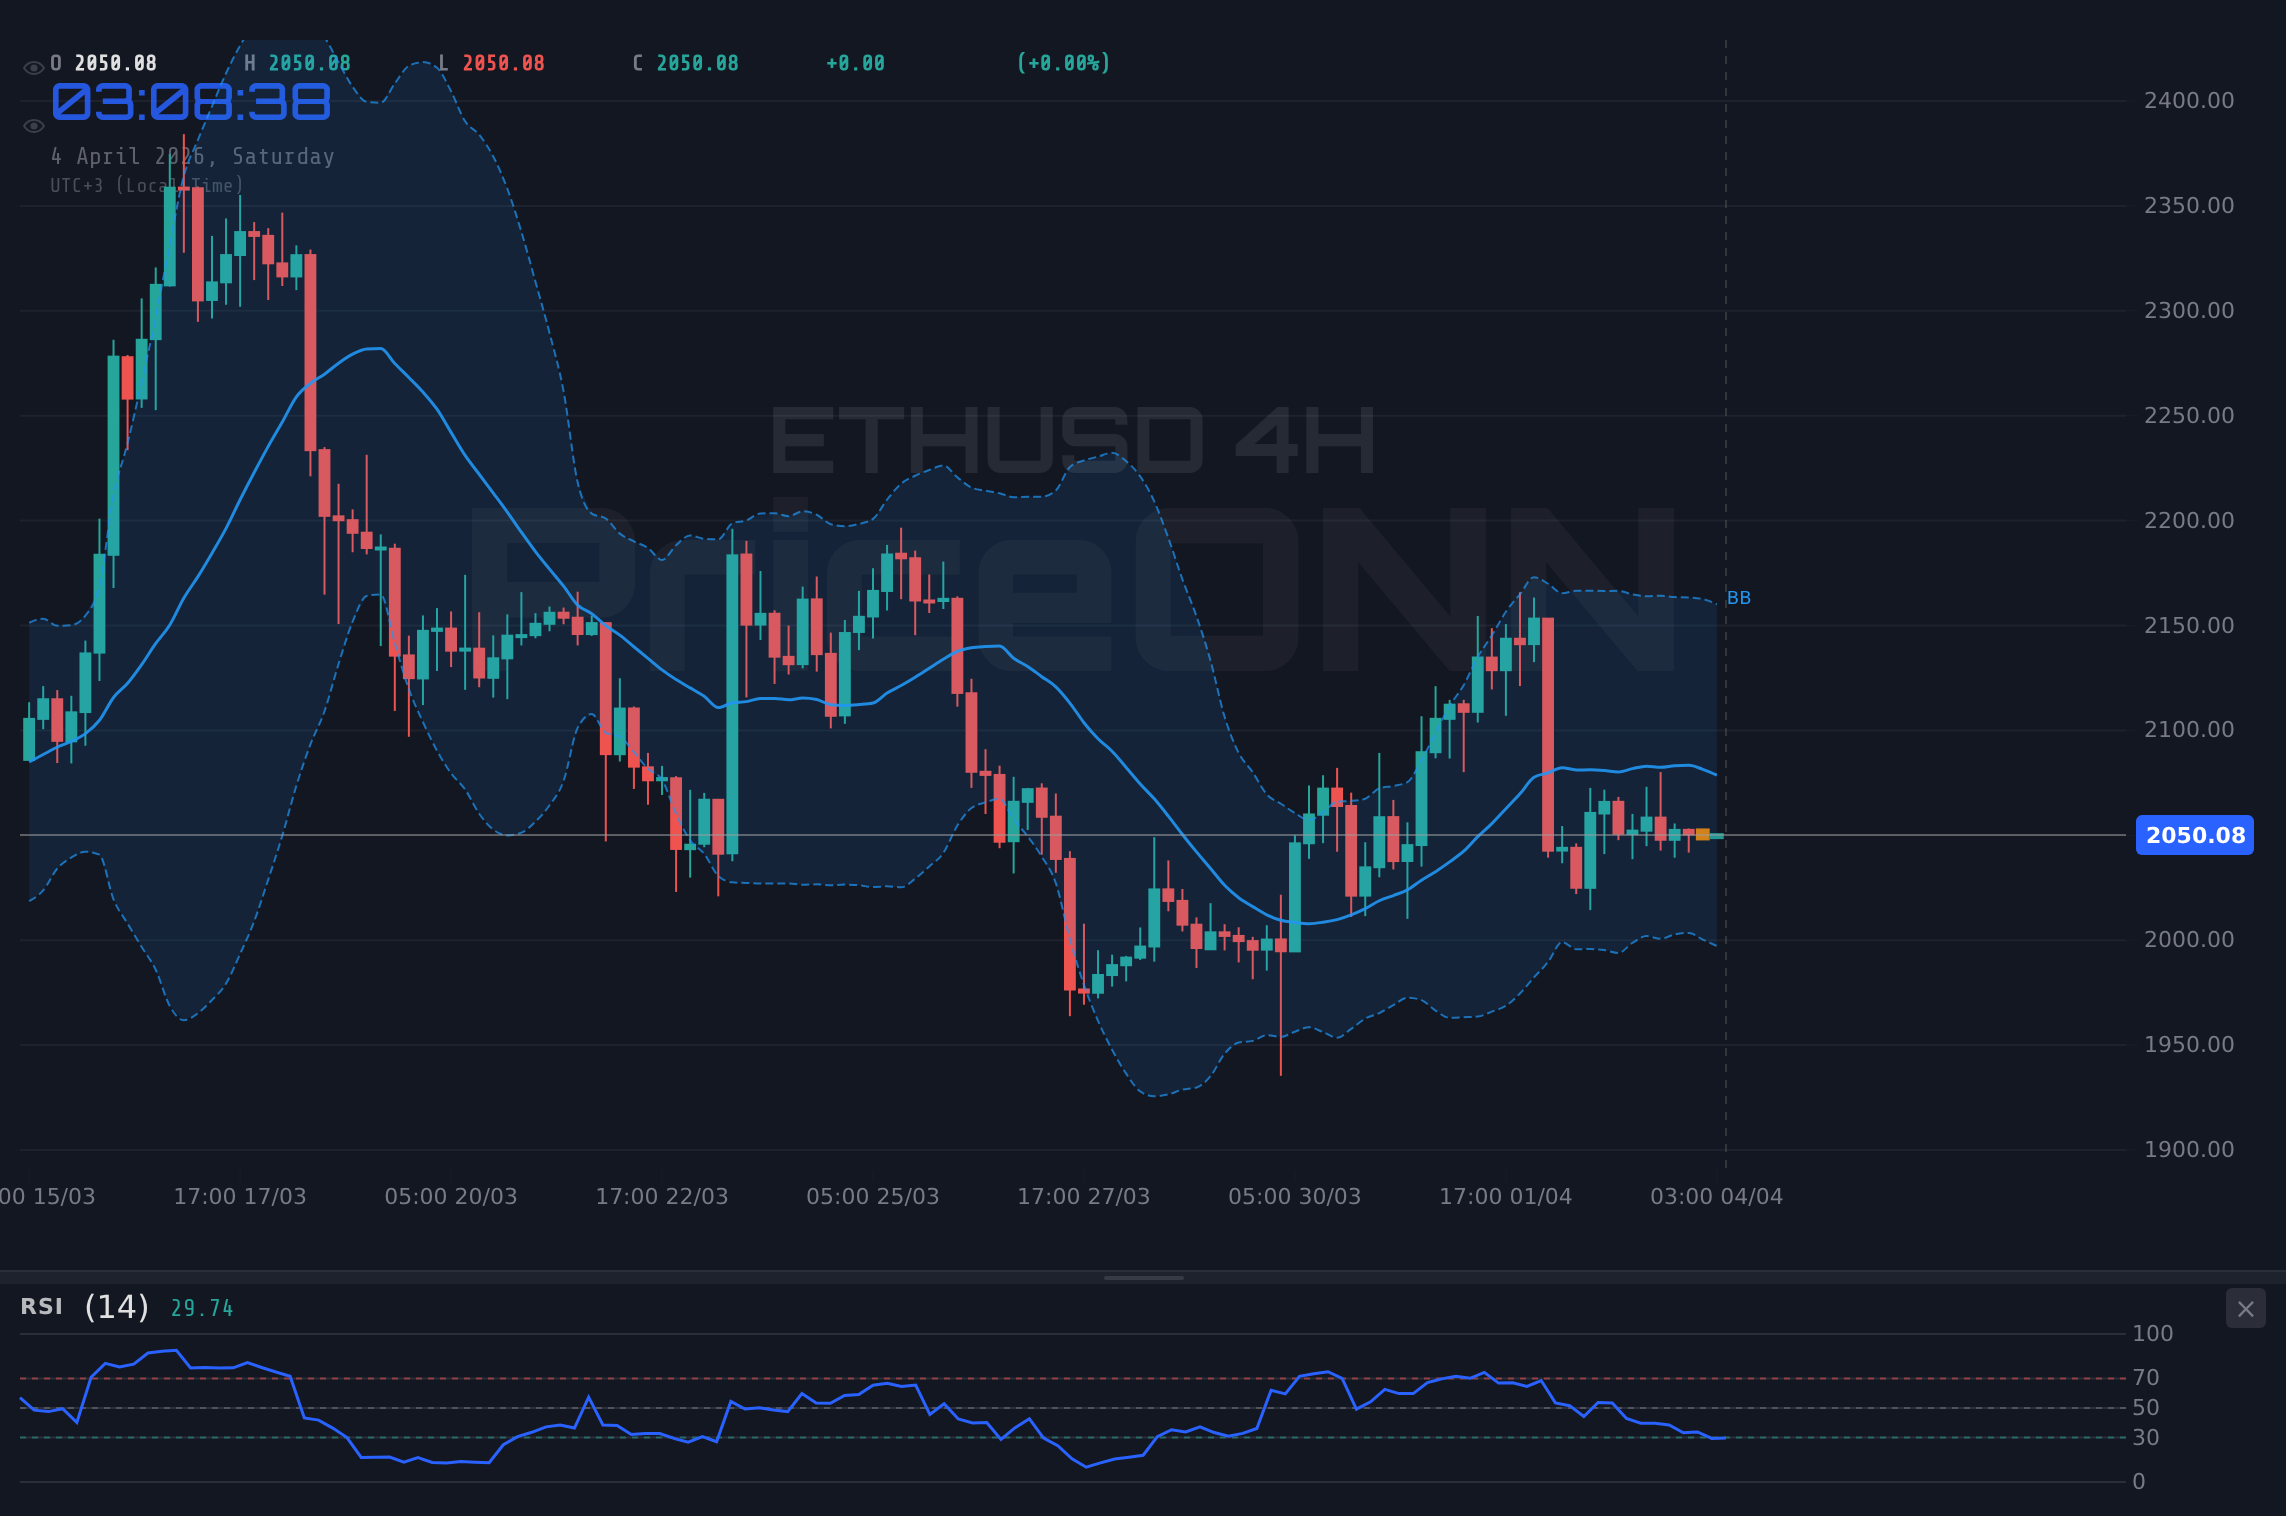
The Mid-Term View: 4-Hour Chart Flags Caution
Stepping back to the 4-hour chart, the narrative begins to shift. Here, the RSI(14) sits at 46.6, firmly in neutral territory but trending downwards, suggesting that the upward momentum seen on the hourly chart may not be sustainable. The MACD on this timeframe is decidedly bearish, with negative momentum and the MACD line below its signal line. This indicates that sellers are currently in control over the medium term, and any rallies might be met with resistance. The Bollinger Bands are also positioned below the middle band, aligning with the bearish MACD signal and suggesting a downward bias. Stochastic Oscillator, with %K at 46.34 and %D at 32.22, shows a bullish crossover, but this is happening from oversold levels and needs to be interpreted cautiously, especially given the bearish MACD. The ADX, at 14.7, continues to signal a weak trend, reinforcing the idea that the current price action is more range-bound than trending. The overall signal on the 4-hour chart leans towards a sell, with more sell signals than buy signals. This divergence between the hourly and 4-hour charts highlights the importance of multi-timeframe analysis; what looks like an opportunity on one timeframe can be a trap when viewed in a broader context.
The key levels on the 4-hour chart are more pronounced. Support is identified at $2,042.71, $2,032.86, and $2,026.39. Resistance levels are situated at $2,059.03, $2,065.50, and $2,075.35. A break below the $2,042.71 support level would likely confirm the bearish sentiment from this timeframe, potentially initiating a move towards $2,032.86. Conversely, a strong push above the $2,059.03 resistance, coupled with increasing volume and bullish confirmation from other indicators, would be needed to invalidate the bearish outlook and signal a potential move higher. For now, the 4-hour chart suggests caution and a bias towards potential downside.
The Daily Grind: Long-Term Trend Remains Neutral, Leaning Bearish
Daily Chart Dynamics: Where the Long Game is Played
Shifting our focus to the daily chart, the overarching trend for ETHUSD is decidedly neutral, but with undertones that suggest caution. The RSI(14) is at 47.27, a level that indicates neither overbought nor oversold conditions but leans towards a bearish sentiment as it hovers below the 50 mark and shows a downward trend. This suggests that buyers have not yet established firm control. The MACD indicator on the daily chart mirrors the bearish sentiment seen on the 4-hour timeframe; it’s in negative momentum territory with the MACD line below its signal line. This is a classic sign that the longer-term trend, if one were to emerge, would likely be downwards unless significant buying pressure emerges. The Bollinger Bands are also positioned below the middle band, reinforcing the bearish bias and indicating that price action is currently below the average trading range, potentially signaling weakness or an opportunity for a rebound if support holds.
The Stochastic Oscillator, however, presents a bit of a dichotomy. With %K at 58.72 and %D at 42.75, it shows a bullish crossover and is moving upwards from oversold territory. This could signal a potential reversal or a bounce from current levels. Yet, this bullish signal from the Stochastic must be weighed against the bearish signals from both the MACD and the RSI. Such conflicting signals are common in neutral markets and underscore the need for patience. The ADX, a measure of trend strength, is at a very low 13.2 on the daily chart. This signifies a very weak trend, meaning that any moves, whether up or down, are likely to lack sustained momentum. This aligns with the consolidation observed across multiple timeframes. The overall signal on the daily chart leans towards a sell, again reflecting the cautious approach needed.
The major support levels identified on the daily chart are at $1,999.05, $1,932.20, and $1,900.06. Resistance is seen at $2,148.04, $2,230.18, and $2,297.03. A break below the $1,999.05 support would be a significant bearish development, potentially triggering a cascade towards lower levels. On the other hand, a decisive move and sustained close above the $2,148.04 resistance would be necessary to challenge the bearish sentiment and signal a potential trend reversal. For now, the daily chart suggests ETHUSD is in a precarious position, lacking a clear directional conviction but with underlying bearish indicators.
Crypto-Specific Fundamentals: Beyond the Charts
On-Chain Metrics: A Mixed Bag for Ethereum
While technical indicators provide a snapshot of market sentiment and price action, delving into on-chain metrics offers a deeper understanding of Ethereum's underlying health and investor behavior. Active addresses on the Ethereum network have shown some resilience, but not the explosive growth that typically accompanies a strong bullish phase. This suggests that while existing users are active, attracting new, significant participation remains a challenge. Whale movements, those large holders of ETH, have been relatively subdued. There hasn’t been a significant accumulation or distribution phase that would clearly signal a directional bias from the major players. This lack of decisive action from whales often contributes to the sideways price action we are observing. Exchange flows also paint a mixed picture. While there hasn’t been a massive outflow of ETH from exchanges, which would typically signal long-term holding sentiment, there also hasn’t been a significant inflow indicating an immediate sell-off. This neutral flow suggests that current holders are largely holding their positions, waiting for clearer market direction.
The hash rate, a measure of the network's security and computational power, has remained robust, which is a positive fundamental sign for Ethereum's long-term viability. However, this security metric doesn't directly translate into immediate price appreciation, especially when broader market sentiment is cautious. Gas fees, while not currently at extreme highs, remain a persistent concern for mass adoption. The ongoing development of Layer 2 solutions like Optimism and Arbitrum aims to address this, but their success in achieving stable, low fees is critical for Ethereum's ability to onboard mainstream users. Recent news highlighted the challenge for Ethereum Layer 2s to achieve stable fees for mass adoption, indicating that this is still an area requiring significant development and innovation. This persistent issue, even with scaling solutions, can act as a subtle headwind for broader adoption and, consequently, for ETH price appreciation.
DeFi and NFT Ecosystems: Seeking a Spark
The Decentralized Finance (DeFi) and Non-Fungible Token (NFT) ecosystems, once the primary drivers of Ethereum's growth, are currently in a more subdued phase. The Total Value Locked (TVL) in DeFi protocols has seen some recovery, but it has not reached the euphoric highs seen in previous bull cycles. This indicates that while capital is flowing back into DeFi, it's doing so with a more cautious approach. New project launches and innovation are still occurring, but the speculative frenzy that characterized earlier periods seems to have cooled. This maturation of the DeFi space, while healthy in the long run, means that it may not provide the same immediate catalyst for price pumps as it once did. Similarly, the NFT market, while showing signs of life with some high-profile collections gaining traction, is far from its previous peak popularity. Gas fees, as mentioned, play a role here, making smaller transactions or mints less appealing. The recent mention of AI Agents potentially driving Ethereum's base to new heights is an interesting fundamental development to watch, as it could unlock new use cases and demand for the network, but this remains a forward-looking narrative rather than a current price driver.
The integration of Base with Ethereum and other Layer 2 solutions, as reported, signifies a move towards a more interconnected ecosystem. However, the fragmentation among Layer 2s remains a challenge, as highlighted by Ethereum builders proposing 'economic zones' to tackle this issue. While these developments are crucial for Ethereum's future scalability and adoption, they are currently contributing to a complex ecosystem that doesn't offer a clear, immediate bullish signal for ETHUSD. The lack of a dominant narrative or a killer application driving significant new demand means that ETHUSD is largely trading on technicals and broader market sentiment for now.
Macroeconomic Influences and Correlation Analysis
The Dollar's Grip: DXY and its Impact on ETHUSD
In the interconnected world of financial markets, the US Dollar Index (DXY) often acts as a significant barometer for risk appetite and influences asset classes far beyond traditional forex. Currently, the DXY is showing strength, trading around 99.68 and having risen 0.45% on the day. This strengthening dollar narrative is particularly relevant for cryptocurrencies like ETHUSD, which are often perceived as risk assets. A stronger dollar typically implies a higher cost for dollar-denominated assets for holders of other currencies, and it can also signal a 'risk-off' sentiment in global markets, where investors move towards perceived safe havens like the US dollar. On the 1-hour chart, the DXY shows a neutral trend with a slight upward bias, but the 4-hour and daily charts both indicate a clear bullish trend, with the daily ADX at a strong 30.39. This sustained dollar strength is a headwind for ETHUSD, as it makes holding ETH more expensive for a significant portion of the global investor base and can draw capital away from riskier assets.
The correlation between ETHUSD and the DXY, while not always perfect, is generally inverse. When the dollar strengthens, risk assets like ETHUSD tend to face downward pressure. This dynamic is currently at play, with the rising DXY potentially contributing to the selling pressure observed on ETHUSD, particularly on the 4-hour and daily charts. The fact that the DXY is showing a sustained upward trend, especially on the daily timeframe, suggests that this factor could continue to weigh on ETHUSD in the near to medium term. While some altcoins might surge independently due to specific news or developments, the broader market trend for ETHUSD is likely to remain influenced by the dollar's trajectory. Traders must keep a close eye on the DXY's movement; a continued climb above the 100 mark could spell further trouble for ETHUSD.
Equity Market Correlation: SP500 and Nasdaq's Double-Edged Sword
The relationship between cryptocurrencies, particularly Ethereum, and major equity indices like the S&P 500 and Nasdaq 100 is another crucial aspect of market correlation. Historically, these indices have shown a strong positive correlation with crypto assets, meaning that when equities rise, crypto tends to follow, and vice versa. This is often attributed to a shared 'risk-on' sentiment among investors. Currently, the S&P 500 is showing a mixed picture, with a strong 1H and 4H upward trend but a bearish daily trend, closing around 6572.87 with a 0.74% daily gain. The Nasdaq 100, on the other hand, is showing a slight daily decline, trading around 23956.5, down 0.36%. The daily chart for both indices presents a bearish outlook, with negative MACD momentum and RSI below 50, suggesting that the broader equity market sentiment might be turning cautious.
This divergence and the bearish signals on the daily equity charts add another layer of complexity to ETHUSD's outlook. While the hourly charts for both S&P 500 and Nasdaq might show some short-term strength, the daily charts indicate potential headwinds. A sustained downturn in the equity markets could easily spill over into the crypto space, exacerbating any selling pressure on ETHUSD. The recent news of Trump's hawkish rhetoric on Iran impacting risk sentiment and potentially weighing on the S&P 500 and Nasdaq 100 further reinforces this correlation. If risk appetite continues to wane, ETHUSD could face significant selling pressure, despite any short-term bullish signals on its hourly chart. The key levels to watch on the S&P 500 daily chart are support at 6377.47 and resistance at 6605.07. For the Nasdaq 100, support is at 23662.24 and resistance at 24254.6. A break below these key support levels in equities would likely signal a broader risk-off move, impacting ETHUSD negatively.
Energy Prices and Inflationary Fears: Brent and WTI's Role
The surge in oil prices, with Brent crude trading at $112.29 and WTI at $112.19, presents a significant macroeconomic factor that cannot be ignored. Brent has seen a remarkable 8.69% daily increase, and WTI a staggering 13.37% increase. This sharp rise in energy costs has profound implications for inflation expectations globally. Higher energy prices directly contribute to inflation, potentially forcing central banks to maintain a more hawkish stance on monetary policy, which typically means higher interest rates for longer. This, in turn, can dampen economic growth and increase the cost of capital, negatively impacting risk assets like ETHUSD. The strong upward trend in oil prices, particularly the very strong ADX readings on the daily charts (58.63 for Brent, 58.32 for WTI), suggests that this inflationary pressure is not a fleeting event but a more persistent trend.
For ETHUSD, this means that the inflationary environment fueled by rising energy costs could indirectly pressure the asset. If central banks maintain higher interest rates to combat inflation, the cost of borrowing increases, making speculative investments less attractive. Furthermore, a persistent inflationary environment might lead investors to seek assets that traditionally hedge against inflation, but ETHUSD's correlation with risk assets rather than traditional inflation hedges like gold complicates this narrative. While gold is currently showing a slight downtrend, its role as a safe haven is often amplified during periods of geopolitical tension, which is also contributing to the rise in oil prices. The interplay between rising energy prices, inflation, central bank policy, and risk asset performance creates a complex web of factors that ETHUSD must navigate. The current strength in oil prices suggests that inflationary concerns are likely to remain elevated, potentially keeping pressure on risk assets.
Regulatory Landscape and Future Catalysts
The Evolving Regulatory Environment: A Constant Factor
The cryptocurrency space continues to grapple with an evolving regulatory landscape, and Ethereum is no exception. While there haven't been major new regulatory pronouncements directly impacting ETHUSD in the last 48 hours, the ongoing scrutiny from bodies like the SEC in the United States remains a background factor. Recent news about BNP Paribas adding Bitcoin and Ether ETNs for retail clients in France, however, signals a growing acceptance and integration of digital assets into traditional financial products. This institutional embrace, even if cautious, is a net positive for the long-term adoption of ETHUSD. It suggests that as regulatory clarity improves, more traditional financial players will be willing to offer exposure to cryptocurrencies, potentially increasing liquidity and demand.
Conversely, any adverse regulatory actions, such as stricter classifications or crackdowns, could easily spook the market and trigger significant price drops. The market is highly sensitive to regulatory news, and the lack of definitive, globally harmonized regulations creates an undercurrent of uncertainty. The recent mention of Tether's first full audit potentially boosting USDT confidence also indirectly benefits the broader crypto market, including ETHUSD, by increasing trust in stablecoins which are crucial for trading pairs. However, the focus remains on how regulators will approach staking yields, DeFi protocols, and the classification of cryptocurrencies themselves. This regulatory uncertainty is a key factor that prevents ETHUSD from breaking out decisively into a strong bullish trend, even when technicals might suggest otherwise.
Potential Future Catalysts: What Could Move the Needle?
Looking ahead, several factors could act as catalysts for ETHUSD. The ongoing development and adoption of Ethereum Layer 2 solutions remain a critical area to watch. As highlighted in recent discussions, achieving stable and low transaction fees is paramount for mass adoption. If these L2s prove successful in scaling the network efficiently and affordably, it could unlock significant new use cases and user bases, driving demand for ETH. The news about AI Agents potentially driving Ethereum's base to new heights is another exciting, albeit speculative, catalyst. The development of decentralized AI networks could create new utility for Ethereum's blockchain, potentially leading to increased network activity and demand for ETH. This is a longer-term play, but one that could significantly reshape the Ethereum ecosystem.
Furthermore, the potential approval of Ethereum-based ETFs, similar to the recent developments in Bitcoin ETFs, could unlock significant institutional capital. While the current regulatory climate makes this uncertain, any positive movement in this direction would be a major bullish catalyst. The market is also keenly awaiting any further developments regarding the upcoming economic data releases, particularly those related to inflation and employment in the US. Stronger-than-expected data could lead to expectations of prolonged higher interest rates, which would be a headwind for ETHUSD. Conversely, weaker data might signal a potential pivot from central banks, which could boost risk assets. Finally, the much-anticipated halving events in Bitcoin, while not directly impacting ETHUSD, often create a broader bullish sentiment across the crypto market, which can spill over into Ethereum. The interplay of these technological advancements, regulatory shifts, and macroeconomic data will shape ETHUSD's trajectory in the coming weeks and months.
Trade Scenarios and Actionable Insights
Bearish Scenario: Testing the Lower Bounds
If the bearish signals from the 4-hour and daily charts gain dominance, ETHUSD could see a significant pullback. The trigger for this scenario would be a decisive close below the immediate 4-hour support at $2,042.71, especially if accompanied by increasing volume and bearish confirmation across multiple timeframes. Invalidation of this bearish thesis would occur if price manages to break decisively above the 4-hour resistance at $2,059.03 and hold there, signaling a shift in momentum. The first target in a bearish scenario would be the psychological level of $2,000, a significant support area identified on the daily chart. If selling pressure intensifies and the broader market sentiment turns risk-off, a further move towards the next daily support at $1,932.20 would be plausible. This scenario is currently given a higher probability due to the prevailing bearish MACD momentum on the longer timeframes and the broader macroeconomic headwinds from a strengthening DXY and rising oil prices.
Bearish Scenario: Downside Pressure Mounts
65% ProbabilityBullish Scenario: A Bounce from Current Levels?
Alternatively, if the short-term bullish signals on the 1-hour chart manage to gain traction and overcome the bearish sentiment from longer timeframes, ETHUSD could see a recovery. The trigger for this bullish scenario would be a strong break and sustained hold above the immediate hourly resistance at $2,055.91, confirmed by increasing buying volume and positive divergence across indicators. Invalidation of this bullish thesis would occur if price fails to hold above $2,042.71 support, indicating that the short-term bounce was merely a temporary correction within a larger downtrend. The first target in a bullish scenario would be the 4-hour resistance level at $2,059.03. A successful breach of this level could then open the path towards the next significant resistance at $2,065.50, and potentially higher towards $2,075.35 if broader market sentiment shifts to risk-on. This scenario currently carries a lower probability due to the prevailing bearish indicators on the 4-hour and daily charts, but it remains a possibility if key short-term levels are defended and momentum shifts.
Bullish Scenario: Short-Term Rebound Potential
25% ProbabilityNeutral Scenario: Range-Bound Continuation
Given the conflicting signals across timeframes and the weak ADX readings, a period of continued consolidation is a highly plausible scenario. The trigger for this neutral scenario would be ETHUSD failing to decisively break either the immediate support at $2,042.71 or the resistance at $2,059.03, leading to price action remaining within this defined range. Invalidation would occur with a clear break and sustained move outside of this range, triggering either the bullish or bearish scenario. The primary target in a neutral scenario would be for price to continue oscillating within the $2,042.71 - $2,059.03 range, with minor bounces off support and rejections at resistance. This scenario reflects the current market indecision and the lack of strong conviction from either buyers or sellers. Traders might look for range-bound strategies, buying near support and selling near resistance, provided risk management is strictly adhered to. This scenario is given a moderate probability as the market awaits clearer direction.
Neutral Scenario: Range-Bound Consolidation
10% ProbabilityWhat to Watch Next Week
The coming week for ETHUSD will be defined by its ability to either break out of its current consolidation or continue its sideways movement. The critical support level at $2,042.71 and the resistance at $2,059.03 will remain the primary focus for short-term traders. A sustained break below $2,042.71 could initiate a move towards $1,999.05, especially if broader market sentiment remains risk-off, driven by persistent inflation fears and a strong US dollar. Conversely, a decisive push above $2,059.03, coupled with positive developments in Ethereum's ecosystem or a shift in macro sentiment, could pave the way for a rally towards $2,065.50 and beyond. The neutral daily trend and weak ADX readings suggest that volatility might remain subdued unless a significant catalyst emerges. Key macroeconomic data releases, particularly US inflation figures and employment reports, will be crucial in shaping expectations for central bank policy, which in turn will influence risk asset appetite. On-chain metrics will also be important to monitor; any significant shifts in whale activity or exchange flows could provide early clues about future price direction. Ultimately, ETHUSD is at a crossroads, and the decisions made by both technical traders and fundamental investors in the coming days will determine its path forward.
Frequently Asked Questions: ETHUSD Analysis
What happens if ETHUSD breaks below the $2,042.71 support level this week?
A break below $2,042.71 on the 4-hour chart would likely confirm the bearish sentiment indicated by the daily MACD and RSI. This could trigger a move towards the $1,999.05 support level, and potentially lower if the broader market turns risk-off.
Should I consider buying ETHUSD at current levels around $2,051.68 given the mixed signals?
Buying at current levels carries significant risk due to the conflicting signals. A more prudent approach would be to wait for confirmation: either a strong bounce above $2,055.91 with bullish divergence or a clear breakdown below $2,042.71 to consider shorting.
Is the RSI at 47.27 on the daily chart a sell signal for ETHUSD?
An RSI of 47.27 on the daily chart is not a definitive sell signal but leans bearish as it is below the 50 mark and shows a downward trend. It suggests that selling pressure is present, but not yet overwhelming, indicating potential for further downside if key support levels fail.
How will upcoming US inflation data affect ETHUSD's price around $2,051.68?
Higher-than-expected inflation data could lead to expectations of prolonged higher interest rates, pressuring ETHUSD downwards. Conversely, weaker data might signal a Fed pivot, potentially boosting risk assets like ETHUSD. Traders should watch for moves around the $2,042.71 support and $2,059.03 resistance based on the data outcome.
Track markets in real-time
AI-powered analysis, technical indicators and real-time price data.
Join Our Telegram Channel
Breaking market news, AI analysis and trading signals instantly.
Join Channel