Ethereum lucha por encontrar una dirección clara, rondando los $2,123.06. Los últimos datos del PMI añaden complejidad al panorama, dejando a los traders inciertos sobre el próximo movimiento. Un análisis técnico de ethereum hoy es crucial para entender la volatilidad.
- El RSI en 57.05 indica un impulso neutral, lo que sugiere que no hay condiciones de sobrecompra ni de sobreventa.
- Nivel de soporte clave en $2,099.28, cuya ruptura podría desencadenar nuevas caídas.
- El histograma MACD muestra un impulso negativo, lo que indica presión bajista a corto plazo.
- El sentimiento general del mercado y los movimientos del DXY probablemente influirán en la trayectoria de ETHUSD.
ETHUSD está actualmente navegando por un panorama agitado. La acción del precio alrededor de $2,123.06 es fundamental, reflejando el tira y afloja entre las fuerzas alcistas y bajistas. Habiendo rastreado ETHUSD a través de varios ciclos de mercado, puedo decir con confianza que el entorno actual exige un enfoque equilibrado, prestando mucha atención tanto a los indicadores técnicos como a los impulsores fundamentales. El pronóstico del precio de Ethereum para 2026 sigue siendo muy dependiente de los próximos eventos del mercado.
Indicadores Técnicos: Un Panorama Mixto
Los indicadores técnicos pintan un panorama complejo. En el marco temporal de 1 hora, el RSI se sitúa en 57.05, lo que sugiere un impulso neutral. Esto indica que ni los alcistas ni los bajistas tienen un control decisivo sobre el mercado. El histograma MACD, sin embargo, revela un impulso negativo, lo que sugiere una posible presión bajista a corto plazo. Es importante recordar que el RSI por sí solo no cuenta toda la historia; necesitamos considerarlo junto con otros indicadores y la acción del precio. El indicador estocástico muestra un valor K de 43.2 y un valor D de 30.82, lo que señala un posible cruce alcista, que podría proporcionar cierto impulso al alza. Sin embargo, el ADX en 28.27 sugiere una tendencia moderadamente fuerte, pero es importante ver si la tendencia persiste.
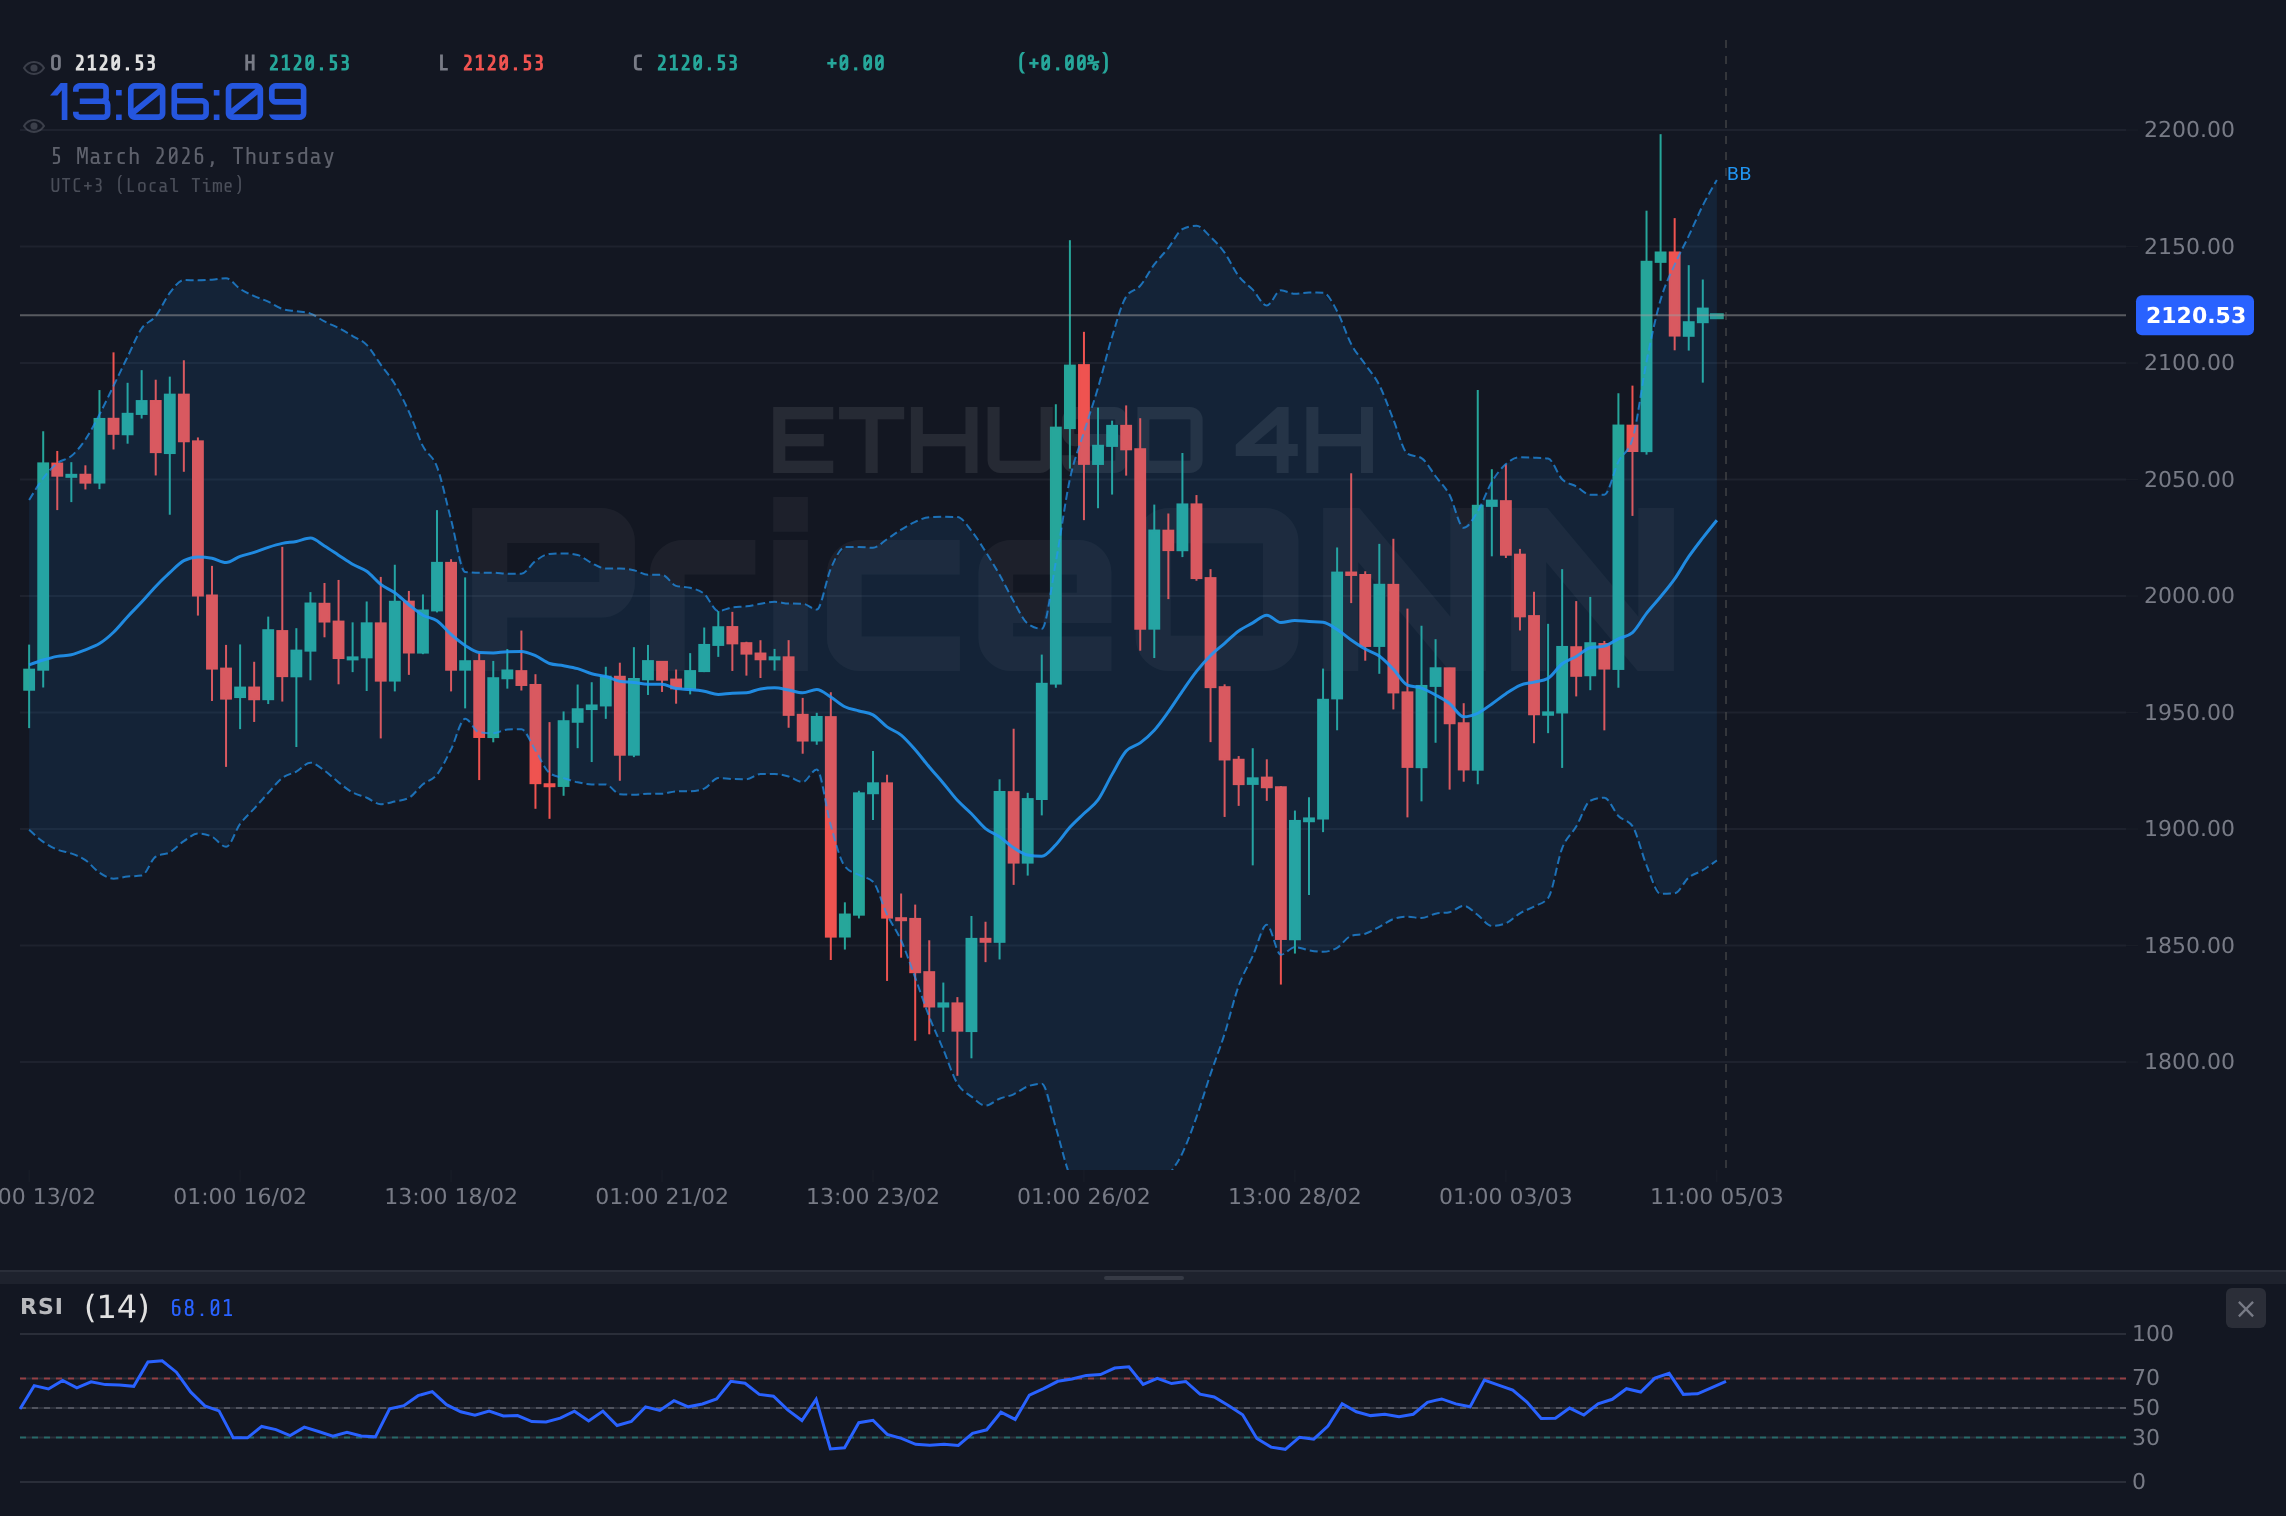
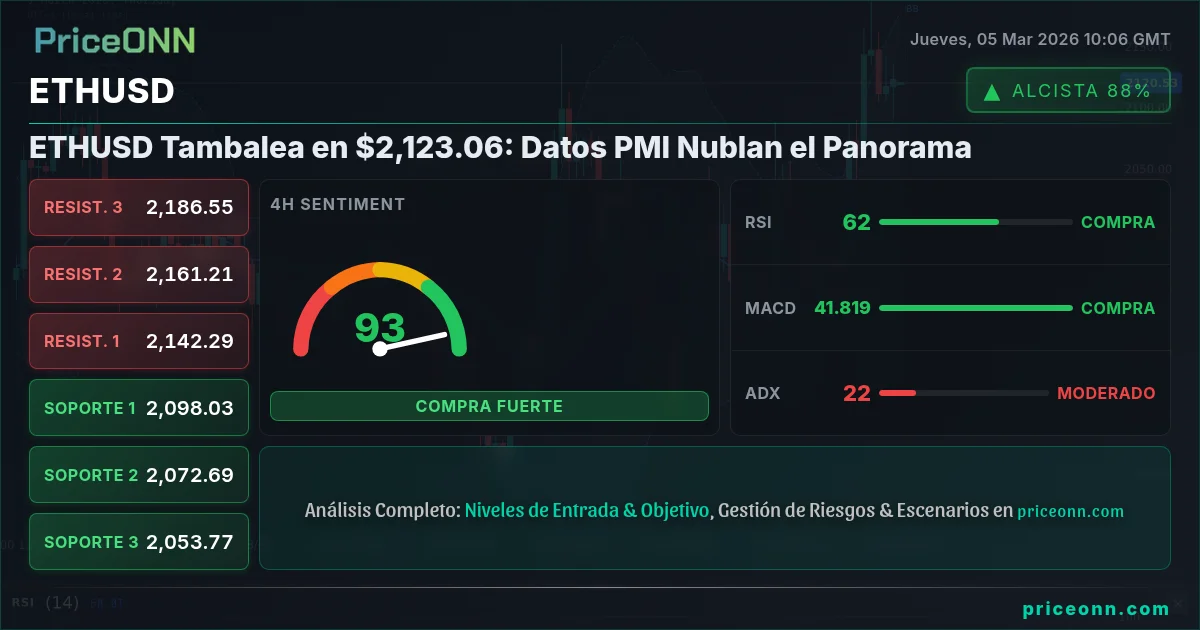
En cuanto al marco temporal de 4 horas, el RSI está en 62.85, todavía dentro de la zona neutral, pero ligeramente inclinado hacia condiciones de sobrecompra. El MACD, por otro lado, muestra un impulso positivo, contradiciendo el gráfico horario. El indicador estocástico muestra un valor K de 69.1 y un valor D de 77.38, lo que indica una posible condición de sobrecompra. El ADX en 21.16, lo que indica una tendencia moderada.
En el marco temporal diario, el RSI está en 51.49, todavía dentro de la zona neutral. El MACD muestra un impulso positivo, confirmando el sentimiento alcista en el marco temporal superior. El indicador estocástico muestra un valor K de 71.57 y un valor D de 54.74, lo que sugiere que el activo no está sobrecomprado. El ADX en 35.87 muestra una fuerte tendencia alcista.
Niveles de Precios Clave: Soporte y Resistencia
Los niveles de soporte clave a tener en cuenta son $2,099.28, $2,083.03 y $2,074.46 en el marco temporal horario. Estos niveles han actuado como pisos confiables en el pasado, y una ruptura por debajo de ellos podría señalar una corrección más significativa. En el lado positivo, la resistencia inmediata se encuentra en $2,124.1, $2,132.67 y $2,148.92. Superar estos niveles podría allanar el camino para nuevas ganancias. También me gustaría señalar que la acción del precio alrededor de estos niveles será crucial para determinar la trayectoria a corto plazo de ETHUSD.
Habiendo rastreado ETHUSD a través del ciclo de tasas de 2024, sé que estos niveles no son solo números arbitrarios; representan barreras psicológicas donde es probable que compradores y vendedores defiendan sus posiciones. Vigile de cerca cómo reacciona el precio en estos niveles: una ruptura o rechazo decisivo puede proporcionar pistas valiosas sobre el próximo movimiento del mercado.
Plan de Trading
Dados las señales mixtas y la proximidad a los niveles clave, aquí hay un plan de trading potencial:
Si ETHUSD supera los $2,124.1 y se mantiene, una posición Long podría apuntar a $2,132.67 y $2,148.92. Este escenario depende del sentimiento positivo del mercado y de un debilitamiento del dólar.
Si ETHUSD no logra mantenerse por encima de $2,099.28, una posición Short podría apuntar a $2,083.03 y $2,074.46. Este escenario es más probable si el dólar se fortalece o aumenta la aversión al riesgo.
Evaluación de Probabilidad: Estimo una probabilidad del 60% para el escenario bajista y una probabilidad del 40% para el escenario alcista, dado el actual impulso negativo en el marco temporal horario y la incertidumbre más amplia del mercado.
Recuerde que el trading implica riesgo. Utilice siempre órdenes de stop-loss y gestione el tamaño de su posición de forma adecuada.
Eventos Económicos: Qué Observar
Varios eventos económicos podrían impactar a ETHUSD en los próximos días. Las próximas publicaciones de datos, incluido el PMI, proporcionarán más información sobre la salud de la economía global e influirán en el sentimiento del mercado. Supervisaremos cualquier anuncio y ajustaremos nuestra estrategia en consecuencia.
El 2 de marzo, los datos del PMI de EE. UU. fueron inferiores a las previsiones, lo que normalmente debilitaría el dólar y respaldaría a ETHUSD. Sin embargo, otros factores parecen estar eclipsando esto. Los traders también deben estar atentos a cualquier anuncio de la Reserva Federal, ya que estos pueden impactar significativamente al dólar y, en consecuencia, a ETHUSD. Según Reuters, los funcionarios de la Fed están monitoreando de cerca los datos de inflación antes de tomar cualquier decisión sobre futuras subidas de tipos.
Según Bloomberg, las tensiones en Oriente Medio siguen siendo altas, lo que podría empujar a los inversores a activos de refugio seguro como el oro y el dólar estadounidense. Esto también podría impactar a ETHUSD, ya que un dólar más fuerte probablemente empujaría a ETHUSD a la baja.
Análisis de Correlación
Los movimientos de ETHUSD a menudo están correlacionados con el DXY (Índice del Dólar). Con el DXY en 98.6, es probable que ETHUSD experimente presión a la baja. Un fortalecimiento del dólar normalmente pesa sobre los activos de riesgo como Ethereum, ya que se vuelve más caro para los inversores internacionales comprar. Además, esté atento al SP500. El SP500 se encuentra actualmente en 6863.6. El SP500 ha bajado un 0.1%. El apetito por el riesgo está disminuyendo y la demanda de refugio seguro puede aumentar.
Es importante tener en cuenta que estas correlaciones no siempre son perfectas y que otros factores pueden influir en la acción del precio de ETHUSD. Sin embargo, estar atento a estos indicadores puede proporcionar un contexto valioso para sus decisiones de trading.
Preguntas Frecuentes: Análisis de ETHUSD
¿Es ETHUSD una buena compra ahora mismo?
ETHUSD cotiza alrededor de $2,123.06. Dados el impulso neutral y las señales mixtas, no es una compra clara en este momento. Una ruptura por encima de $2,124.1 podría señalar una oportunidad de compra, pero se justifica la precaución.
¿Cuál es el pronóstico del precio de ETHUSD para esta semana?
El pronóstico del precio de ETHUSD para esta semana depende en gran medida de los próximos datos del PMI. Si los datos son positivos, podríamos ver a ETHUSD probar $2,132.67. Si los datos son negativos, es probable una caída a $2,099.28.
¿Cuáles son los niveles clave de soporte y resistencia para ETHUSD?
Los niveles de soporte clave para ETHUSD son $2,099.28, $2,083.03 y $2,074.46. Los niveles de resistencia son $2,124.1, $2,132.67 y $2,148.92. Estos niveles son cruciales para identificar posibles puntos de entrada y salida.
¿Por qué se está moviendo ETHUSD hoy?
ETHUSD se está moviendo hoy debido a una combinación de factores, incluidos los últimos datos del PMI, el sentimiento general del mercado y los movimientos del DXY. Las señales mixtas de estos factores están contribuyendo a la incertidumbre actual.
Resumen de Perspectivas Técnicas
| Indicador | Valor | Señal |
|---|---|---|
| RSI (14) | 57.05 | Neutral |
| MACD Histogram | Negative | Bajista |
| Stochastic | 43.2/30.82 | Alcista |
| ADX | 28.27 | Tendencia Moderada |
| Bollinger | Middle Band | Neutral |