
EURUSD Tests $1.1542: Iran Tensions Fuel Bearish Bias Amid Rising Oil
EURUSD consolidates near $1.1530 as escalating Iran tensions and anticipation for Fed minutes keep traders on edge. With Brent crude oil above $113, inflation fears persist.
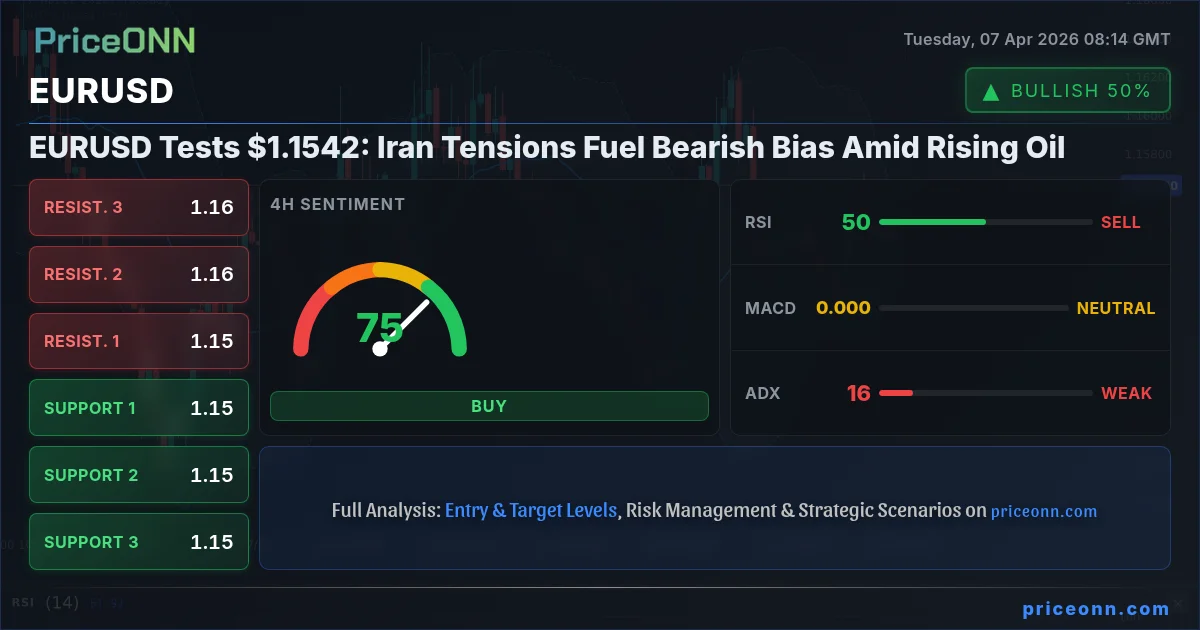
The EURUSD currency pair is navigating a complex geopolitical landscape, currently finding itself under pressure as tensions escalate in the Middle East. Trading near the $1.1530 level, the pair reflects a cautious market sentiment driven by rising oil prices and anticipation of crucial economic data. This delicate balance means that any significant geopolitical development or central bank commentary could trigger substantial price action.
- EURUSD is consolidating around $1.1530, influenced by geopolitical tensions and upcoming Fed minutes.
- Critical support for EURUSD lies at $1.1523, with resistance at $1.1562.
- The RSI at 53.74 on the 1H chart suggests a neutral stance with a slight upward bias, while the 1D RSI at 47.01 indicates a bearish trend.
- Rising Brent crude oil prices above $113.50 contribute to inflation concerns, potentially influencing central bank policy and adding to EURUSD's volatility.
Navigating Geopolitical Storms: The Impact on EURUSD
The global financial markets are currently on edge, with the escalating tensions involving Iran acting as a significant overhang. This geopolitical uncertainty is directly impacting commodity prices, particularly oil, and is fostering a risk-averse sentiment that often benefits the US Dollar. For EURUSD, this means that while the Euro might find some footing on specific economic data, the overarching geopolitical narrative is likely to remain a dominant bearish factor. The price action around the $1.1542 mark is crucial; a sustained break below this level could signal further downside, especially if the US Dollar Index (DXY), currently at 99.66, continues its ascent. The interplay between risk sentiment, oil prices, and dollar strength creates a challenging environment for the Euro.
The Dollar's Strength: A Tale of Two Timelines
The US Dollar Index (DXY) is exhibiting a mixed picture across different timeframes, yet its overall upward trend on the daily chart, currently at 99.66, provides a supportive backdrop for dollar-denominated assets and a headwind for EURUSD. On the 1-hour chart, the DXY shows a neutral signal with mixed indicators, but the 4-hour chart leans bullish, suggesting underlying dollar strength. This divergence highlights the current indecision in short-term trading but reinforces the longer-term bullish bias. When the DXY strengthens, it typically exerts downward pressure on major currency pairs like EURUSD, as the dollar becomes a more attractive safe-haven or yield play. The current DXY strength, even if modest at 99.66, implies that any positive economic news from the US or further geopolitical escalation could quickly translate into further dollar gains, pushing EURUSD lower.
Oil Prices and Inflationary Echoes
The surge in Brent crude oil prices, now trading above $113.55, is a significant factor contributing to market volatility and inflationary concerns. This rise, partly fueled by geopolitical risks stemming from the Middle East, directly impacts the economic outlook for major economies, including the Eurozone. Higher energy costs can dampen consumer spending and increase production costs, potentially slowing economic growth. For the European Central Bank (ECB), this presents a dilemma: rising inflation calls for tighter monetary policy, but slowing growth might necessitate a more accommodative stance. The current RSI(14) for Brent is at 65.97 on the daily chart, indicating a strong upward trend that could keep inflation worries alive. This inflationary pressure, coupled with the ongoing geopolitical instability, adds another layer of complexity to the EURUSD outlook, potentially widening interest rate differentials if the Fed is forced to remain hawkish while the ECB hesitates.
EURUSD: A Technical Tightrope Walk
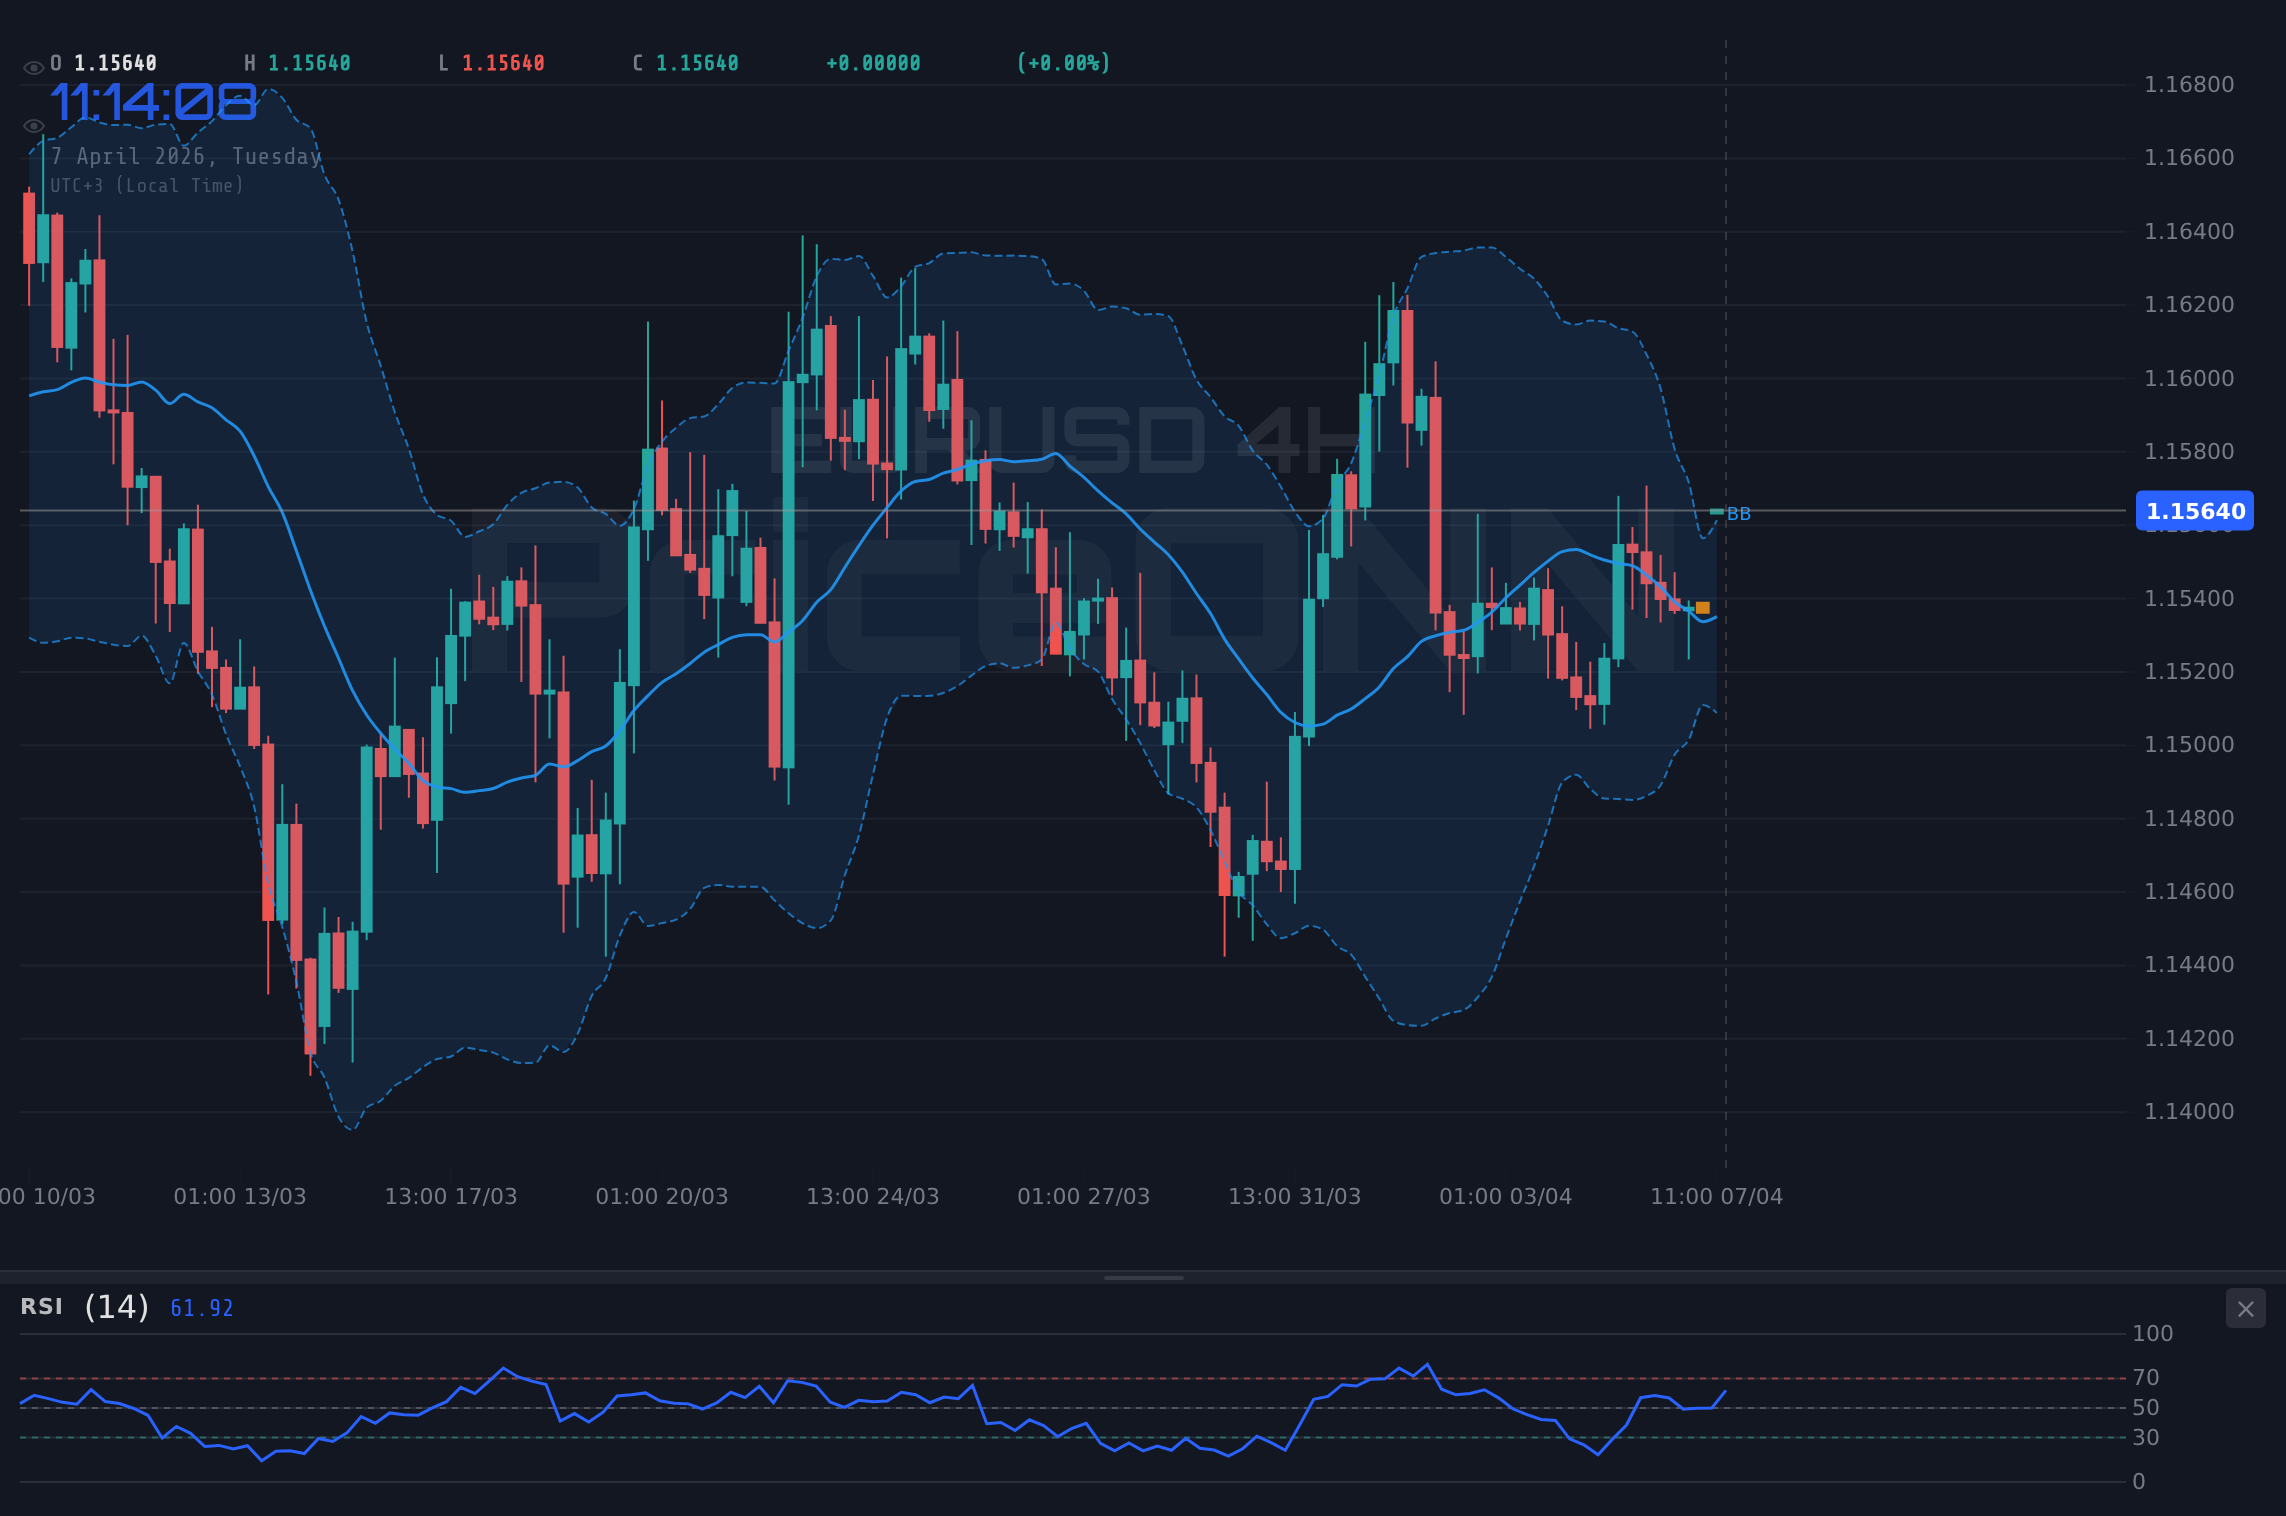
From a technical standpoint, EURUSD is currently perched precariously. On the 1-hour chart, the pair shows a neutral trend with a general buy signal, a reflection of the conflicting signals from its indicators. The RSI(14) at 53.74 is in neutral territory, leaning slightly upwards, while the MACD indicates negative momentum. The Stochastic oscillator, however, provides a bullish signal with %K at 73.01 and %D at 44.79. This mixed picture suggests a lack of clear direction in the very short term. However, the 4-hour chart paints a slightly more cautious view, with a neutral trend and a neutral signal across its indicators, despite the RSI at 49.84 showing a slight downward tendency. The daily chart, arguably the most important for assessing the broader trend, presents a bearish picture. The trend is firmly downwards with 89% strength, the RSI(14) at 47.01 is falling, and the ADX at 28.2 indicates a strong downtrend. This daily bearish bias suggests that any short-term rallies might be opportunities for sellers to enter the market, particularly if key resistance levels hold.
Key Levels and What They Mean
The immediate price action for EURUSD revolves around the $1.1542 level, which has been highlighted as a point of contention. On the 1-hour chart, resistance is seen at $1.1548, $1.1553, and $1.1561, while support is found at $1.1535, $1.1527, and $1.1522. The fact that the current price is hovering just below the first hourly resistance level ($1.1548) is significant. A decisive break above this could lead to a test of the higher resistance points, but the bearish signals on the daily timeframe suggest such a move might be short-lived. Conversely, failure to hold above the hourly support levels, particularly $1.1523, could accelerate a move towards the more substantial daily support levels, which are much further down, starting at $1.1506. The ADX on the daily chart at 31.78 confirms the strength of this prevailing downtrend, making a sustained move higher a more challenging prospect without significant fundamental catalysts.
The Fed Factor and Market Expectations
While geopolitical events and oil prices are currently dominating headlines, the underlying monetary policy stance of the US Federal Reserve remains a critical driver for EURUSD. Market participants are keenly awaiting the upcoming Fed minutes for any hints about future interest rate decisions. The current market pricing, as reflected in Fed Fund Futures, suggests a cautious approach from the Fed, but any indication of a more hawkish stance - driven perhaps by persistent inflation - could significantly strengthen the dollar. Conversely, signs of a more dovish outlook, or concerns about the impact of geopolitical risks on the US economy, could weaken the dollar and provide a reprieve for EURUSD. The interplay between inflation data, employment figures, and Fed commentary will be crucial in shaping the medium-term trajectory of the pair. The divergence in economic performance between the US and the Eurozone, particularly regarding inflation and growth, is likely to keep the interest rate differential a key theme.
Cross-Asset Correlations: What the Charts Are Saying
Examining the broader market context reveals important correlations that can inform our view on EURUSD. The Dollar Index (DXY) at 99.66 is currently in a daily uptrend, which typically correlates inversely with EURUSD. As the DXY shows signs of strength, EURUSD faces headwinds. Similarly, the S&P 500, trading at 6572.87, is showing a strong daily uptrend despite some mixed signals on shorter timeframes. A robust equity market generally reflects risk appetite, which can sometimes weigh on safe-haven currencies but also support riskier currencies. However, the current geopolitical climate could override this, potentially leading to a 'risk-off' scenario where both equities and EURUSD fall, while the dollar and gold strengthen. Gold prices, currently at $4659.15, are showing a neutral daily trend but a bullish 1-hour signal, suggesting some safe-haven demand is already present. This complex web of correlations means traders must monitor multiple markets simultaneously to gauge the overall risk sentiment and its impact on EURUSD.
Scenario Analysis: Charting the Potential Paths
Bearish Scenario: Testing the Depths
65% ProbabilityConsolidation Scenario: Waiting for Clarity
25% ProbabilityBullish Scenario: A Fleeting Rally?
10% ProbabilityThe Path Forward: What to Watch
The immediate future for EURUSD appears to be one of heightened caution and sensitivity to geopolitical events. The bearish undertones from the daily technicals, coupled with rising oil prices and a generally strong dollar, suggest that the path of least resistance is downwards. Traders will be closely watching the $1.1523 support level. A break below this could trigger further selling pressure, potentially accelerating towards $1.1506 and $1.1472. Conversely, any rally towards $1.1562 would be met with skepticism, and a sustained break above this resistance would require a significant shift in market sentiment or a dovish surprise from the Fed. The upcoming Fed minutes will be critical; a hawkish tone could solidify the dollar's strength and reinforce the bearish outlook for EURUSD. Until then, expect continued volatility and a focus on risk management as geopolitical headlines dictate the immediate price action.
Frequently Asked Questions: EURUSD Analysis
What happens if EURUSD breaks below the $1.1523 support level?
A sustained break below $1.1523 would invalidate the short-term consolidation and likely signal a continuation of the daily bearish trend. This could lead to a rapid decline towards the next significant daily support levels at $1.1506 and potentially $1.1472, especially if geopolitical tensions continue to escalate or the US Dollar strengthens further.
Should I consider a trade at current levels of $1.1530 given the mixed signals?
Given the conflicting signals between short-term bullish indicators and the dominant daily bearish trend, entering a trade at current levels carries significant risk. Patience is advised; waiting for a clearer signal, such as a confirmed break of a key level or clearer directional bias from upcoming economic data like the Fed minutes, would offer a better risk-reward ratio.
Is the RSI at 47.01 on the daily chart a strong sell signal for EURUSD?
An RSI reading of 47.01 on the daily chart is not yet in oversold territory but indicates a prevailing bearish momentum. While it suggests sellers have the upper hand, it's not an immediate sell signal on its own. It aligns with the overall bearish trend but requires confirmation from price action and other indicators, especially on shorter timeframes where signals can be more volatile.
How will the upcoming Fed minutes affect EURUSD this week, especially with oil prices above $113?
If the Fed minutes reveal a hawkish tone, emphasizing concerns about inflation driven partly by high oil prices, it could strengthen the US Dollar and push EURUSD lower. Conversely, if the minutes suggest a more cautious approach due to geopolitical risks or slowing growth, it might offer some relief to EURUSD. The market will be looking for any indication of how persistent inflation is viewed and its implications for future rate policy.
Technical Outlook Summary
| Indicator | Value | Signal | Interpretation |
|---|---|---|---|
| RSI (14) | 47.01 | Bearish | Falling momentum on daily chart |
| MACD Histogram | -0.002 | Bearish | Negative momentum, below signal line |
| Stochastic | 49.65 / 48.08 | Bullish Crossover | Bullish signal, %K > %D |
| ADX | 28.2 | Strong Trend | Confirms strong downtrend |
| Bollinger | Middle Band | Above | Price above middle band, upward bias on 1D |
Key Levels
Support Levels
Resistance Levels
Track markets in real-time
AI-powered analysis, technical indicators and real-time price data.
Join Our Telegram Channel
Breaking market news, AI analysis and trading signals instantly.
Join Channel