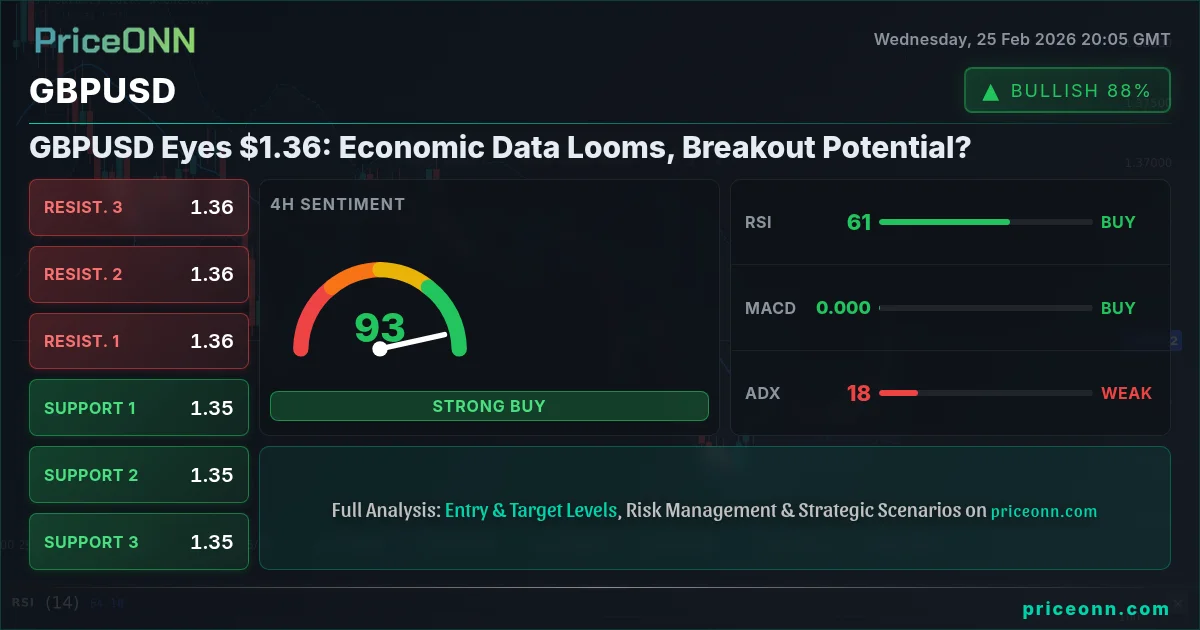
GBPUSD is locked in a tug-of-war near $1.36, with bulls and bears battling for dominance. The market's next move hinges on upcoming economic data, creating a volatile environment ripe with potential.
- GBPUSD currently trades around $1.36, with daily range between 1.34866 and 1.35647.
- Immediate resistance lies at 1.35572, with support at 1.3547 on the 1H chart.
- Stochastic on the 1H chart signals overbought conditions, with K=82.58 and D=79.82.
- Market sentiment remains neutral until key economic data releases provide a clearer direction.
The Bullish Case for GBPUSD: Data-Driven Optimism
Bulls are betting on a positive interpretation of upcoming economic data, particularly any signs of strength in the UK economy relative to the US. The recent daily change of 0.51% reflects some upward momentum. The 1H trend shows a strong bullish presence with a strength of 86%, suggesting short-term upside potential. The RSI(14) at 63.52 on the 1H chart indicates room for further gains before reaching overbought territory. The positive MACD momentum across multiple timeframes further supports the bullish outlook. If the upcoming USD data disappoints, that could give GBPUSD the extra push it needs to break higher.
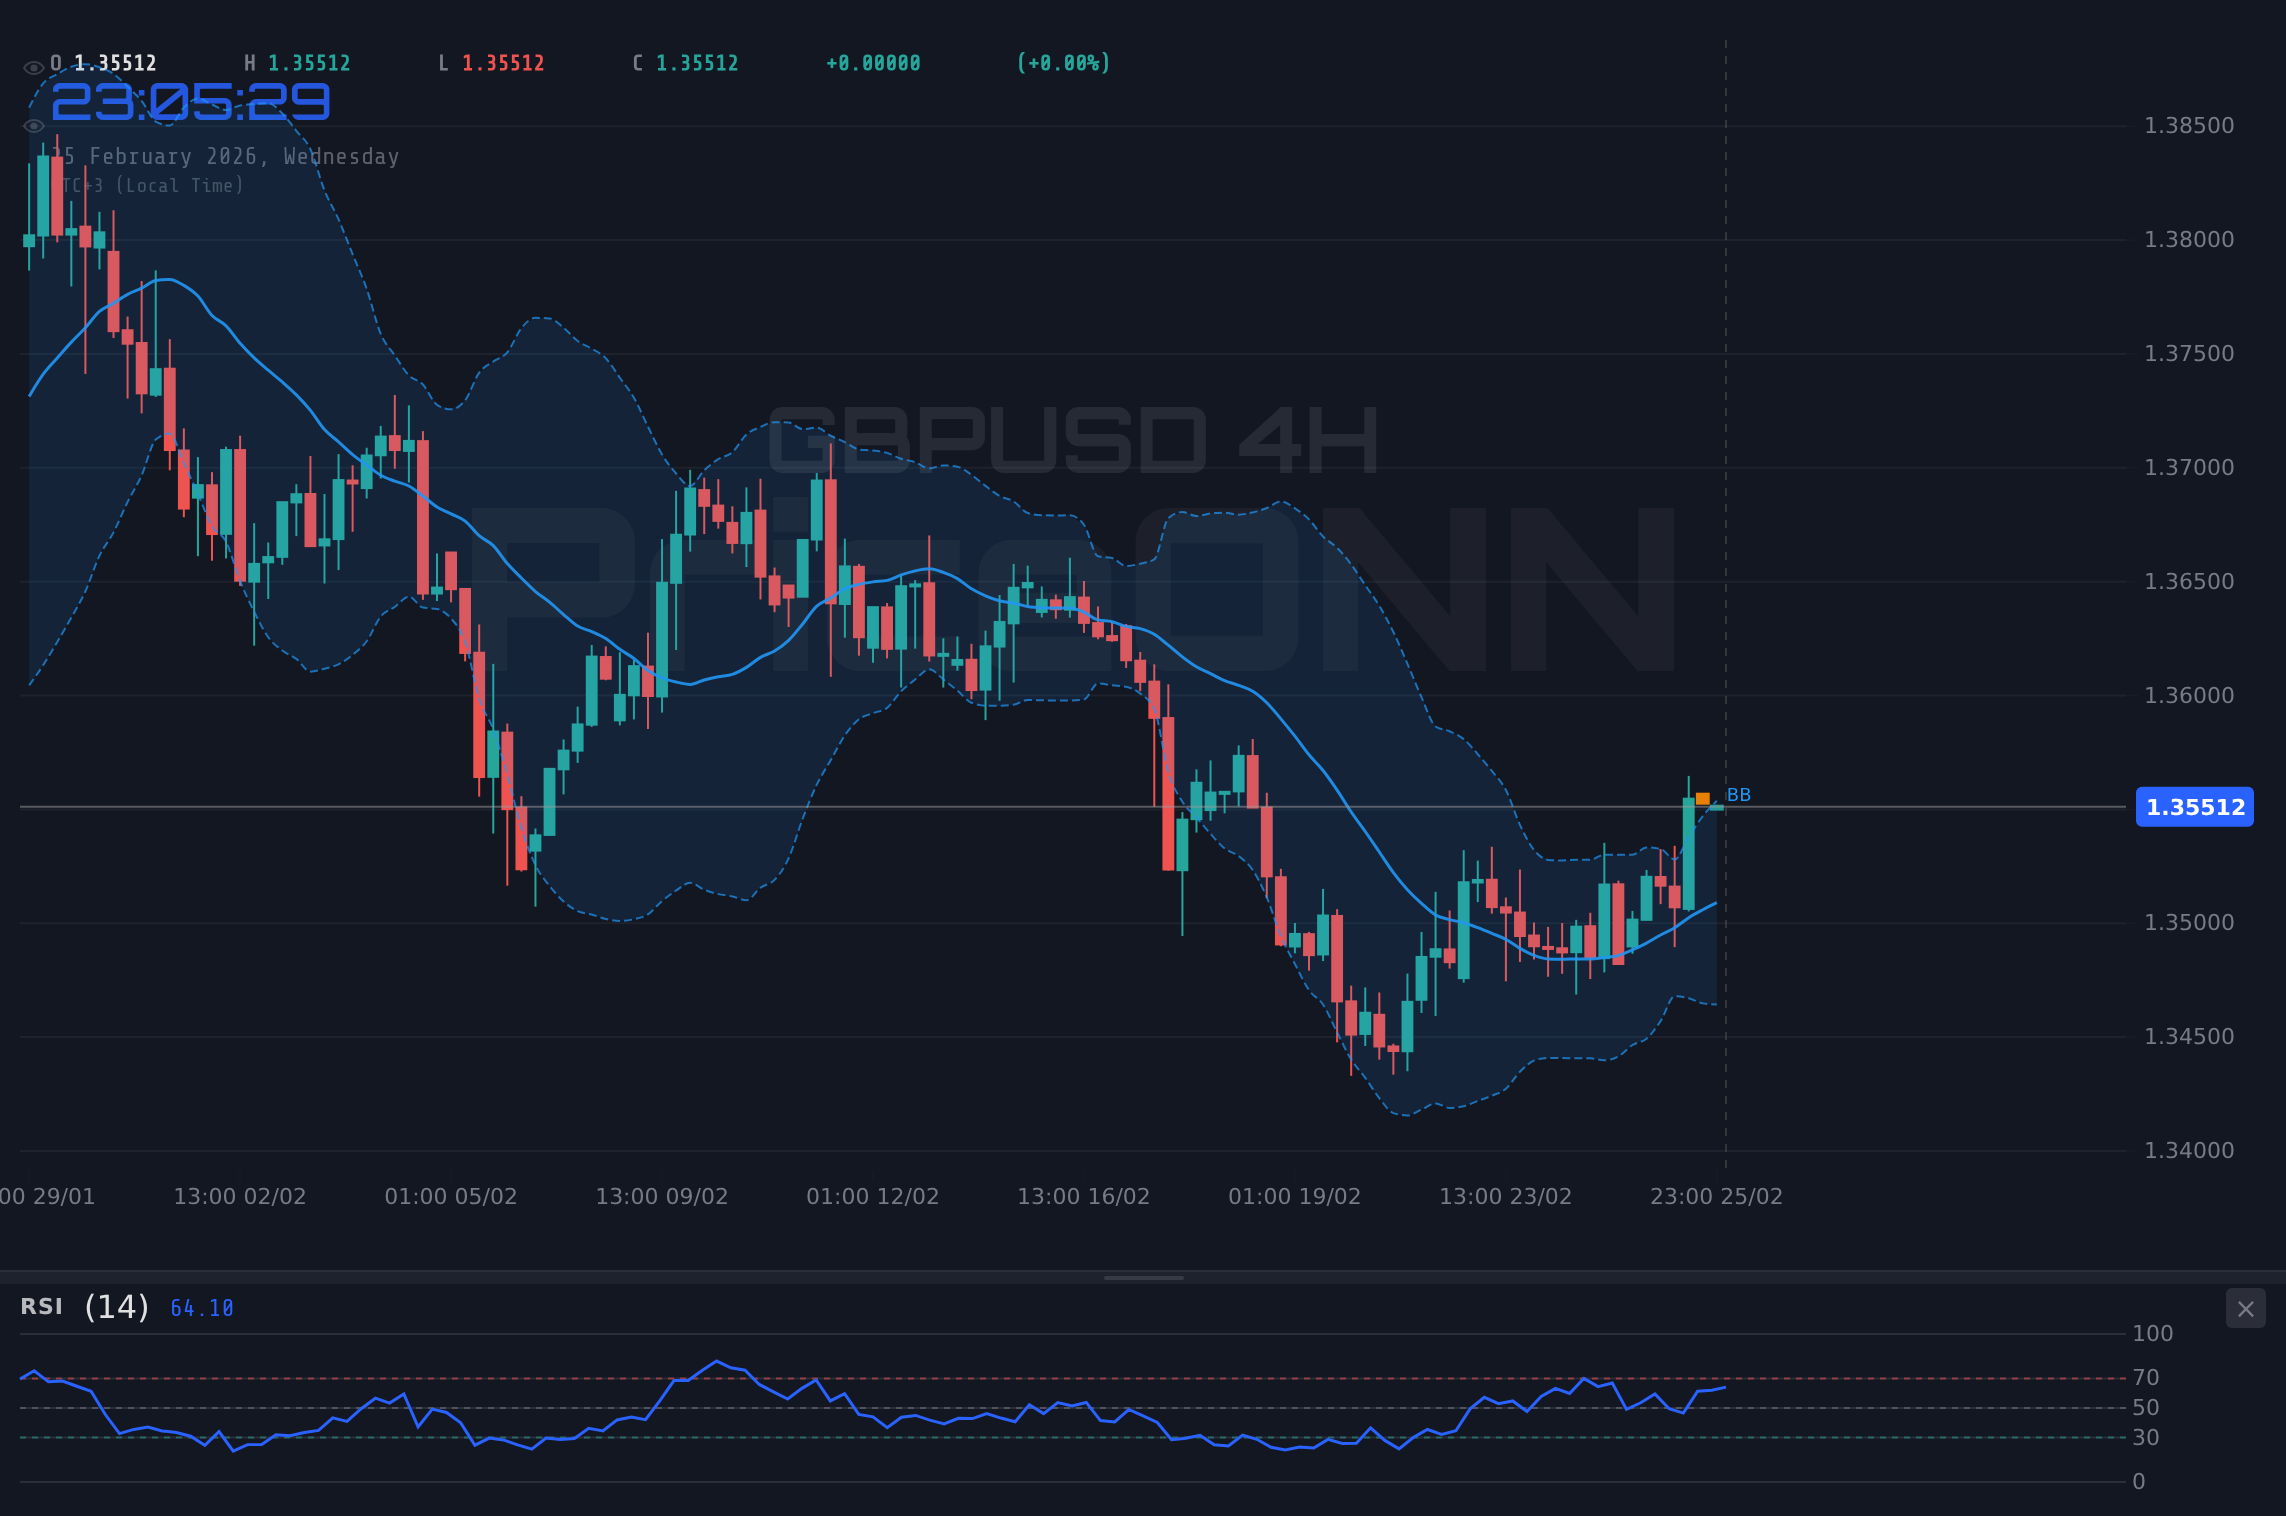
On the hourly chart, GBPUSD shows a clear uptrend, finding support at 1.3547, 1.35428, and 1.35368. The immediate resistance level to watch is 1.35572. A successful break above this level could trigger further buying, targeting 1.35632 and potentially 1.35674. The Stochastic oscillator, with K=82.58 and D=79.82, indicates that the pair is approaching overbought conditions, suggesting a possible pullback. However, the overall trend remains bullish until proven otherwise.
The Bearish Case for GBPUSD: Data-Dependent Concerns
Bears are focusing on potential downside risks, particularly any signs of weakness in the UK economy or strength in the US dollar. The DXY (Dollar Index) is currently at 97.38, with a daily change of -0.21%. A strengthening dollar could put significant pressure on GBPUSD. The 1D chart provides a more cautious outlook, with the RSI(14) at 49.65 indicating a slight downward bias. The MACD on the daily timeframe shows negative momentum, signaling potential bearish continuation. The first key support level to watch is 1.3547 on the 1H chart, as well as 1.34863 on the 4H chart.
From a technical standpoint, the bearish scenario hinges on GBPUSD failing to sustain its current momentum. The 4H chart indicates a neutral trend. The ADX on the 4H timeframe is at 17.19, indicating a weak trend. The stochastic oscillator on the 1D chart, with K=30.93 and D=19.65, signals a potential bullish reversal but has not yet been confirmed. Bears will be watching for a break below the 1.3547 support level, which could open the door for a move towards 1.34863.
Technicals as Evidence: Which Side Has the Edge?
The technical picture for GBPUSD is mixed, with conflicting signals across different timeframes. The short-term (1H) trend is bullish, supported by positive MACD momentum and an RSI in neutral territory. However, the Stochastic oscillator suggests the pair is approaching overbought conditions, signaling a possible pullback. The medium-term (4H) trend is neutral, with a weak ADX indicating a lack of strong directional momentum. The daily chart presents a more cautious outlook, with the RSI slightly bearish and the MACD showing negative momentum.
The ADX on the 1H chart is at 22.67, indicating a moderate trend strength. This suggests that the current bullish momentum has some legs, but may not be sustainable in the long run. The 4H stochastic oscillator, with K=72.95 and D=57.32, shows that the pair has room to move higher before reaching overbought conditions. A key level to watch is the 1.35572 resistance on the 1H chart. A successful break above this level could confirm the bullish bias, while a failure to break higher could signal a potential bearish reversal.
Looking at multiple timeframes and indicators provides a balanced perspective. The 1H chart shows a bullish trend, while the 4H and 1D charts present a more neutral to bearish outlook. Traders should monitor key support and resistance levels, as well as upcoming economic data releases, to gain a clearer understanding of the market's direction. The key is to wait for confirmation signals, such as a break above resistance or a break below support, before making any trading decisions. For example, a successful breakout above the 1.35572 resistance on the 1H chart, combined with positive economic data, could provide a strong bullish signal.
Economic Calendar: The Catalyst for a Breakout?
The economic calendar is packed with high-impact events that could significantly influence GBPUSD. Traders are closely watching the upcoming USD data. The previous USD data came in at 91.2, significantly above the forecast of 87.4. Strong economic data typically supports the dollar, potentially putting pressure on GBPUSD. Conversely, weak data could weaken the dollar and support GBPUSD. Additionally, traders are monitoring the EUR data. The previous EUR data came in at 0.3, matching the forecast. Economic data releases will likely be the primary catalyst for a breakout in GBPUSD.
With DXY at 97.38, the dollar index is showing slight weakness, providing some support to GBPUSD. The SP500 is currently at 6946.85, reflecting positive risk sentiment. A decline in the SP500 could trigger safe-haven flows, potentially supporting the dollar and putting pressure on GBPUSD. Traders should closely monitor these correlations to gain a broader understanding of the market dynamics.
Key Levels
Support Levels
Resistance Levels
Technical Outlook Summary
| Indicator | Value | Signal |
|---|---|---|
| RSI (14) | 59.45 | Neutral |
| MACD Histogram | Positive | Bullish |
| Stochastic | 80.82/65.9 | Bullish |
| ADX | 19.13 | Weak Trend |
| Bollinger | Upper Band | Watch |
Frequently Asked Questions: GBPUSD Analysis
Is GBPUSD a good buy right now?
The GBPUSD's current price of $1.36 presents a mixed picture. The 1H trend is bullish, however, the ADX indicates a weak trend. Therefore, a buy position would be risky until a stronger trend emerges.
What is the GBPUSD price forecast for this week?
The GBPUSD price forecast for this week hinges on upcoming economic data releases. A break above the 1.35572 resistance could lead to further gains, targeting 1.35632, while a break below 1.3547 could open the door for a move towards 1.34863.
What are the key support and resistance levels for GBPUSD?
Key support levels for GBPUSD are 1.3547, 1.35428, and 1.35368. Key resistance levels are 1.35572, 1.35632, and 1.35674, according to the 1H chart.
Why is GBPUSD moving today?
GBPUSD is currently moving due to a combination of technical factors and anticipation of upcoming economic data. The short-term bullish trend is being countered by longer-term neutral to bearish signals, creating a volatile environment.
Track markets in real-time
AI-powered analysis, technical indicators and real-time price data.
Join Our Telegram Channel
Breaking market news, AI analysis and trading signals instantly.
Join Channel