
GBPUSD Tests $1.33 Resistance; Powell Testimony Looms
GBPUSD hovers near $1.33 resistance as traders await Powell's testimony. Technicals show mixed signals, with 1H bullish but 1D bearish.
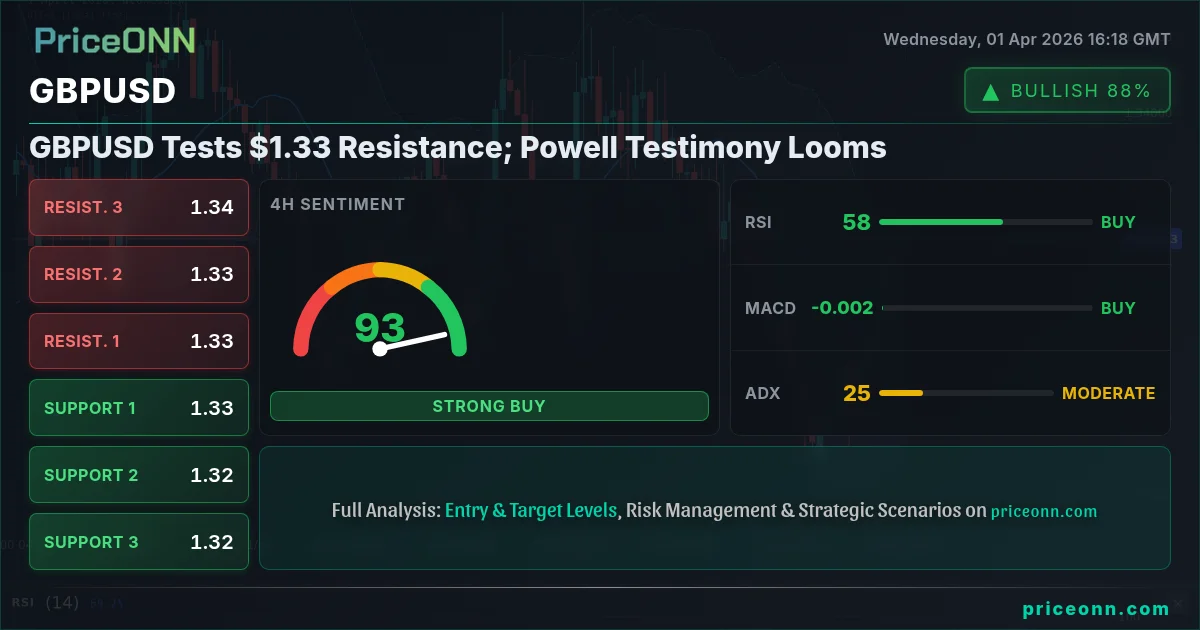
The critical juncture for GBPUSD is here. As the pair hovers precariously around the $1.33 mark, the market is holding its breath, caught between a technically strong short-term bullish setup and a looming fundamental catalyst in the form of Fed Chair Powell's testimony. With the price currently sitting at $1.33166, the question on every trader's mind is whether this resistance level will hold, leading to a bearish retracement, or if stronger forces will propel it higher. This analysis delves into the intricate dance of technical indicators, macroeconomic drivers, and geopolitical undercurrents shaping the immediate future of the British Pound against the US Dollar.
- GBPUSD is trading at $1.33166, testing key resistance levels.
- The 1-hour chart shows strong bullish momentum (RSI 67.1, ADX 31.38), but the 1-day chart indicates a bearish trend (RSI 46.98, ADX 32.49).
- Key support is identified at $1.33121, while resistance looms around $1.33443.
- Upcoming Fed Chair Powell's testimony is a major event risk that could significantly impact the pair.
Navigating the $1.33 Confluence Zone
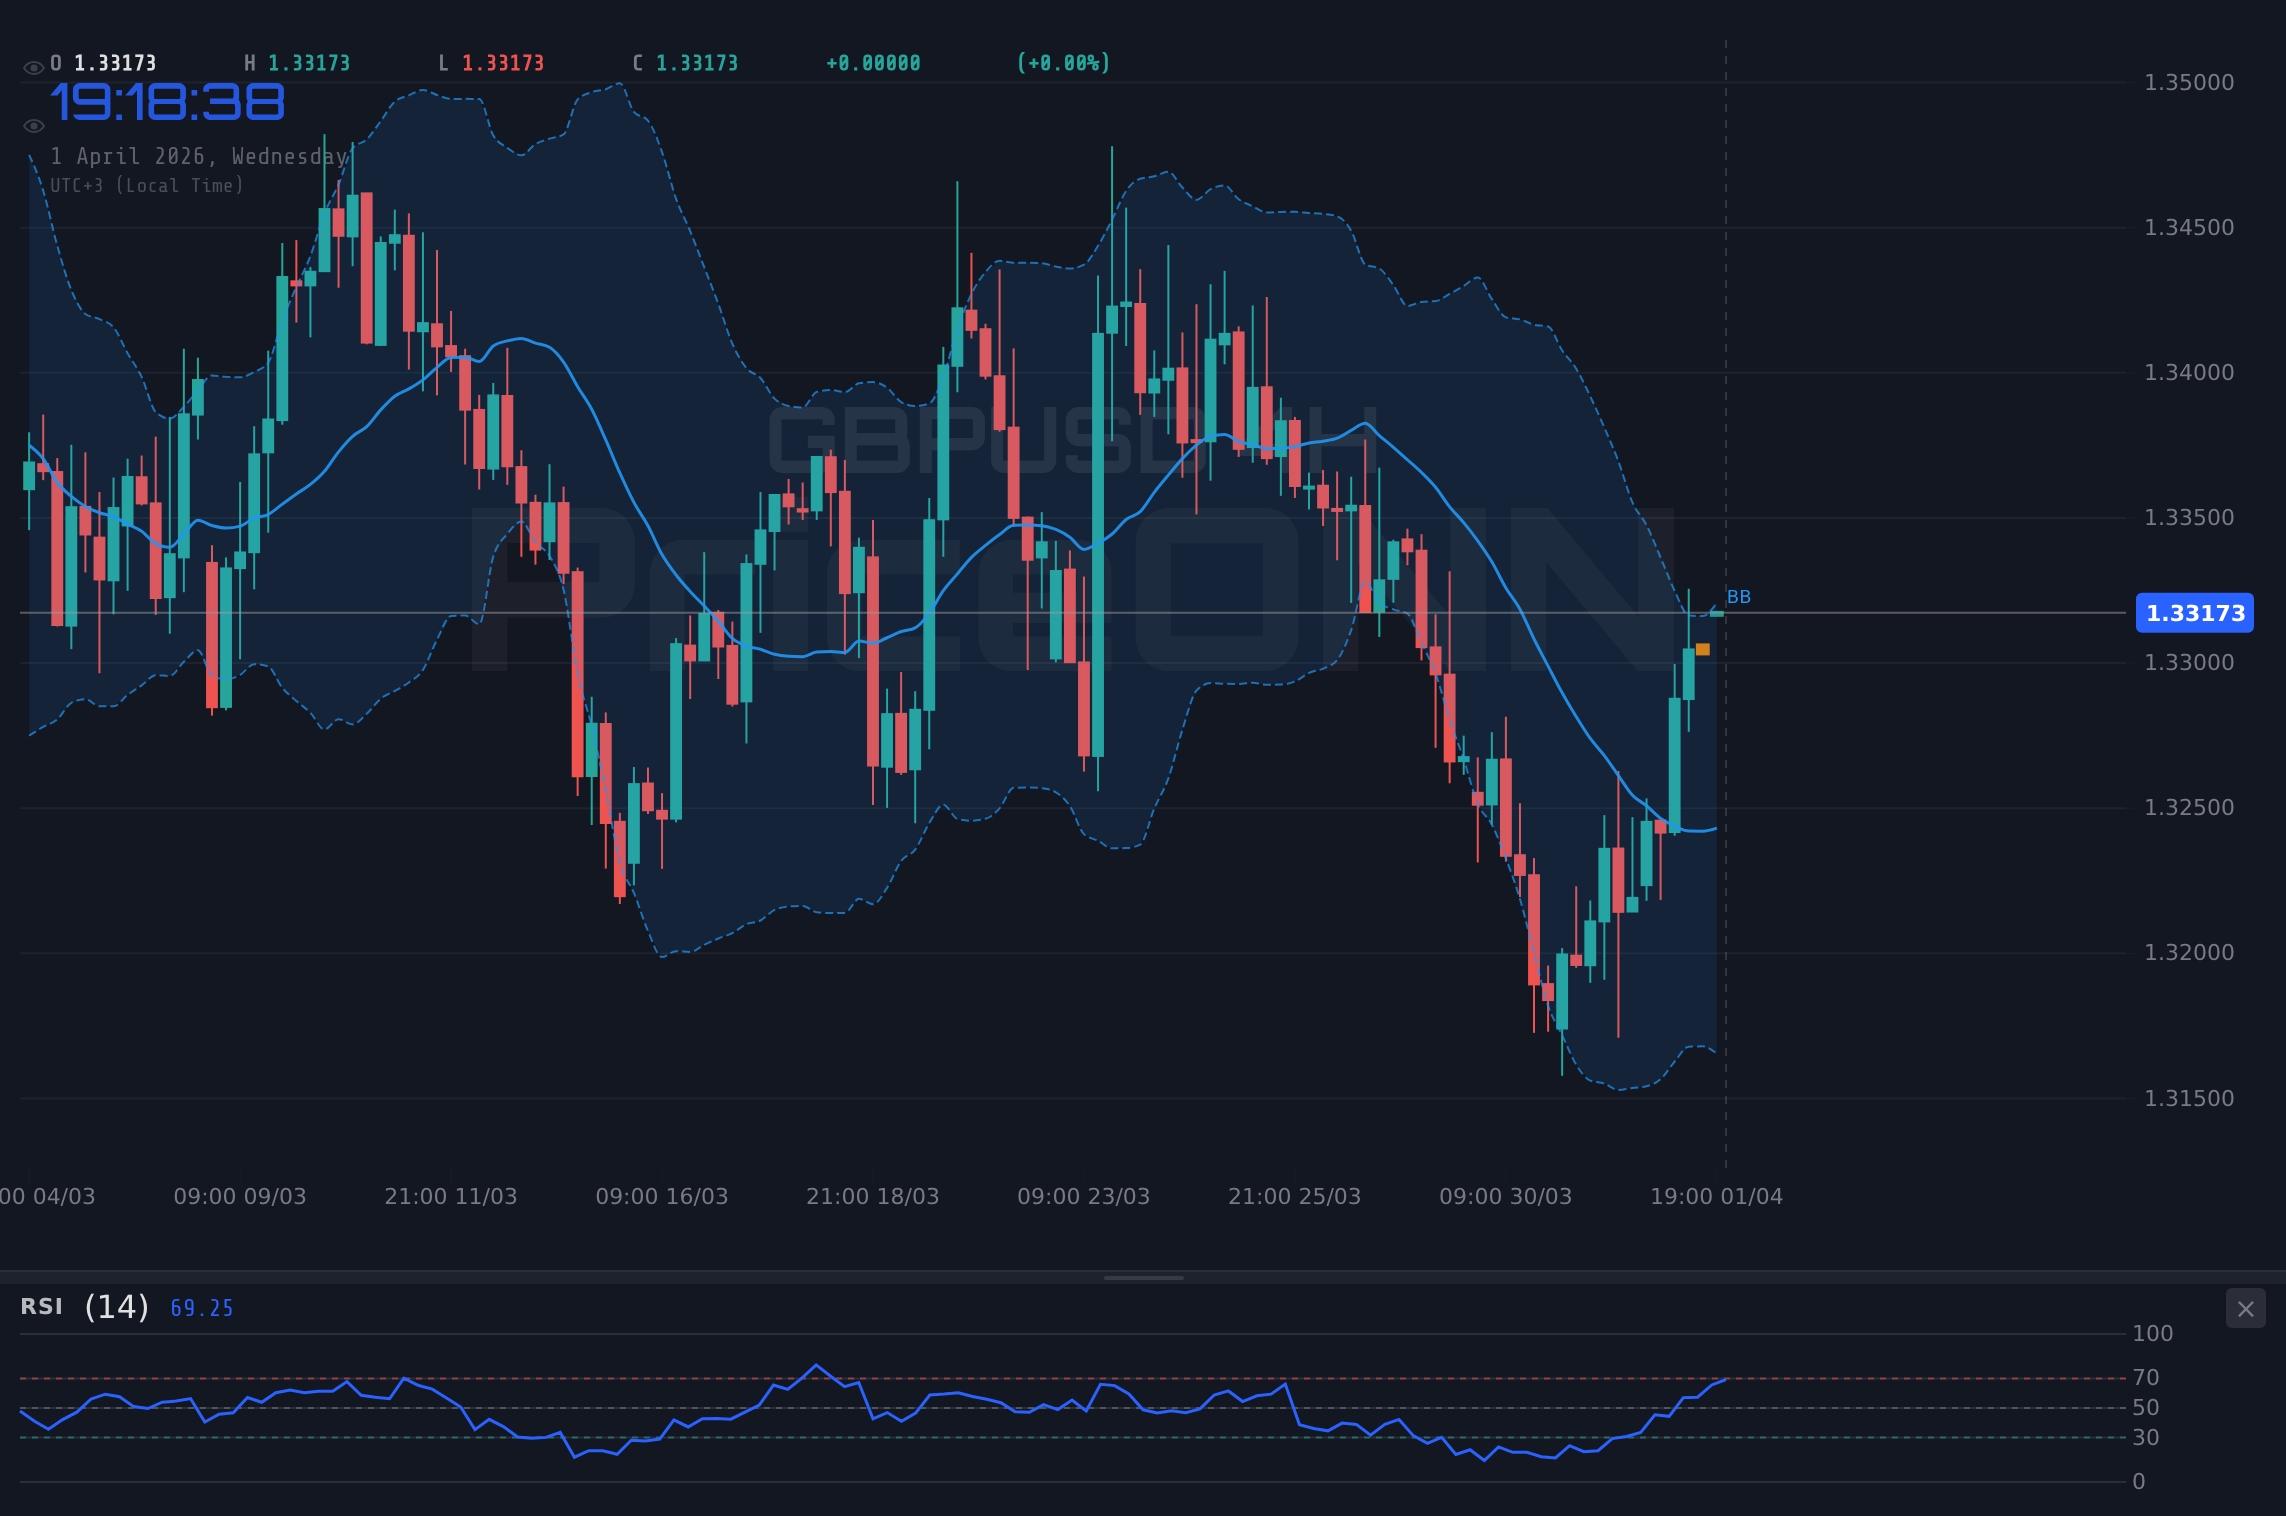
The GBPUSD pair finds itself at a pivotal point, trading near the $1.33 psychological level. This area is not just a round number; it represents a significant technical confluence, where several resistance indicators are converging. On the 1-hour chart, the price is pushing against the upper Bollinger Band and showing strong bullish signals with an RSI of 67.1 and an ADX reading of 51.08 indicating a strong trend. However, this short-term optimism is tempered by a more cautious outlook on the daily timeframe. The daily RSI sits at 46.98, suggesting a bearish lean, while the ADX, though strong at 32.49, points towards a prevailing downward trend on the longer timeframe. This divergence between short-term momentum and long-term trend is a classic sign of market indecision, making the $1.33 level a crucial battleground.
The intraday strength observed in GBPUSD is partly fueled by a weaker US Dollar. The DXY, or Dollar Index, is currently trading at 98.94, showing a daily decline of -0.3%. This weakness in the dollar is providing some breathing room for riskier assets and currencies, including the British Pound. The 1-hour trend for DXY is decisively bearish, with its RSI at 42.71 and ADX at 53.65. This dollar weakness has allowed GBPUSD to climb, testing its immediate resistance. However, the longer-term trend for DXY on the daily chart remains bullish, indicating that the current dollar pullback might be a temporary pause rather than a full reversal. This dynamic creates a complex backdrop for GBPUSD, as any shift in dollar sentiment could quickly alter the pair's trajectory.
The Bullish Case: Riding the Short-Term Momentum
For the bulls to seize control, GBPUSD must decisively break and hold above the immediate resistance zone around $1.33443. The current 1-hour technicals provide a foundation for this optimism. The MACD is showing positive momentum, and the Stochastic Oscillator, with K at 91.24 and D at 87.62 on the 4-hour chart, is deep in overbought territory but still trending upwards, suggesting that buyers might have more room to push prices higher, at least in the short term. A sustained move above $1.33443 could target the next resistance level at $1.33555, and potentially extend towards $1.33765. The strength of the 1-hour trend, supported by an ADX of 31.38, implies that if a breakout occurs, it could be swift and decisive.
However, this bullish scenario hinges critically on the conviction behind the move. The RSI on the 1-hour chart is already at 67.1, nearing the overbought threshold. While not an immediate sell signal, it suggests that the upward momentum might soon face headwinds. Furthermore, the underlying daily trend for GBPUSD remains bearish, which acts as a significant headwind for any sustained rally. For the bullish case to gain more credibility, we would need to see a clear breach of daily resistance levels and a shift in the longer-term trend indicators. Until then, any upside move carries the inherent risk of being a 'bull trap' - a temporary surge before a more significant decline.
The Bearish Scenario: Powell's Shadow and Daily Trend
The bearish outlook for GBPUSD is primarily anchored by the persistent downtrend observed on the daily charts and the significant event risk posed by Fed Chair Powell's upcoming testimony. On the daily timeframe, the RSI at 46.98 and the ADX at 32.49 indicate a strong downward trend is still in play, despite short-term fluctuations. The price is currently trading below the daily middle Bollinger Band, reinforcing the bearish bias. If GBPUSD fails to break through the $1.33443 resistance, or if Powell's testimony signals a more hawkish stance from the Federal Reserve, we could see a sharp reversal. The immediate support level to watch is $1.33121. A break below this could open the door for a move towards $1.32911 and potentially the more significant support at $1.32799.
The Federal Reserve's monetary policy stance is a key driver for global markets, and particularly for the US Dollar. Any hint of continued hawkishness - higher-for-longer interest rates, or a less dovish tone than anticipated - could strengthen the DXY, thereby pressuring GBPUSD downwards. The market's sensitivity to Fed commentary cannot be overstated, especially when the pair is already teetering at a resistance level. The recent economic data, although mixed, has not provided a clear signal for a dovish pivot, leaving the door open for the Fed to maintain a cautious stance. This uncertainty is a fertile ground for bearish price action, especially if coupled with any negative sentiment regarding the UK economy.
The Waiting Game: Consolidation Near $1.33
Given the conflicting signals between the short-term bullish momentum and the longer-term bearish trend, as well as the overarching uncertainty surrounding Fed policy, a period of consolidation around the $1.33 level is a highly probable scenario. This range-bound environment could see GBPUSD trading between the immediate support at $1.33121 and resistance at $1.33443. During such periods, technical indicators often become less reliable, as they reflect choppy, indecisive market action. The ADX readings, which are currently strong on the 1-hour and daily charts, might start to falter if the price remains range-bound, indicating a weakening trend. Trading within such a range requires careful risk management, focusing on bounces off support and rejections at resistance, rather than expecting significant directional moves.
The current market sentiment, as reflected by the DXY's slight pullback and the cautious optimism in equities like the S&P 500 (trading at 6575.1) and Nasdaq (24112.55), suggests a temporary easing of risk aversion. However, this environment is fragile. Geopolitical tensions, particularly in the Middle East, continue to cast a long shadow, potentially reigniting safe-haven demand for the US Dollar at any moment. The price of Brent crude oil, currently around $105.57, remains elevated, contributing to inflation concerns that the Fed is closely monitoring. This complex interplay of factors - dollar weakness, equity strength, oil prices, and central bank policy expectations - creates a precarious balance that could easily tip the scales in either direction, leading to a prolonged consolidation phase around $1.33.
The Most Likely Path: Powell's Testimony as the Decider
Assessing the probabilities, the most compelling scenario leans towards a bearish outcome, contingent on Fed Chair Powell's testimony. While the 1-hour chart shows bullish strength, it's often overwhelmed by significant fundamental drivers, especially central bank pronouncements. The daily chart's bearish bias and the persistent strength of the US Dollar on longer timeframes suggest that any upside momentum is likely to be capped. Therefore, the probability of a bearish move, triggered by Powell's hawkish remarks or a failure to break resistance, is estimated at around 60%. A neutral, range-bound scenario around $1.33 holds a significant probability as well, estimated at 30%, reflecting the current market indecision.
The bullish scenario, requiring a decisive break above $1.33765 and sustained positive rhetoric from the Fed, appears less probable under current conditions, estimated at 10%. The market's tendency to price in Fed expectations ahead of time means that any dovish surprise would likely have already been reflected in the price action. Given the current technical setup and the macro environment, the immediate focus remains on how the market interprets Powell's words. A hawkish tone would likely cement the bearish scenario, while a dovish surprise could open the door for a more sustained bullish move, but that appears to be the less likely outcome heading into the testimony.
What I'm Watching: Key Triggers for GBPUSD
To navigate this complex landscape, traders must keep a close eye on specific triggers. Firstly, the immediate price action around the $1.33121 support and $1.33443 resistance levels is paramount. A clear break and hold above resistance, backed by strong volume, would be a bullish signal, while a decisive drop below support would confirm the bearish outlook.
Secondly, and perhaps most importantly, is Fed Chair Powell's testimony. The market will be dissecting every word for clues on the Fed's future policy path. Any indication of a continued hawkish stance or delayed rate cuts would likely strengthen the USD and push GBPUSD lower. Conversely, any dovish hints could provide a reprieve for the pair. Pay close attention to the language used regarding inflation, employment, and the overall economic outlook.
Finally, broader market sentiment and correlations are crucial. A significant shift in risk appetite, reflected in equity markets like the S&P 500 and Nasdaq, or a sharp move in the DXY beyond its current intraday trend, could also act as powerful triggers. A sudden spike in oil prices due to geopolitical escalation could also reignite inflation fears and influence Fed policy expectations, thereby impacting GBPUSD.
Bearish Scenario: Powell's Testimony Weakens GBPUSD
60% ProbabilityNeutral Scenario: Range-Bound Consolidation
30% ProbabilityBullish Scenario: Dovish Fed Sparks Rally
10% ProbabilityFrequently Asked Questions: GBPUSD Analysis
What happens if GBPUSD breaks above the $1.33443 resistance level?
A sustained break above $1.33443, particularly if accompanied by dovish remarks from Fed Chair Powell, could target the next resistance levels at $1.33555 and potentially $1.33765. This would signal a shift towards a more bullish short-term outlook.
Should I consider selling GBPUSD at current levels near $1.33, given the daily bearish trend?
Selling at current levels carries risk due to the short-term bullish momentum. A more prudent approach would be to wait for confirmation, such as a break below the $1.33121 support, or a clear bearish signal from Powell's testimony, which would increase the probability of a downside move towards $1.32799.
Is the RSI at 67.1 on the 1-hour chart a sell signal for GBPUSD?
An RSI of 67.1 indicates strong bullish momentum but is not yet in the extreme overbought territory that typically signals an immediate reversal. While it suggests the upside might be limited, it's not a standalone sell signal, especially with the prevailing short-term uptrend.
How will Fed Chair Powell's testimony affect GBPUSD this week?
Powell's testimony is a critical catalyst. A hawkish tone, emphasizing inflation concerns and a commitment to higher rates, would likely strengthen the USD, pushing GBPUSD lower towards $1.32799. Conversely, a dovish tone could support a rally towards $1.33765.
| Indicator | Value | Signal | Interpretation |
|---|---|---|---|
| RSI (14) | 67.1 | Neutral | Nearing overbought on 1H, bearish lean on 1D |
| MACD | Positive Momentum | Bullish | Short-term positive, but watch for divergence |
| Stochastic | K=91.24, D=87.62 | Bearish | Overbought on 4H, suggesting potential pullback |
| ADX | 31.38 | Bullish | Strong trend on 1H, but overall trend is bearish on 1D |
| Bollinger Bands | Above Upper Band | Watch | Indicates potential overextension or breakout |
Track markets in real-time
AI-powered analysis, technical indicators and real-time price data.
Join Our Telegram Channel
Breaking market news, AI analysis and trading signals instantly.
Join Channel