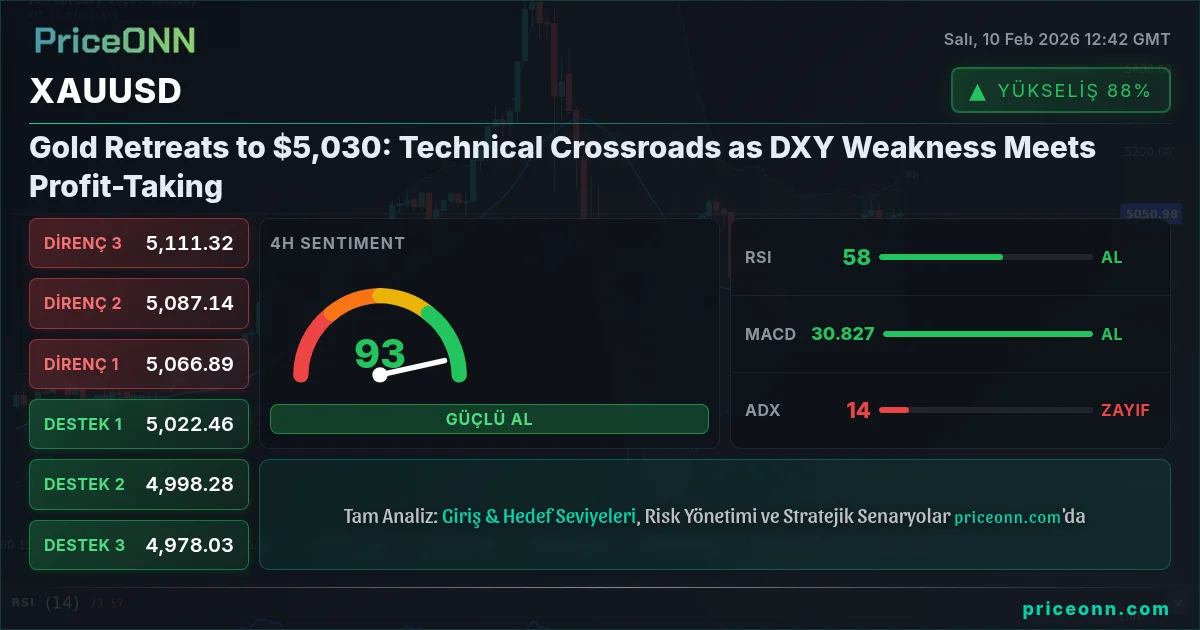
Gold opened Monday's session at $5,058 before retreating to $5,030 - a modest 0.5% pullback that tells a bigger story than the headline suggests. The yellow metal is navigating a technical crossroads: a weakening dollar that should provide tailwinds, yet profit-taking pressure near the psychological $5,050 level is keeping bulls cautious. For swing traders watching the daily and 4-hour charts, the next 48 hours will define whether this is a healthy retracement or the start of something more serious.
The dollar index (DXY) is trading at 96.55 with a 1-hour RSI of 27.82 - deeply oversold territory. This should theoretically support gold, yet XAUUSD is declining. Why? The answer lies in profit realization flows after gold's recent surge past $5,000. Traders who rode the rally from $4,860 are locking in gains, creating short-term headwinds despite macro support.
Time Horizon: This analysis is for swing traders, focusing on 4-hour and daily charts with a 2–4 week outlook.
The Dollar Paradox: Weakness That Isn't Helping
Let's address the elephant in the room. DXY is collapsing - down to 96.55 with an ADX of 46.68 signaling strong bearish momentum. The 4-hour Stochastic sits at 7.02/8.46, screaming oversold conditions. In a textbook scenario, this should send gold soaring. But markets don't read textbooks.
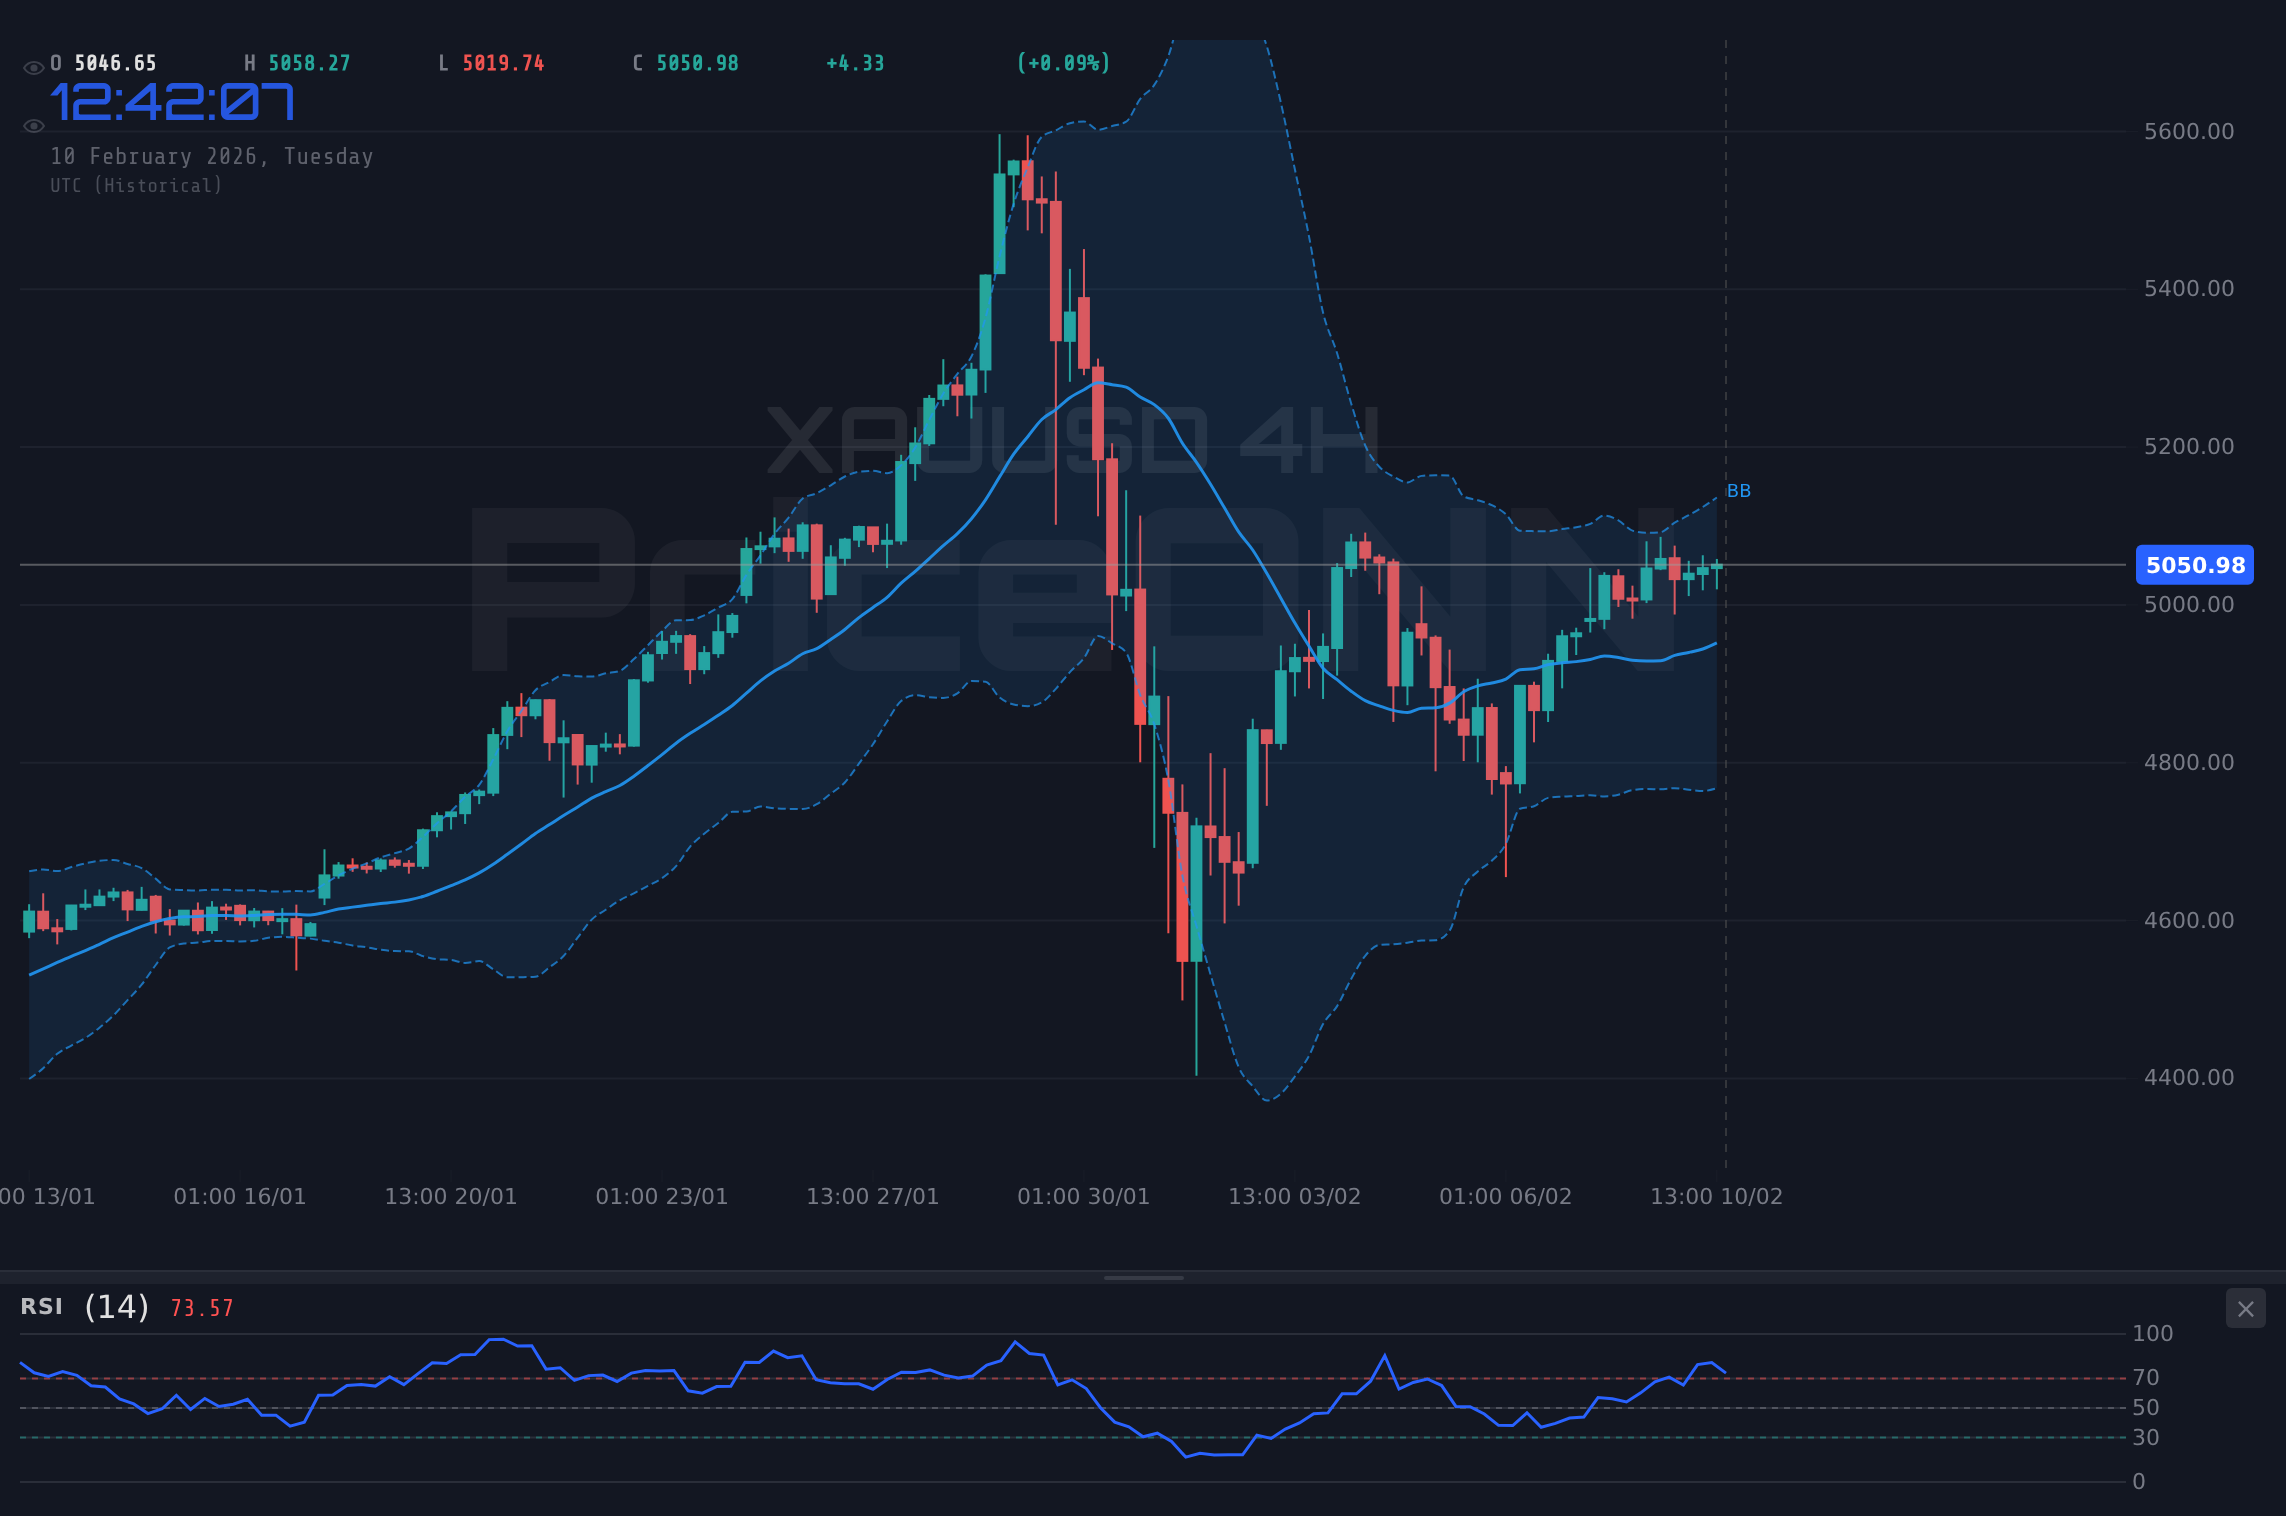
Here's what's happening: correlation breakdown. Gold and the dollar typically move inversely, but that relationship becomes murky when gold is this overbought on longer timeframes. The daily RSI sits at 57.03 - neutral, but 4-hour RSI is 56.1 with Stochastic at 81.7/88.44, firmly in overbought territory. Translation? Bulls are exhausted, taking a breather regardless of what the dollar does.
- DXY 4H Breakdown: Trading below both Bollinger bands (alt bandın altında), which historically precedes a technical bounce - bad news for gold if DXY recovers even modestly.
- Gold's 1H Action: Price rejected at $5,075.16 (today's high) and fell back to $5,027.86 support. RSI 52.33 suggests indecision - neither buyers nor sellers have conviction.
- MACD Divergence: 1H MACD is negative (below signal line) while 4H MACD remains positive. This cross-timeframe conflict means choppy, directionless trade is likely until one timeframe capitulates.
Don't chase the dollar's weakness blindly. DXY's 1-hour RSI at 27.82 means a snapback rally is overdue. If DXY bounces to 96.80–97.00, gold could quickly test $5,000 support. The market is pricing in dollar weakness, so further declines won't juice gold higher - only a surprise dollar collapse would.
Technical Architecture: The Levels That Matter
Forget the noise. Three levels define gold's near-term fate: $5,027 (current support), $5,052 (immediate resistance), and $4,987 (the line in the sand).
The 1-hour chart shows gold coiling between $5,027.86 (S1) and $5,052.17 (R1) - a tight 24-point range. This compression, combined with a Bollinger Band squeeze, suggests an explosive move is brewing. But which way?
- Scenario 1 (Bullish Breakout): A 4-hour close above $5,052 with volume confirmation targets $5,066 (R2) and potentially $5,076 (R3). This requires RSI pushing above 60 and MACD histogram turning positive on the hourly.
- Scenario 2 (Bearish Breakdown): A daily close below $5,027 opens the door to $5,017 (S2) and $5,003 (S3). The critical invalidation is $4,987.85 (today's low) - losing that flips the daily structure bearish.
Watch the 4-hour Bollinger Bands. Gold is currently above the middle band at $5,039.48, which acts as dynamic support. If price slices through and closes below the middle band with expanding lower band width, that's your signal - momentum is shifting bearish. Conversely, a squeeze above the upper band ($5,081.65) with ADX rising above 20 confirms breakout.
ADX tells the momentum story: 1-hour ADX is 19.99 (weak trend), 4-hour ADX is 16.34 (sideways chop), but daily ADX stands at 31.44 - still signaling a strong uptrend. This divergence means the larger trend is intact, but intraday/swing traders face noise. Patience pays.
The Central Bank Bid: Structural Support That Won't Quit
Step back from the 1-hour candles for a moment. Gold isn't trading at $5,030 by accident - it's here because central banks are relentless buyers. In Q4 2025, global central banks added an estimated 310 tons of gold to reserves, with China and Russia leading the charge. This isn't speculation; it's documented in IMF filings.
Why does this matter for swing traders? Because it creates a structural bid beneath the market. Every significant dip (think $4,860, $4,750 zones earlier this year) gets absorbed by sovereign buyers who don't care about daily volatility. They're building long-term positions, which puts a floor under gold even during technical corrections.
For investors with a 3–6 month horizon, pullbacks to the $4,985–$5,000 zone represent accumulation opportunities. Central bank buying, coupled with Fed rate cut expectations later in H1 2026, provides a fundamental safety net. You're not catching a falling knife - you're buying what sovereign wealth funds are buying.
Bloomberg reported last week that China's PBOC resumed gold purchases in January after a brief pause - adding 15 tons to reserves. That's on top of India's RBI quietly accumulating in Q4. When the world's two most populous nations are buying, retail traders betting against gold long-term are swimming upstream.
Macro Catalysts: What's On The Radar
Markets never trade in a vacuum. Let's map the upcoming data that could shake gold out of its consolidation range:
The CPI print on Wednesday is the week's heavyweight. If core CPI (ex-food and energy) comes in at 0.4% or higher, gold likely breaks $5,050 resistance as rate cut bets get repriced. But if CPI undershoots, we could see a "sell the fact" move where gold dips to $5,000–$5,010 before finding buyers. Reduce position size by 30–40% into the CPI release, then scale back in based on price action post-data.
Beyond the data calendar, keep an eye on Fed speak. Any hints from Powell or voting members about March rate decisions will move markets. Currently, Fed Fund Futures price in a 62% chance of a 25bp cut by June 2026. If that probability rises to 70%+, gold rallies. If it falls below 50%, we test $4,950.
Indicator Deep Dive: What RSI, MACD, and ADX Are Really Saying
Time to get granular. Let's dissect the technicals without the fluff:
RSI Analysis (14-period):
- 1H: 52.33 - Dead neutral. No directional bias. This is where RSI sits during consolidation before big moves. Historically, gold breaks out when 1H RSI crosses 55 (bullish) or breaks 48 (bearish).
- 4H: 56.1 - Mildly bullish, but approaching overbought. Here's the rub: 4H Stochastic is already at 81.7/88.44 (overbought), suggesting RSI might not have room to run much higher before rolling over.
- Daily: 57.03 - Healthy uptrend territory (50–60 range). This confirms the macro trend is intact. Gold can stay in this zone for weeks during sustained rallies.
MACD Histogram:
- 1H: Negative - MACD line is below the signal line, generating weak sell pressure. But the histogram bars are shallow, indicating sellers lack conviction.
- 4H: Positive - MACD is above signal, supporting the bullish case. As long as this holds positive, dips are buyable.
- Daily: Negative - A bearish divergence here. Price made higher highs (above $5,000), but MACD didn't confirm. This is a yellow flag, not a red flag. It means the rally is maturing, not necessarily ending.
Divergence Alert: 4H MACD is bullish while Daily MACD is bearish - a classic cross-timeframe conflict. How to trade it? Simple: favor the daily timeframe direction (bearish divergence = caution), but use 4H MACD for entry timing. Wait for 4H MACD to turn negative before initiating shorts, or for Daily MACD to flip positive before adding longs.
ADX (Average Directional Index):
- 1H: 19.99 - Below 20 = weak trend, choppy conditions. Avoid breakout trades on 1H timeframe; false breaks are likely.
- 4H: 16.34 - Even weaker. This timeframe is range-bound. The $5,020–$5,080 range will hold until ADX breaks above 20.
- Daily: 31.44 - Above 25 = strong trend. This is where swing traders should focus. The daily trend is your friend; intraday chop is just noise.
When lower timeframes show weak ADX (below 20) but daily ADX is strong (above 25), it's a coiling pattern. Think of it like compressing a spring - the daily trend wants to continue, but intraday traders are indecisive, creating a tight range. The resolution is usually violent and in the direction of the stronger timeframe trend (bullish, in this case). Watch for 4H ADX to suddenly spike above 25 - that's your breakout signal.
Risk Correlations: Silver, Crude, and FX Clues
Gold doesn't trade in isolation. Let's decode what related markets are signaling:
Silver (XAGUSD): Down 2.17% to $81.45, significantly underperforming gold. Silver's RSI on all timeframes (51.75 on 1H, 49.13 on 4H, 46.93 on Daily) is weaker than gold's. This divergence is bearish for precious metals broadly. When silver leads lower, gold often follows within 24–48 hours. The gold/silver ratio is widening - a sign of defensive positioning.
If you're long gold, consider hedging with a small short in silver. The XAU/XAG ratio is at 61.7 (gold is 61.7x more expensive than silver). Historically, readings above 60 precede either a gold pullback or a silver rally. Since silver is already weak, the path of least resistance is gold declining to compress the ratio. A tactical XAGUSD short at $81.50 with a stop at $84.00 offers 3:1 risk/reward if gold dips to $5,000.
Crude Oil (WTI/Brent): Brent is up 1.96% to $65.73, showing resilience. WTI is flat at $64.28. Rising crude typically correlates with inflation expectations - bullish for gold. But here's the twist: oil's rally is driven by supply concerns (OPEC+ cuts), not demand. If it's supply-driven, the inflationary impact is muted, limiting gold's upside. Watch for WTI to break $66.00 - that would confirm inflationary momentum and support gold above $5,050.
- EURUSD: At 1.1911, up 0.01%, with 4H RSI at 67.31 (approaching overbought). Euro strength = dollar weakness = gold support. But EUR is bumping into 1.1920 resistance. If it fails here, dollar could bounce, pressuring gold.
- GBPUSD: At 1.3685, also flirting with overbought (4H RSI 59.25, 4H Stochastic 88.42). Sterling's strength mirrors euro's - both are DXY proxies. If both EUR and GBP roll over, it confirms a dollar bounce is coming.
Positioning and Sentiment: What the Smart Money Is Doing
Let's talk about what matters: who's on the other side of your trade?
According to the latest COT (Commitments of Traders) report, non-commercial speculators (hedge funds, CTAs) hold net long positions of ~245,000 contracts in gold futures - elevated but not extreme. The concern? Speculative longs have been building for six weeks. That's a lot of "weak hands" who'll bail at the first sign of trouble.
Contrast that with commercial hedgers (bullion banks, miners), who are net short ~280,000 contracts. Commercials are typically right at turning points - they're short because they expect supply to catch up with demand, or they're hedging physical positions. Either way, their positioning suggests caution.
When speculators are heavily long and commercials are heavily short, gold becomes vulnerable to long liquidation cascades. A break below $5,000 could trigger stop-loss orders, potentially cascading to $4,950–$4,900. This is why I'm emphasizing risk management. Don't let a 2% pullback turn into a 5% drawdown because you're stubbornly holding without stops.
Sentiment indicators like the Daily Sentiment Index (DSI) show gold bulls at 68% - bullish, but not euphoric. The danger zone is 80%+. At 68%, there's still room for upside, but the easy money has been made. New longs should be entered with tight stops.
Trade Scenarios: Three Paths Forward
Markets offer choices, not certainties. Here are three scenarios with probabilities and action plans:
Scenario A - Breakout to New Highs
40% ProbabilityScenario B - Healthy Retracement
45% ProbabilityScenario C - Breakdown to Deeper Correction
15% ProbabilityDon't go all-in on Scenario A or B. Allocate 50% of your intended position to Scenario B (the base case), 30% reserved for Scenario A if it triggers, and 20% cash for Scenario C or other opportunities. This way, you're not caught flat-footed regardless of which path gold takes. Scale in and out - no hero trades.
Risk Management: The Non-Negotiables
I'm going to say something unpopular: most traders lose money not because they're wrong, but because they don't manage risk. You can be right on direction and still blow up your account if you're over-leveraged or don't use stops.
Here's the risk framework for trading gold at $5,030:
- Position Sizing: Risk no more than 1–2% of your account per trade. If you're trading $10,000, that's $100–$200 at risk. With gold's ATR (Average True Range) around $30–$40 daily, a stop 1 ATR away = $30. So max position = $200 / $30 = 6.6 micro lots (0.066 standard lots). Scale accordingly.
- Stop-Loss Discipline: Every entry needs a stop. For longs above $5,030, stop below $5,000 (Daily S1 at $4,987). For shorts below $5,020, stop above $5,055. No mental stops - use hard stops in the platform.
- Time Stops: If a trade hasn't moved in your favor within 24–36 hours (for 4H setups) or 3–5 days (for Daily setups), exit. Don't let a scratch turn into a bleed.
- Correlation Hedges: If you're heavily long gold, hedge with a small DXY long or silver short. This dampens volatility in your P&L.
Upcoming CPI Volatility: Gold's ATR typically expands 30–50% around major data releases like CPI. If normal ATR is $35, expect $50+ moves post-CPI. Cut your position size by 30–50% into the event, or widen stops to 1.5x ATR to avoid getting shaken out by volatility whipsaws. Re-enter after the dust settles.
Technical Indicator Dashboard: Full Breakdown
| Timeframe | Indicator | Value | Signal | Interpretation |
|---|---|---|---|---|
| 1H | RSI (14) | 52.33 | Neutral | No directional bias; consolidation |
| MACD | Negative | Bearish | Below signal line, weak sell pressure | |
| Stochastic | 46.43 / 55.29 | Bearish Cross | %K below %D, minor downside bias | |
| ADX | 19.99 | Weak Trend | Below 20 = choppy, avoid breakout trades | |
| Bollinger | Below Mid | Bearish | Below middle band, slight downside momentum | |
| 4H | RSI (14) | 56.10 | Bullish | Above 50, uptrend intact but approaching OB |
| MACD | Positive | Bullish | Above signal line, supporting upside | |
| Stochastic | 81.70 / 88.44 | Overbought | Above 80, pullback risk rising | |
| ADX | 16.34 | Weak Trend | Below 20 = range-bound, wait for breakout | |
| Bollinger | Above Mid | Bullish | Above middle band, upside bias | |
| Daily | RSI (14) | 57.03 | Bullish | Healthy uptrend zone (50–60) |
| MACD | Negative | Bearish Divergence | Below signal despite price higher high = caution | |
| Stochastic | 51.46 / 41.26 | Bullish Cross | %K above %D, minor upside bias | |
| ADX | 31.44 | Strong Uptrend | Above 25 = trend is strong, dips are buyable | |
| Bollinger | Above Mid | Bullish | Above middle band, macro uptrend intact |
The Daily timeframe is your North Star - ADX 31.44 confirms a strong uptrend, and RSI 57.03 shows room to run. Lower timeframes (1H/4H) are noisy due to weak ADX and overbought Stochastics. Trust the Daily, trade the 4H for entries, ignore the 1H unless you're scalping.
Critical Support & Resistance Levels
Level Logic: S1 ($5,027.86) is your immediate line in the sand for intraday longs. Break below S3 ($5,003.55) and the narrative shifts bearish for swing trades. On the upside, R1 ($5,052.17) is the gate - clear it convincingly, and R2/R3 fall quickly. R5 ($5,108) is the 4H measured move target if the breakout sustains.
Final Thoughts: Patience Pays in Compression Zones
Gold at $5,030 is neither a screaming buy nor an urgent sell. It's a compression zone - a coiled spring waiting for a catalyst. The macro picture (weak dollar, central bank buying, Fed cut hopes) supports higher prices over the next 2–4 weeks. But the micro picture (overbought 4H Stochastics, profit-taking flows, weak intraday ADX) warns against chasing here.
The trade? Wait for clarity. Either wait for a breakout above $5,052 with volume confirmation to go long, or wait for a dip to $5,000–$5,010 where risk/reward improves for longer-term positions. In the meantime, if you're itching to trade, keep size small and stops tight.
Remember: volatility is opportunity, but only for those who respect it. Over-leverage, and volatility becomes destruction. Size appropriately, use stops religiously, and let the market come to you. The best trades feel slightly uncomfortable when you enter them - because they're the ones nobody else wants to take.
Central banks are buying. Sovereign wealth is accumulating. Retail is nervous. That's exactly the setup where disciplined traders make money. Be disciplined. Be patient. Be positioned.
Piyasaları canlı takip edin
AI destekli analizler, teknik göstergeler ve anlık fiyat verileri.
Telegram Kanalımıza Katılın
Son dakika piyasa haberleri, AI analizleri ve trading sinyalleri.
Kanala Katıl