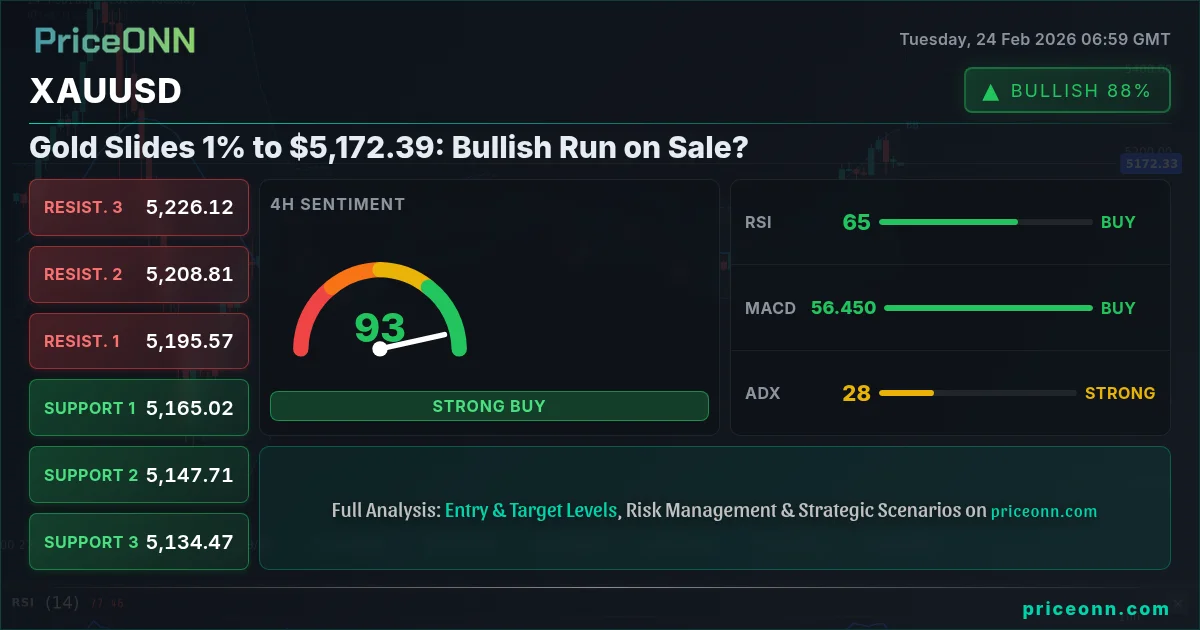
As global markets grapple with evolving inflation expectations and geopolitical tensions, gold finds itself at a pivotal juncture. XAUUSD, currently trading at $5,172.39, has experienced a 1% decline, prompting investors to question whether this is a fleeting opportunity to buy the dip or the start of a more pronounced downward trend. The dollar index (DXY) is currently at 97.49, and this strength typically puts pressure on gold.
- RSI at 65.97 on the 4H chart suggests room for further upside, but nearing overbought conditions.
- Key support level lies at $5,161.06, a break below which could signal further declines.
- The MACD on the 1D chart shows positive momentum, supporting potential bullish continuation.
- Geopolitical uncertainties and inflation concerns continue to be the primary drivers for XAUUSD.
Navigating the Current XAUUSD Landscape
The recent dip in gold prices comes amid a complex interplay of factors. On one hand, persistent inflation concerns and ongoing geopolitical risks, particularly in Eastern Europe and the Middle East, continue to fuel safe-haven demand for the precious metal. On the other hand, hawkish signals from the Federal Reserve regarding potential interest rate hikes have exerted downward pressure on gold, as higher rates tend to increase the opportunity cost of holding non-yielding assets like gold. According to Reuters, Fed officials have emphasized the need to remain vigilant in addressing inflation, which could translate into a more aggressive tightening cycle. The SP500 is currently at 6853.25, which is helping to support the commodity.
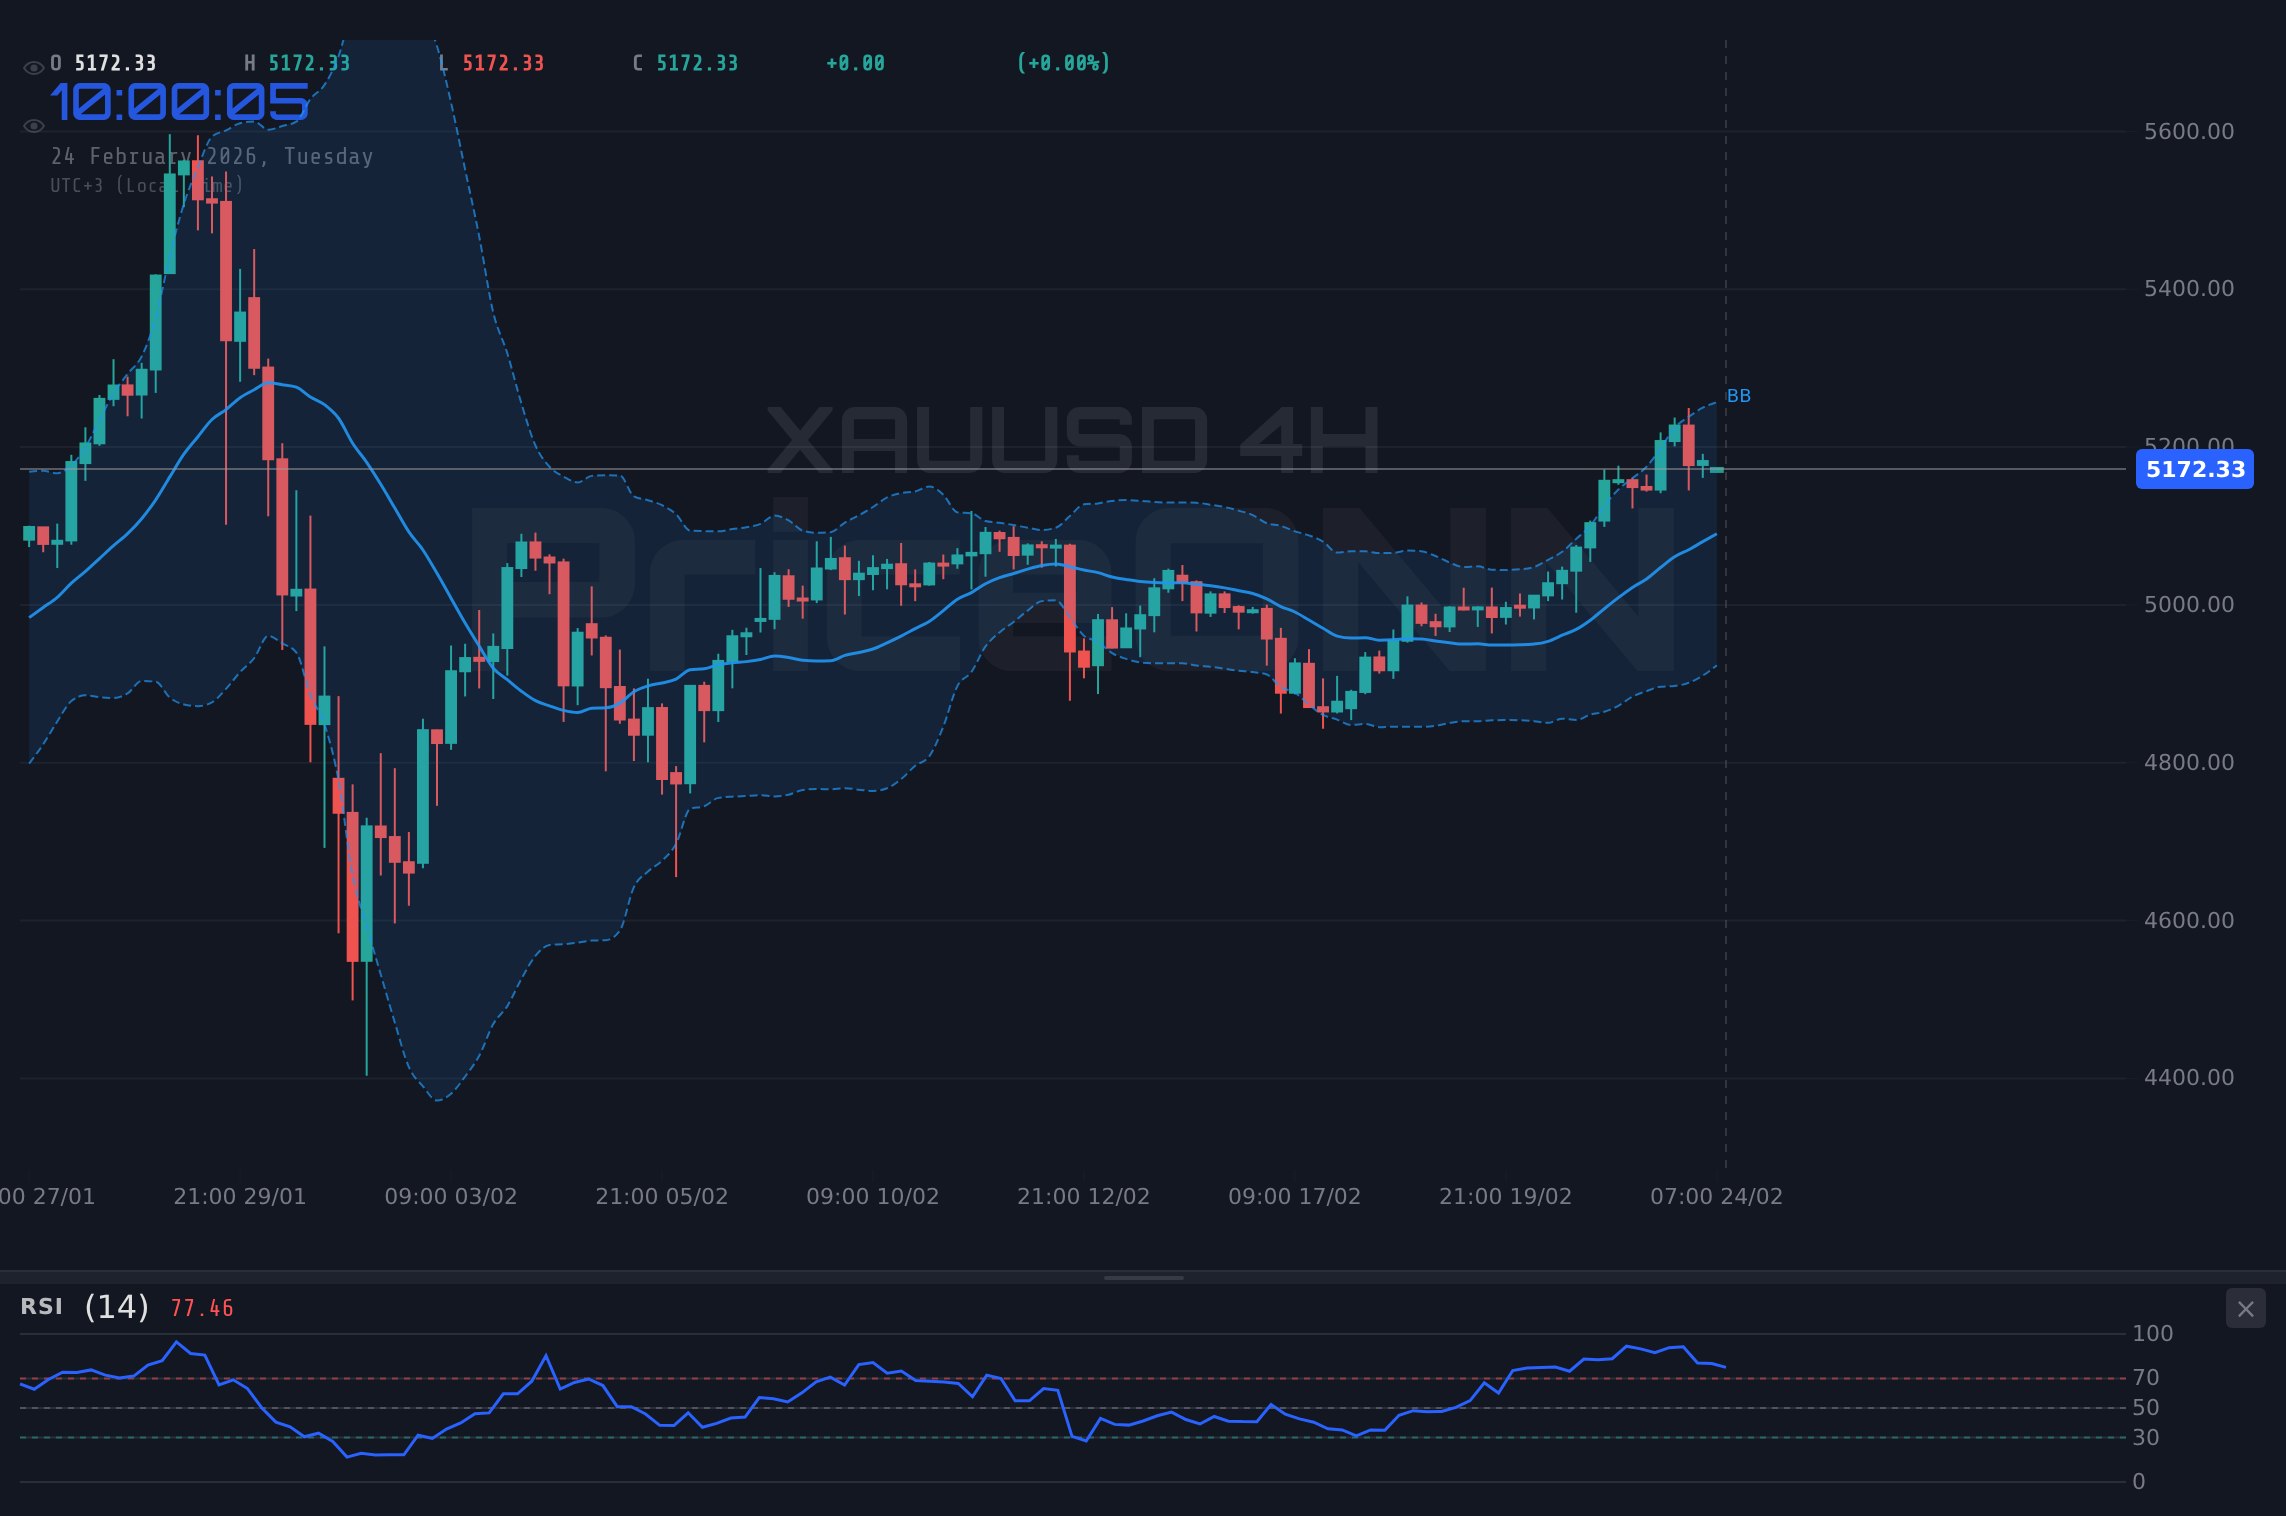
From a technical perspective, the 4-hour chart reveals a bullish trend with 99% strength, with the RSI at 65.97, suggesting that the market has room to rally before hitting overbought conditions. However, the stochastic indicator on the same timeframe is signaling a potential pullback, with %K at 76.14 and %D at 86.93. This divergence between momentum indicators suggests that the market is at an inflection point, where the bullish trend could either resume or reverse.
Why $5,161.06 is the Line in the Sand
The $5,161.06 level represents a crucial support zone for XAUUSD. As indicated by the 1H timeframe, this level has acted as a reliable floor in recent trading sessions. A decisive break below this support could trigger a cascade of sell orders, potentially pushing gold towards the next support level at $5,154.09. Conversely, if gold manages to hold above $5,161.06, it could signal renewed buying interest and a potential rebound towards the immediate resistance level at $5,174.91. The ADX on the 1H timeframe reads 30.36, indicating a strong bearish trend. However, the RSI is at 50.38, indicating that the market is neither overbought nor oversold.
The daily chart paints a slightly different picture, with the overall trend still leaning bullish. The MACD histogram shows positive momentum, and the price is trading above the 200-day moving average, suggesting that the long-term uptrend remains intact. However, the stochastic oscillator on the daily chart is in overbought territory, with %K at 90.93 and %D at 72.58, signaling a potential correction in the near term. This multi-timeframe analysis highlights the conflicting signals in the market and underscores the need for traders to exercise caution and patience.
Understanding the XAUUSD Bull and Bear Cases
The bullish scenario for XAUUSD hinges on several key factors. First, persistent inflation concerns, driven by supply chain disruptions and expansionary monetary policies, are likely to continue supporting gold's safe-haven appeal. Second, geopolitical risks, particularly the ongoing conflict in Ukraine and tensions in the Middle East, could further bolster demand for gold as a hedge against uncertainty. Finally, a dovish pivot by the Federal Reserve, if inflation data starts to cool down, could remove a significant headwind for gold prices. The XAGUSD is currently trading at 88.34, which is indicative of the precious metal market's strength.
The bearish scenario, on the other hand, is predicated on a more aggressive tightening cycle by the Federal Reserve. If the Fed raises interest rates more aggressively than expected, it could trigger a stronger dollar and a decline in gold prices. Additionally, a resolution to the geopolitical conflicts could reduce safe-haven demand for gold. Finally, a significant improvement in the global economic outlook could diminish the appeal of gold as a hedge against economic uncertainty. The DXY is currently trading at 97.49, and a continued rise in the dollar could place downward pressure on XAUUSD.
A Trader's Plan for XAUUSD
XAUUSD breaks above the immediate resistance at $5,174.91, confirming a resumption of the uptrend. This breakout could be driven by weaker-than-expected economic data, renewed geopolitical tensions, or a dovish shift in Fed policy.
XAUUSD fails to hold the support level at $5,161.06, triggering a sell-off towards the next support at $5,154.09. This breakdown could be caused by stronger-than-expected economic data, easing geopolitical tensions, or a hawkish surprise from the Fed.
The current market conditions present a mixed bag of signals. The bullish trend on the daily chart suggests that the long-term uptrend remains intact, but the overbought stochastic oscillator and the hawkish Fed rhetoric suggest that a correction is possible in the near term. Therefore, traders should exercise caution and patience, waiting for a clear signal before entering new positions.
Trading Plan: XAUUSD at $5,172.39
Given the current technical picture, a strategic approach to trading XAUUSD is warranted. A potential trade plan could be as follows:
Entry Trigger: A confirmed breakout above $5,174.91, signaling a continuation of the uptrend.
Target 1: $5,181.79, the next resistance level on the 1H chart. A successful breach of this level could pave the way for further gains.
Target 2: $5,188.76, the subsequent resistance level. This represents a more ambitious target, but it is achievable if the bullish momentum persists.
Stop/Invalidation Level: A close below $5,161.06, invalidating the bullish scenario and triggering a potential sell-off.
Upcoming Economic Events to Watch
Traders should also keep a close eye on upcoming economic events that could impact XAUUSD. The release of the latest inflation data, including the Consumer Price Index (CPI) and the Producer Price Index (PPI), will be crucial in shaping market expectations for Fed policy. Additionally, any major geopolitical developments could also trigger significant price swings in gold. Also, keep an eye on the WTI, which is currently trading at $66.89.
Risk Management is Key
As always, risk management is paramount when trading XAUUSD. Traders should carefully assess their risk tolerance and position size accordingly. It is also essential to use stop-loss orders to limit potential losses and to avoid overleveraging. The current market conditions are characterized by high volatility and uncertainty, making risk management even more critical.
Frequently Asked Questions: XAUUSD Analysis
Is XAUUSD a good buy right now?
XAUUSD is at $5,172.39. A buy could be considered on a breakout above $5,174.91, targeting $5,181.79 initially, but watch for DXY strength.
What is the XAUUSD price forecast for this week?
The XAUUSD price forecast this week is bullish if it holds above $5,161.06, potentially reaching $5,188.76. A break below $5,161.06 could see a drop to $5,154.09.
What are the key support and resistance levels for XAUUSD?
Key support for XAUUSD is at $5,161.06 and $5,154.09. Resistance is at $5,174.91 and $5,181.79, based on the 1H chart.
Why is XAUUSD moving today?
XAUUSD is moving today due to a combination of factors including DXY strength at 97.49 and fluctuating risk appetite as well as Fed policy expectations.
Technical Outlook Summary
| Indicator | Value | Signal |
|---|---|---|
| RSI (14) | 58.72 | Neutral |
| MACD Histogram | Positive | Bullish |
| Stochastic | 90.93/72.58 | Overbought |
| ADX | 18.72 | Weak Trend |
| Bollinger | Upper Band | Watch |
Key Levels
Support Levels
Resistance Levels
Track markets in real-time
AI-powered analysis, technical indicators and real-time price data.
Join Our Telegram Channel
Breaking market news, AI analysis and trading signals instantly.
Join Channel