
Nasdaq100 Hovers Near $23,886 Resistance; Is a Correction Imminent?
Nasdaq100 trades at $23,886.17 amid mixed signals. With RSI at 67 and ADX showing a strong trend, traders eye resistance levels for potential reversal points.
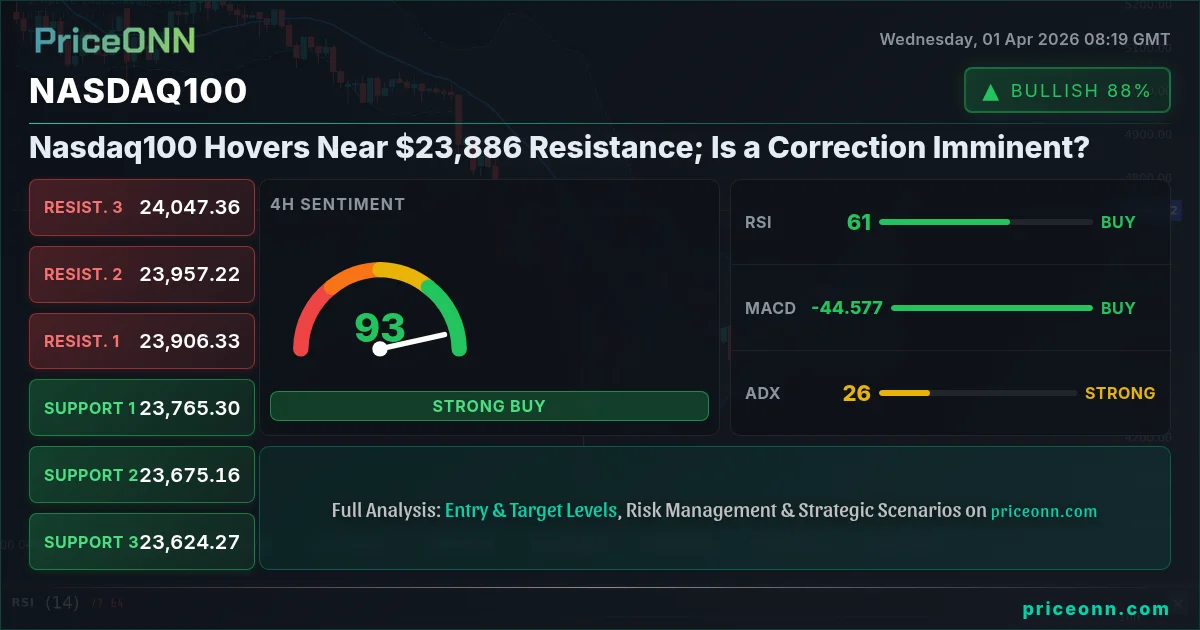
The Nasdaq100 index currently sits at a critical juncture, trading at $23,886.17. This level represents a significant point where the bulls have pushed the market higher, but the bears are beginning to show signs of life. With the daily chart showing a dominant downtrend despite shorter-term bullish momentum, the question on every trader's mind is whether this current price action is a precursor to a deeper correction or merely a pause before the ascent continues. The interplay between strong intraday technical signals and a weaker daily outlook creates a complex trading environment that demands careful analysis of both fundamental drivers and technical price action.
- The Nasdaq100 is trading at $23,886.17, approaching a key resistance zone.
- RSI at 67 on the 1-hour chart signals upward momentum, but the 1D RSI at 44.41 indicates underlying weakness.
- ADX at 47.7 on the 1H and 47.25 on the 1D suggests strong trend strength, but the directionality is conflicting across timeframes.
- Upcoming economic data releases and Fed policy expectations will be crucial in determining the next directional move for the index.
The technical landscape for the Nasdaq100 is a study in contrasts, painting a picture of conflicting signals across different timeframes. On the shorter timeframes, such as the 1-hour and 4-hour charts, the narrative is decidedly bullish. The 1-hour trend is firmly established as UP with a power score of 100%, supported by positive MACD momentum and Stochastic signals indicating further upside potential. The RSI(14) at 67.06, while in neutral territory, leans towards continued upward movement. This short-term strength is reflected in the overall signal of BUY (7 Buy, 1 Sell). However, this optimism is tempered significantly when we zoom out to the daily perspective. The 1D trend is classified as DOWN with a power score of 100%, and the overall signal leans SELL (2 Buy, 5 Sell). This divergence highlights the importance of multi-timeframe analysis; while short-term traders might find opportunities on the buy-side, the longer-term trend suggests caution and a potential for a reversal or continuation of the bearish trend.
The Bull's Roadmap: Navigating Towards New Highs
For the bulls to regain sustained control of the Nasdaq100, several technical and fundamental conditions must align. The immediate hurdle is the resistance zone around the current price of $23,886.17. A decisive break and sustained hold above the 1-hour resistance at $24,036.58, and more importantly, above the 4-hour resistance at $23,957.22, would be the first sign of bullish conviction. This would likely require strong buying volume and positive sentiment to overcome the selling pressure typically seen at these levels. If this breakout occurs, the next target would be the 4-hour resistance at $24,047.36, followed by the longer-term daily resistance at $24,080.66. Achieving these levels would signal a potential shift in momentum, invalidating the immediate bearish outlook on the daily chart.
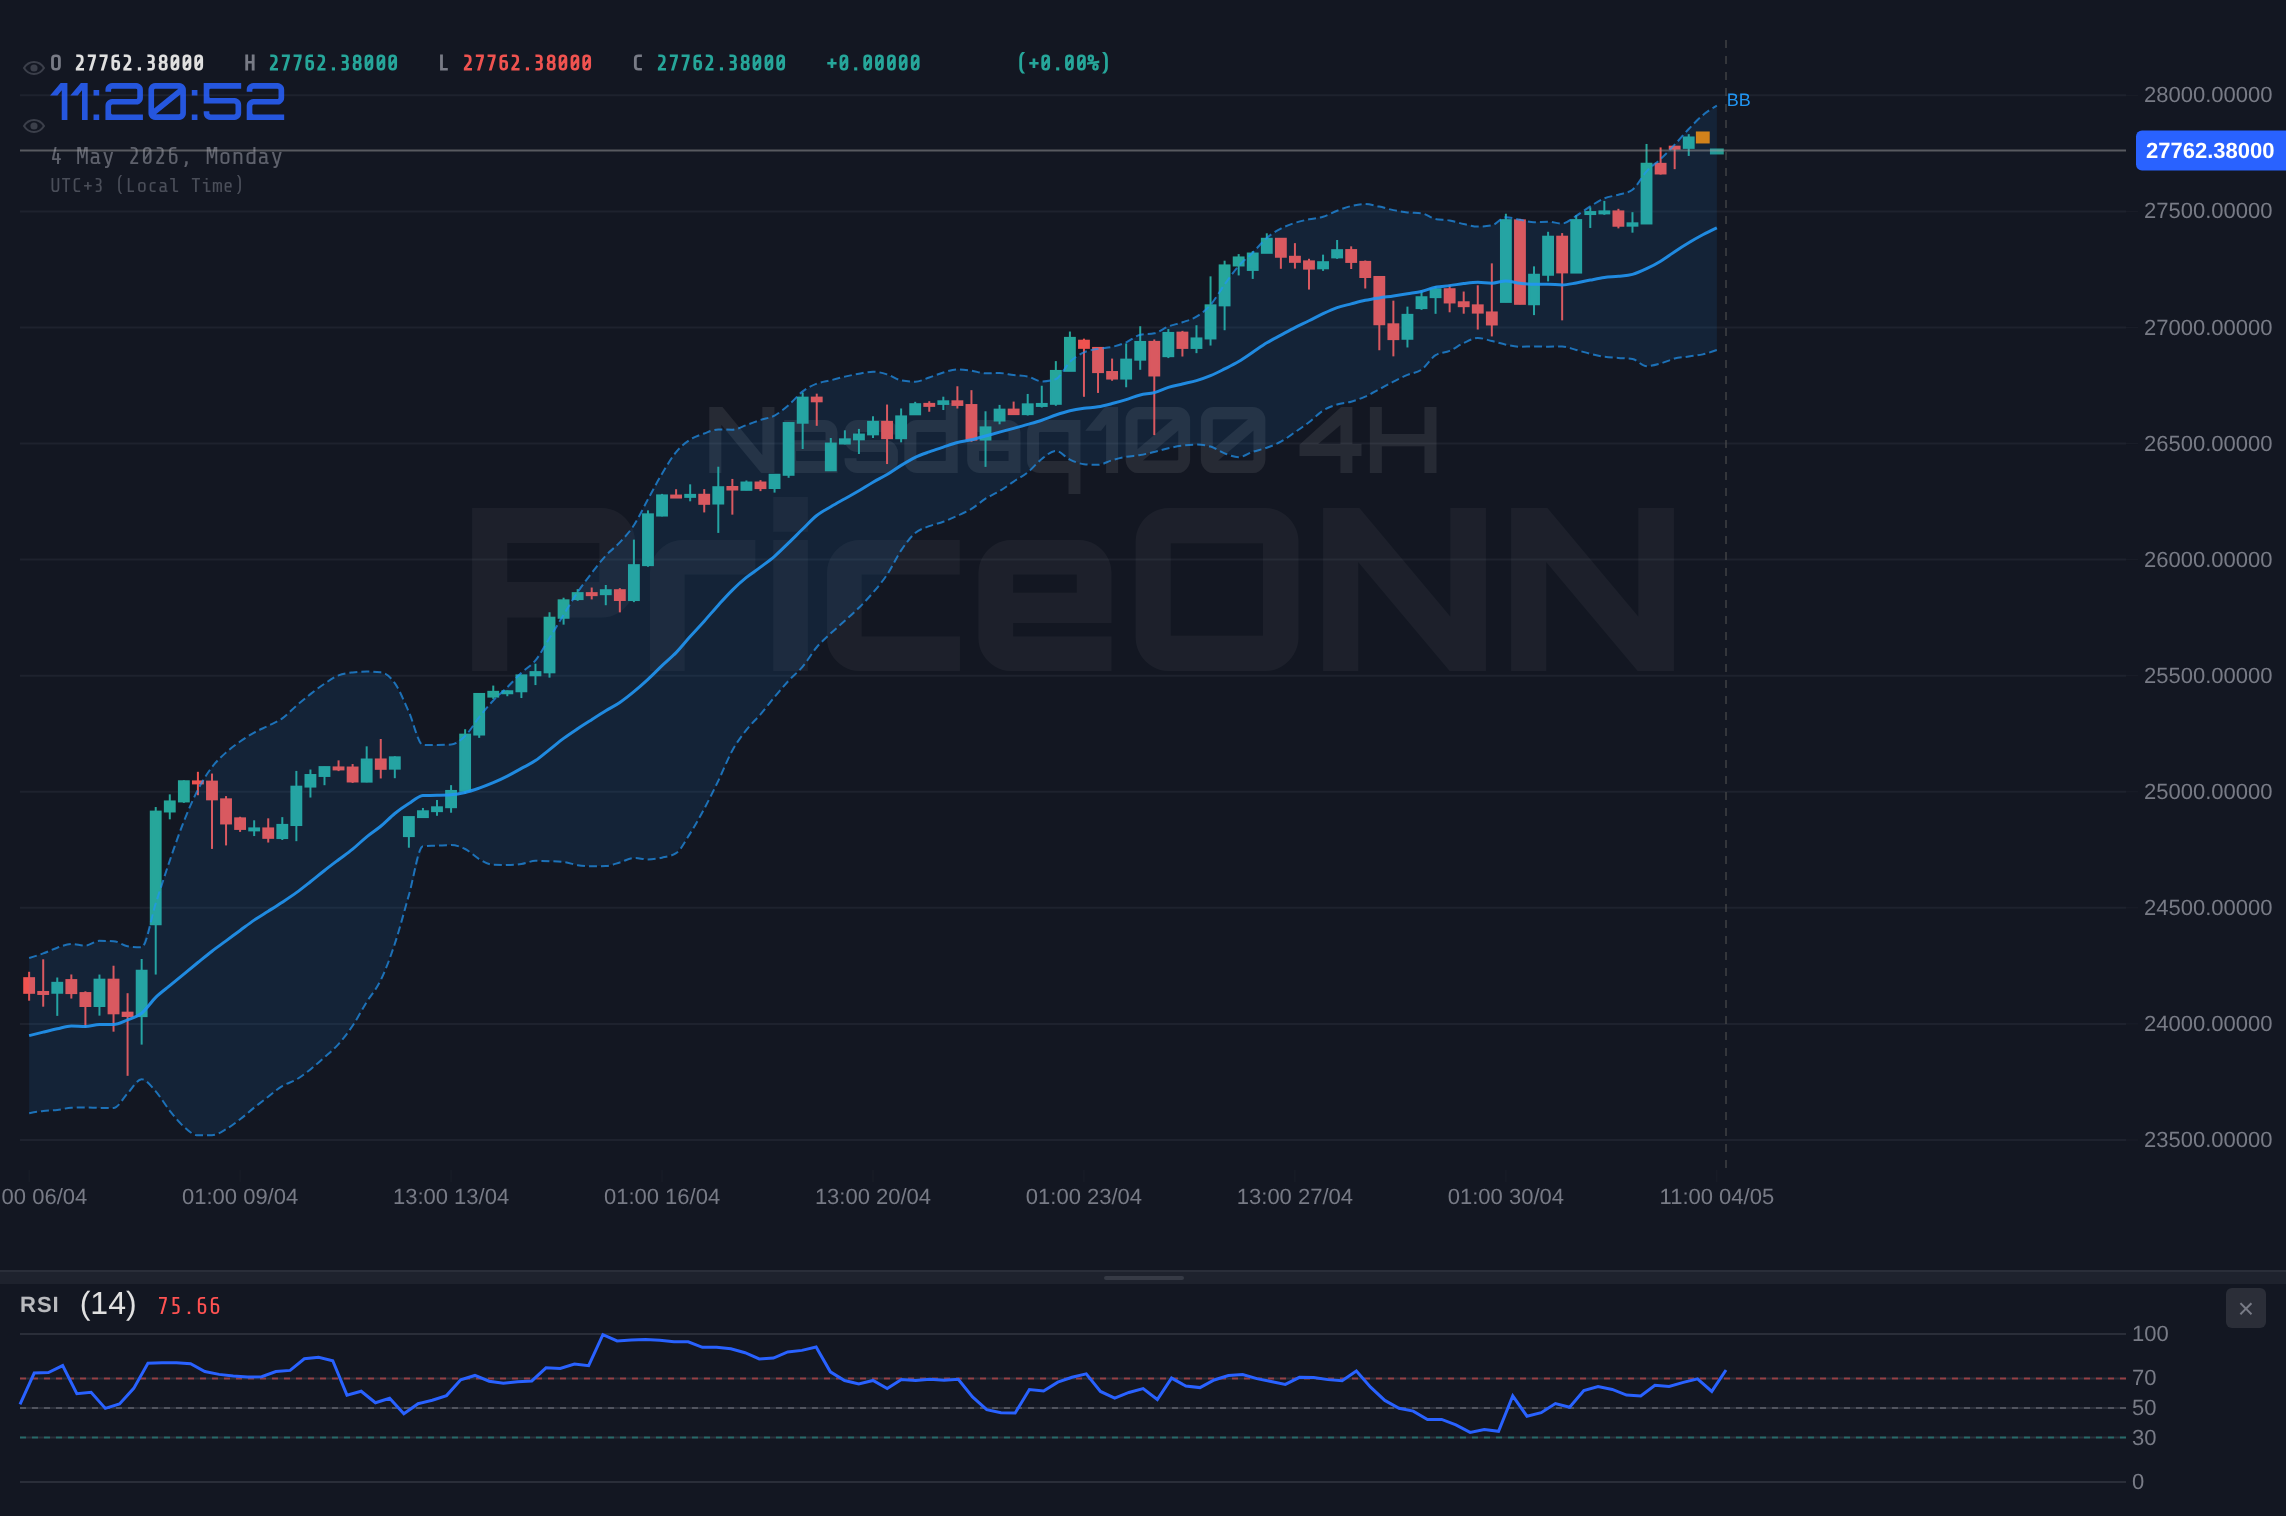
Fundamentally, a bullish scenario would be bolstered by dovish signals from the Federal Reserve, unexpected positive economic data from the US, or a significant easing of geopolitical tensions. For instance, if upcoming inflation data (CPI or PCE) comes in lower than expected, it could reduce the pressure on the Fed to maintain a hawkish stance, potentially leading to a risk-on rally across equity markets. Similarly, positive employment figures that suggest a strong economy without overheating could also fuel a rally. The correlation with the DXY (Dollar Index) also plays a role; a weakening dollar, currently at 99.34 and showing a 1H and 4H downtrend, can often coincide with strength in US equities, providing a tailwind for the Nasdaq100.
The ADX indicator adds another layer to this analysis. On the 1-hour chart, the ADX stands at 47.7, indicating a strong trend, and on the daily chart, it's at 47.25, also suggesting a strong trend. While a high ADX typically signals a trending market, the conflicting signals between the intraday and daily timeframes mean this strong trend could push prices higher or be the precursor to a sharp reversal if the trend fails. For the bulls, a sustained push above the daily resistance level of $24,080.66 would be crucial confirmation. If this level is breached, the next significant upside target would be the daily resistance at $24,437.53, a move that would signify a substantial shift in market sentiment and technical structure. However, such a move would likely require a significant catalyst.
Where Bears Take Control: The Case for a Deeper Downturn
The bearish thesis for the Nasdaq100 gains traction when examining the daily chart's persistent downtrend and the conflicting signals from shorter timeframes. The immediate price action at $23,886.17 is key. A failure to decisively break above the 1-hour resistance at $24,036.58, coupled with a breakdown below the 1-hour support at $23,899.34, would be the first indication that the bulls are losing their grip. This could lead to a test of the 4-hour support level at $23,765.3. If this level gives way, the next significant downside target would be the daily support at $23,075.16. A close below this level would strongly confirm the bearish outlook and potentially open the door for further declines towards the daily support at $22,426.53.
The daily RSI at 44.41, while not yet in oversold territory, clearly shows a downward bias, and the MACD on the daily chart is below its signal line with negative momentum. This suggests that underlying selling pressure remains dominant. A hawkish turn from the Federal Reserve, perhaps signaled by stronger-than-expected inflation or employment data, could quickly shift market sentiment against risk assets like the Nasdaq100. For example, if the upcoming US economic calendar reveals inflation figures (like CPI or PCE) that are significantly higher than forecasts, it would likely reinforce expectations of prolonged higher interest rates, thereby pressuring growth-sensitive tech stocks.
The current price of Brent crude at $104.72 and WTI at $98.80, both showing significant daily declines, might initially seem supportive by easing inflation concerns. However, if these declines are driven by recession fears rather than easing supply constraints, they could still be bearish for equities. The geopolitical context, including ongoing Middle East tensions and their impact on oil prices, remains a critical factor. Any escalation could reignite inflation fears and increase safe-haven demand, potentially impacting the Nasdaq100 negatively. A sustained drop below the key daily support level of $23,075.16 would invalidate any short-term bullish arguments and confirm the bears' objective of pushing the index lower.
The Waiting Game: Caught in the Range
A neutral scenario for the Nasdaq100, where it consolidates between defined support and resistance levels, is also a distinct possibility given the conflicting signals. In this range-bound environment, the index would likely struggle to break decisively above the 4-hour resistance of $23,957.22 while simultaneously finding buyers near the 1-hour support of $23,899.34. This would create a choppy trading pattern, characterized by sharp but short-lived moves in either direction, often driven by intraday news flow or minor shifts in market sentiment.
The ADX values across different timeframes (47.7 on 1H, 24.32 on 4H, 47.25 on 1D) are particularly telling here. The strong ADX on the hourly and daily charts suggests trending conditions, but the weaker ADX on the 4-hour chart indicates a lack of sustained directional conviction over that intermediate period. This can lead to periods of indecision and consolidation. For a range-bound scenario to persist, key economic data releases would likely need to be mixed or come in exactly as forecast, providing no clear impetus for a directional move. For instance, if the upcoming US Non-Farm Payrolls (NFP) report shows job growth that is neither significantly above nor below expectations, it might lead to a period of sideways trading.
In such a scenario, traders would focus on the boundaries of the established range. Support would be found around the $23,765.3 level (4-hour support), and resistance would cap gains near $23,957.22 (4-hour resistance). Volatility might increase around these levels as traders test the boundaries, leading to potential 'stop hunts' before the price retreats. The Stochastic indicator, which is showing overbought conditions on the 4-hour chart (K=97.81, D=80.51) and rising on the 1-hour chart (K=77.78, D=82.55 - a slight bearish cross), could contribute to this chop, signaling potential reversals at the extremes of the range.
The Most Likely Path Forward: A Data-Driven Verdict
Considering the current technical picture, the most likely scenario for the Nasdaq100 in the short to medium term appears to be a bearish continuation, albeit with potential for intraday volatility. The persistent downtrend on the daily chart, supported by a daily RSI of 44.41 and negative MACD momentum, carries more weight than the intraday bullish signals. The strong ADX readings across timeframes suggest that when a trend does establish, it will be significant. The conflicting signals indicate a market at a crossroads, but the long-term bearish structure suggests that upside attempts are more likely to be faded into resistance.
My probability assessment leans towards the bearish scenario having the highest likelihood, estimated at around 60%. The neutral, range-bound scenario follows at approximately 30%, offering a possibility for consolidation before a directional move. The bullish scenario, while technically possible if key resistance levels are breached with conviction, currently holds the lowest probability at about 10%. This is primarily due to the lack of strong fundamental catalysts that would fundamentally alter the current bearish macroeconomic environment, which is characterized by sticky inflation and the potential for prolonged higher interest rates.
The critical factor will be how the market digests upcoming economic data. If inflation remains stubbornly high or employment figures continue to show resilience, it will likely reinforce the Federal Reserve's hawkish stance, putting further pressure on growth stocks. Conversely, any signs of significant economic weakening or unexpected dovish commentary from Fed officials could shift the balance. For now, the technical evidence on the daily chart, coupled with the prevailing macroeconomic concerns, points towards caution and a higher probability of further downside pressure.
What I'm Watching This Week: Key Triggers for Nasdaq100
The coming days will be crucial for the Nasdaq100, with several key technical and fundamental triggers to monitor closely. Firstly, the immediate price action around the $23,886.17 level and the 1-hour resistance at $24,036.58 is paramount. A decisive failure to break higher here could confirm the bearish outlook. Secondly, traders must pay close attention to the economic calendar. Upcoming high-impact events for the USD, such as inflation reports (CPI/PCE) and employment data (NFP), will provide critical insights into the Fed's likely policy path. Any deviation from expectations could trigger significant market moves.
Thirdly, the strength of the US Dollar Index (DXY) will be a key indicator to watch. While currently showing weakness on shorter timeframes, a sustained recovery in the DXY could add pressure to the Nasdaq100. Finally, the price action around the daily support level of $23,075.16 will be a major determinant of the medium-term trend. A break below this level would significantly increase the probability of the bearish scenario playing out, targeting further downside. Conversely, a strong bounce from this level, supported by positive fundamental news, could signal a potential bottoming process.
Frequently Asked Questions: Nasdaq100 Analysis
What happens if Nasdaq100 breaks above $24,080.66 resistance?
If the Nasdaq100 closes decisively above the daily resistance at $24,080.66, it would invalidate the immediate bearish outlook. This would likely trigger a short-covering rally, potentially targeting the next resistance level at $24,437.53, signaling a shift towards a more bullish sentiment.
Is RSI at 67 a sell signal for Nasdaq100 right now?
An RSI reading of 67 on the 1-hour chart is in neutral territory, leaning towards bullish momentum, not an immediate sell signal. However, on the daily chart, the RSI at 44.41 indicates downward pressure. A confluence of a daily RSI below 50 and a strong bearish signal on other indicators would be needed to confirm a sell. Patience is key.
How will upcoming US economic data affect Nasdaq100 this week?
Stronger-than-expected US inflation or employment data could lead the Fed to maintain a hawkish stance, pressuring the Nasdaq100. Conversely, weaker data might prompt dovish expectations, potentially boosting the index. Traders should monitor CPI, PCE, and NFP reports closely for directional clues.
Should I buy Nasdaq100 at current levels of $23,886.17?
Buying at $23,886.17 carries significant risk due to the proximity of daily downtrend resistance and conflicting technical signals. A more prudent approach would be to wait for confirmation of a breakout above key resistance levels like $24,080.66 or a clear bounce from a significant support level like $23,075.16, ideally with supportive fundamental news.
Bearish Scenario: The Correction Deepens
60% ProbabilityNeutral Scenario: Range-Bound Consolidation
30% ProbabilityBullish Scenario: Resuming the Uptrend
10% ProbabilityTrack markets in real-time
AI-powered analysis, technical indicators and real-time price data.
Join Our Telegram Channel
Breaking market news, AI analysis and trading signals instantly.
Join Channel