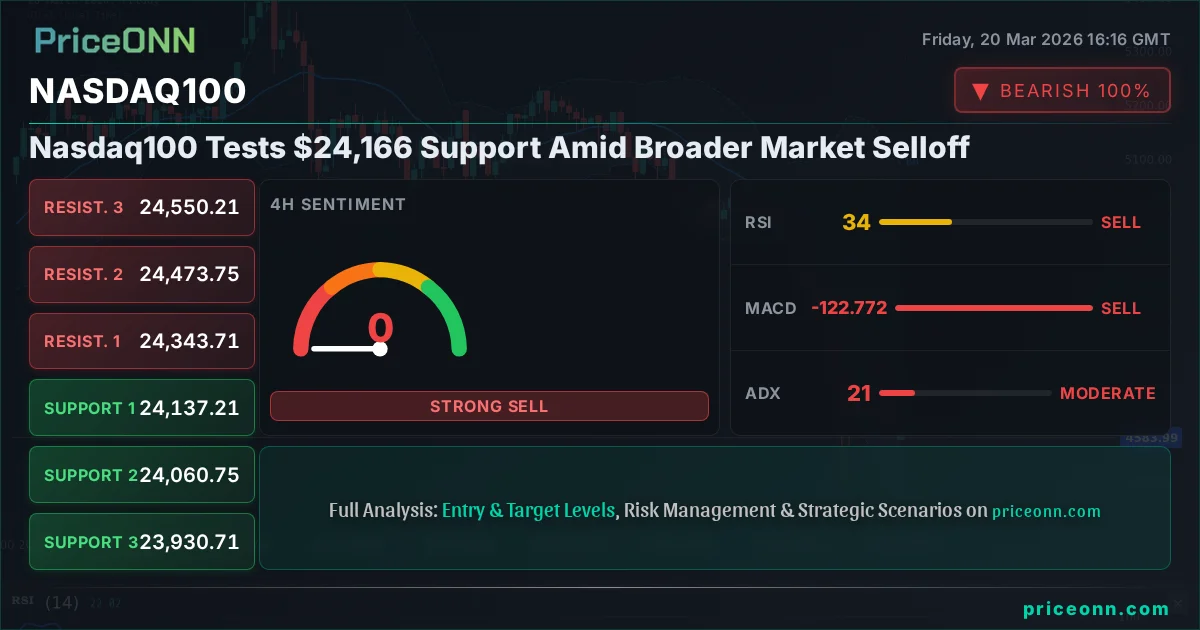
Nasdaq100 Tests $24,166 Support Amid Broader Market Selloff
Nasdaq100 faces pressure near $24,166 support as DXY rises and risk appetite wanes. Key indicators suggest caution, but a bounce is possible if key levels hold.
The Nasdaq100 is currently navigating a critical juncture, testing support levels around $24,166 as broader market sentiment shifts towards risk aversion. This pullback, occurring amidst a strengthening Dollar Index (DXY) and a notable decline in major equity benchmarks like the S&P 500 and Dow Jones Industrial Average, warrants a close examination of the underlying technical and fundamental drivers. While the immediate picture suggests continued downward pressure, the confluence of technical signals and potential market flows presents a complex landscape for traders and investors.
- RSI at 36.88 signals bearish momentum, but the ADX at 32.36 indicates a strong trend is already in place.
- Critical support sits at $24,014.88, tested multiple times this week, with a break below risking further downside.
- MACD histogram shows negative momentum, aligning with the downward trend as price hovers below the middle Bollinger Band.
- Fed rate expectations are influencing the Nasdaq100's correlation with DXY; a stronger dollar continues to weigh on tech valuations.
Navigating the Downturn: Nasdaq100's Current Stance
The Nasdaq100, a bellwether for growth-oriented technology stocks, is currently trading at $24,120.31, showing a daily decline of 1.12%. This move isn't happening in a vacuum. The broader market is experiencing a palpable shift in risk sentiment. The S&P 500 has fallen 0.86% to $6,559.30, and the Dow Jones Industrial Average is down 0.58% at $45,816.50. This correlated weakness across major US indices underscores a general move away from riskier assets. The accompanying rise in the Dollar Index (DXY) to $99.38, up 0.47%, further reinforces this narrative, as a stronger dollar typically exerts downward pressure on global equities, particularly those with significant international earnings exposure.
The technical indicators on the 1-hour chart for the Nasdaq100 paint a picture of prevailing bearish momentum. The Relative Strength Index (RSI) at 36.88 is firmly in neutral territory but trending downwards, suggesting that sellers are gaining traction. The Moving Average Convergence Divergence (MACD) histogram is negative, indicating bearish momentum, and the price is trading below the middle Bollinger Band, which itself is sloping downwards. This confluence of indicators points to a market environment where short-term downside remains a distinct possibility. The Average Directional Index (ADX) at 32.36 further supports this, signifying a strong trend, which in this case, is a downtrend.
The Role of the Dollar Index (DXY) and Risk Sentiment
The Dollar Index (DXY) is currently at $99.38, exhibiting a notable daily gain of 0.47%. This strengthening dollar is a significant factor influencing global markets, including the Nasdaq100. Historically, a rising DXY often correlates with pressure on equity markets, especially growth stocks, as it makes dollar-denominated assets more expensive for foreign investors and can signal tighter global liquidity conditions or a flight to safety. The current market environment, characterized by a dip in major stock indices, aligns with this inverse correlation. Traders are closely watching the DXY's ability to sustain its upward momentum, as a continued rise could exacerbate the selling pressure on the Nasdaq100.
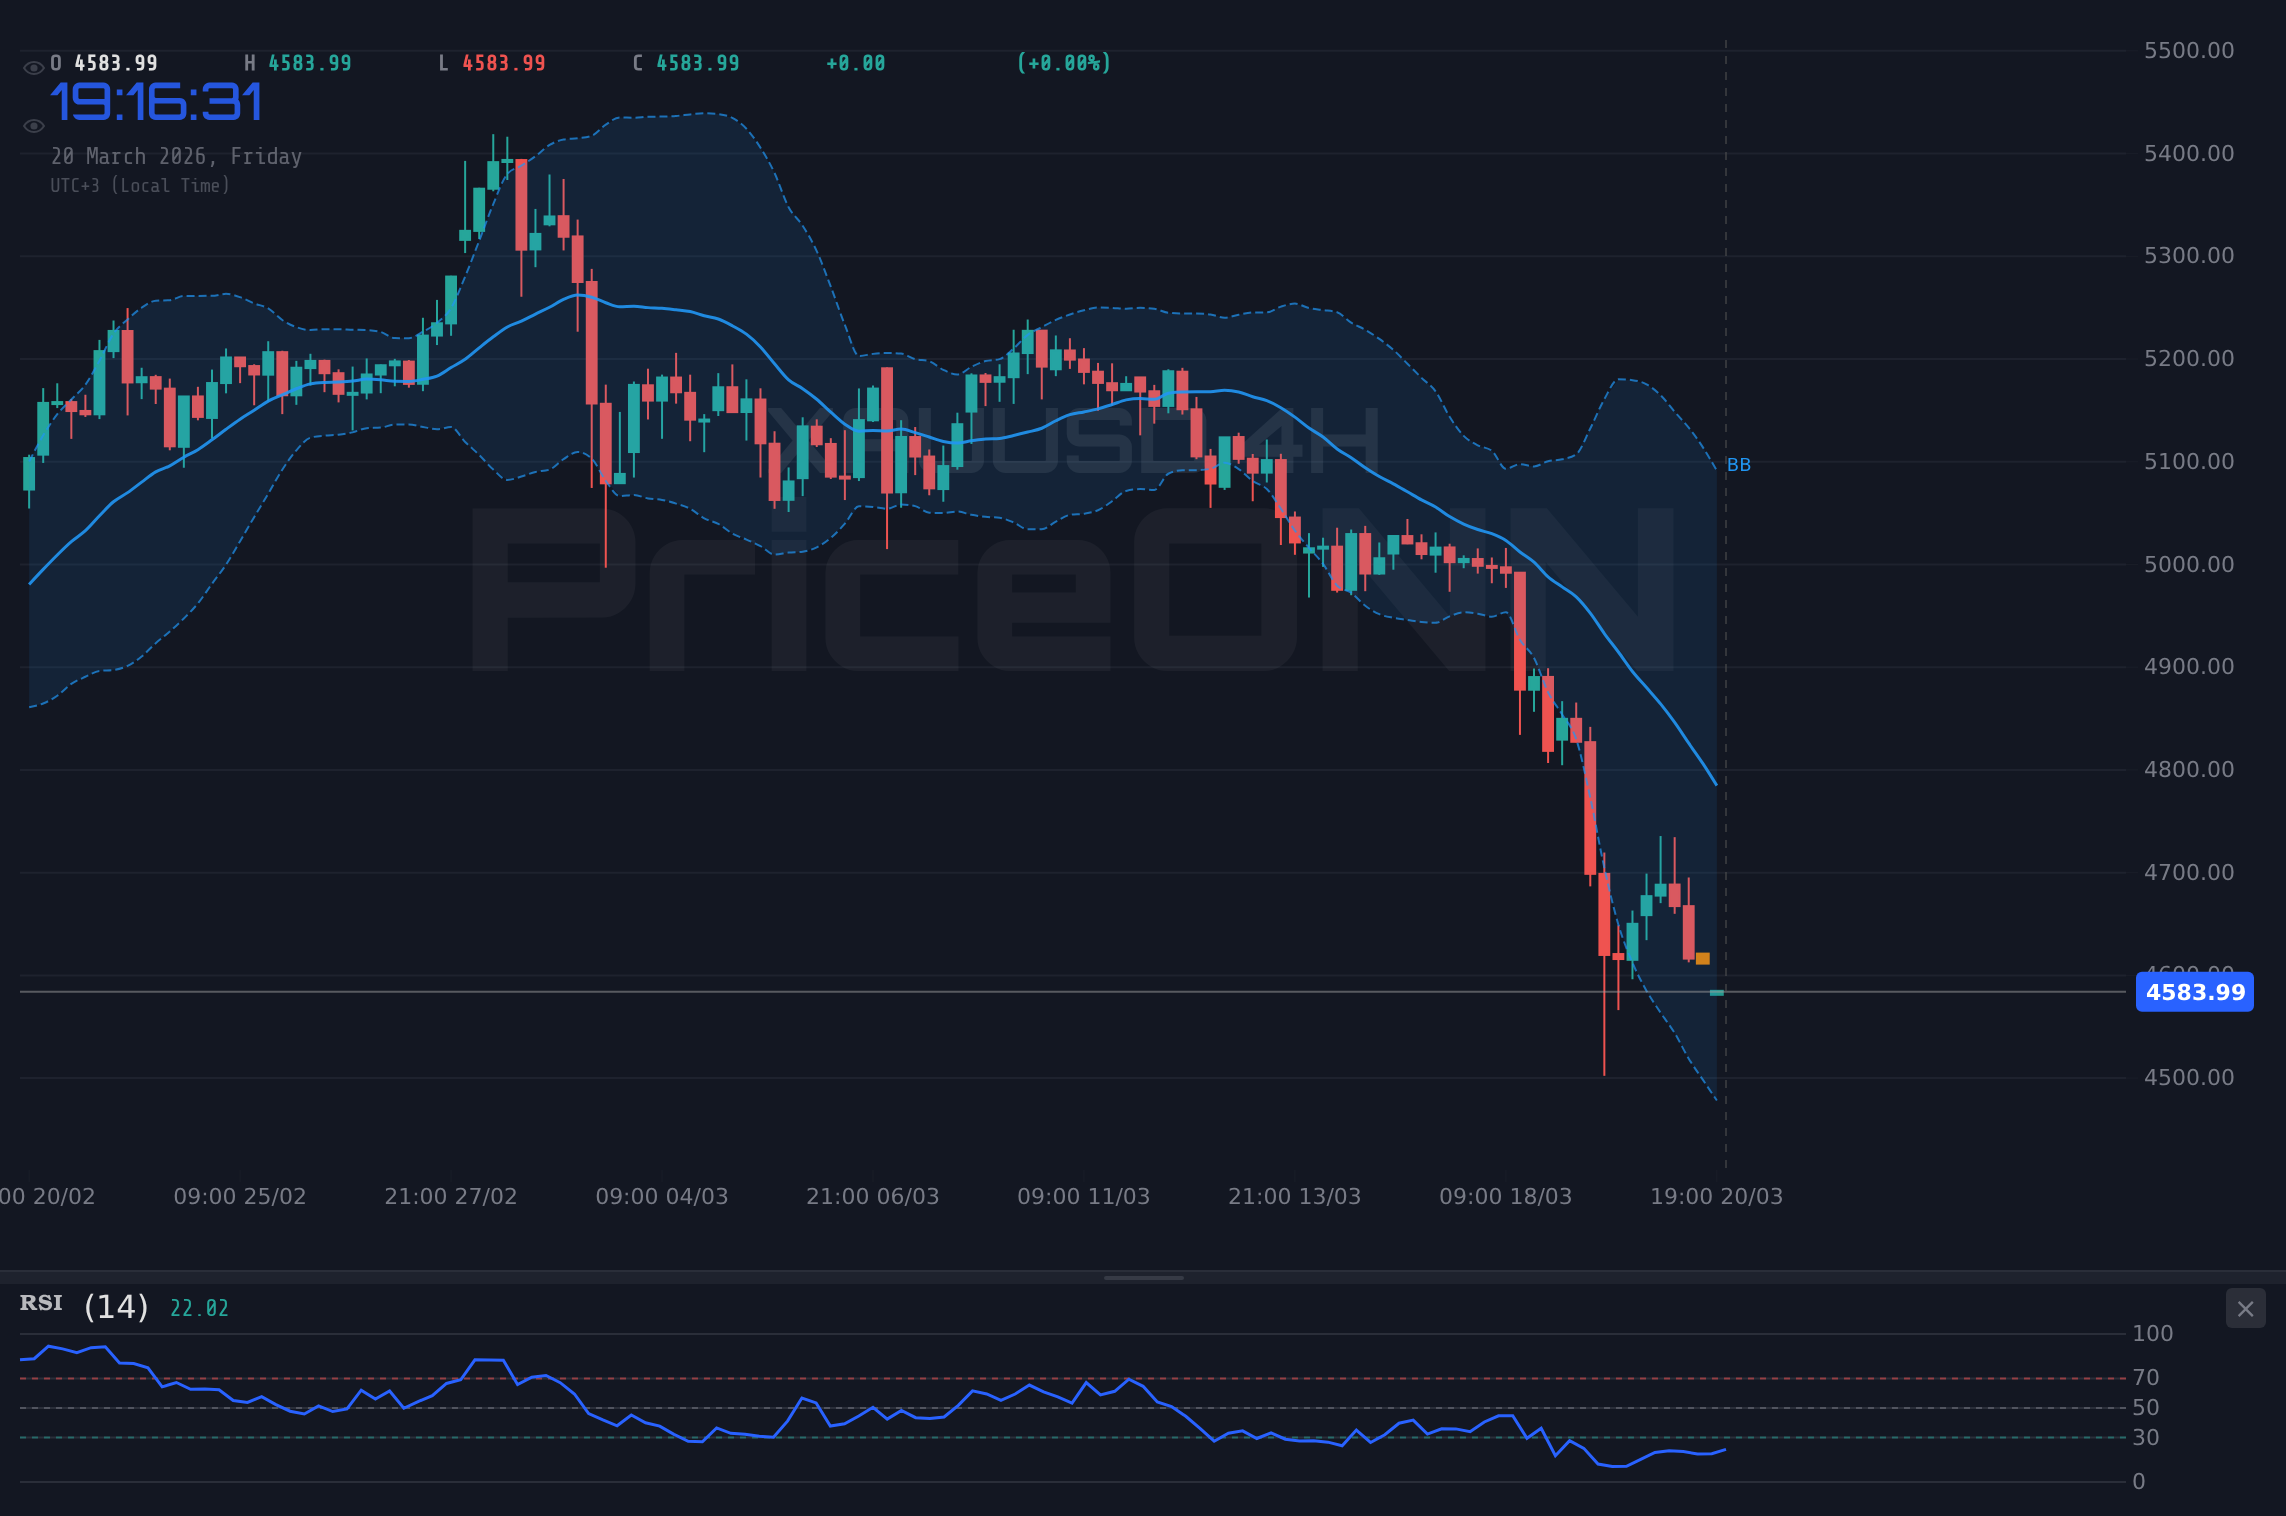
The prevailing risk-off sentiment is also evident in other markets. Gold, typically a safe-haven asset, is showing weakness, trading down 1.42% at $4,584. This might seem counterintuitive in a risk-off environment, but it could indicate that the current market rotation is not a traditional flight to safety but rather a broader deleveraging or a specific sector rotation driven by other macro factors, such as expectations around interest rates or inflation. The simultaneous decline in both equities and gold suggests a complex interplay of forces, possibly indicating that liquidity is being pulled from multiple asset classes.
Delving Deeper: 4-Hour and Daily Technical Insights
Shifting to the 4-hour timeframe for the Nasdaq100, the trend is firmly identified as bearish with a strength of 85%. The support levels are noted at $24,137.21, $24,060.75, and $24,014.88. The resistance levels are situated at $24,343.71, $24,473.75, and $24,550.21. The RSI here is at 34.66, still in neutral territory but leaning towards oversold conditions, suggesting that the selling pressure might be nearing exhaustion on this timeframe. However, the MACD remains negative, and the price is below the middle Bollinger Band, continuing the bearish narrative. The ADX at 23.45 indicates a moderate downtrend, less aggressive than the 1-hour chart but still significant.
On the daily chart, the picture is even more bearish, with the trend strength at 100%. The key support levels are identified at $24,166.02, $24,014.88 (a critical level that has been tested and held historically, but is now under significant threat), $23,938.38, and further down at $23,770.36. Resistance is seen at $24,561.68, $24,660.23, and $24,729.70. The daily RSI at 33.61 is approaching oversold territory, which could signal a potential for a bounce, but the MACD histogram remains negative, and the price is trading below the middle Bollinger Band, suggesting that the downtrend is firmly in place. The ADX at 44.31 confirms a strong downtrend on this longer timeframe. This daily analysis indicates that while short-term oversold conditions might be developing, the overarching trend remains bearish, and any rallies could face significant selling pressure.
The Influence of Economic Calendar Events and Policy Expectations
The market's current behavior is undoubtedly influenced by expectations surrounding central bank policies, particularly the US Federal Reserve. While specific upcoming economic calendar events relevant to the Nasdaq100 are not detailed in the provided data, the general sentiment around interest rates and inflation remains a primary driver. Traders are constantly assessing the Fed's stance on inflation and its potential path for monetary policy. Any hints of a more hawkish stance - suggesting prolonged higher rates or potential further tightening - could continue to weigh on growth stocks like those in the Nasdaq100, which are sensitive to borrowing costs and discount rates. Conversely, signs of inflation cooling or a more dovish pivot could spark a significant rebound.
The current correlation with the DXY is a key indicator of this policy sensitivity. As the dollar strengthens, it often implies that market participants are pricing in policies that are more restrictive or a US economy that is perceived as more resilient than others. This dynamic can create a headwind for Nasdaq100 valuations, especially when tech companies derive a substantial portion of their revenue from international markets. The interplay between Fed policy expectations, inflation data, and the resulting dollar strength will be crucial in determining whether the Nasdaq100 can find a stable footing or if further downside is inevitable.
Intermarket Correlations: Beyond the Nasdaq100 Chart
Examining intermarket correlations provides a more holistic view of the forces shaping the Nasdaq100's price action. The DXY's rise to $99.38 is a significant factor. When the dollar strengthens, it generally leads to a decrease in demand for commodities like gold (currently at $4,584, down 1.42%) and can put pressure on currency pairs like EURUSD (trading at 1.15575, down 0.2%) and GBPUSD (trading at 1.33218, down 0.75%). This broad-based dollar strength suggests a potential global liquidity squeeze or a perceived increase in US economic outperformance relative to other major economies. For the Nasdaq100, this often translates into lower valuations, particularly for companies with significant overseas sales.
The performance of other equity indices also paints a cautionary picture. The S&P 500's fall to $6,559.30 and the Dow Jones' dip to $45,816.50 indicate a generalized risk-off sentiment. The Nasdaq100, being heavily weighted towards technology and growth stocks, is often more sensitive to shifts in risk appetite than broader indices. This means that any sustained period of market fear or uncertainty is likely to hit the Nasdaq100 harder. The fact that even traditionally safe-haven assets like gold are showing weakness in this environment adds another layer of complexity, suggesting that the current market dynamics might be driven by factors beyond simple risk-on/risk-off sentiment, possibly related to forced selling or liquidity constraints.
Geopolitical Factors and Their Shadow
While specific geopolitical catalysts aren't highlighted in the immediate market data, the underlying global tensions remain a constant backdrop. Events such as supply chain disruptions, ongoing geopolitical conflicts, and shifts in international trade relations can significantly impact market sentiment and, consequently, the Nasdaq100. For instance, news regarding oil prices, with WTI at $97.63 and Brent at $110.01, both showing upward movement, can signal inflationary pressures. Persistent high energy costs can dampen consumer spending and corporate profit margins, indirectly affecting the tech sector. Similarly, any escalation of trade tensions or unexpected geopolitical flare-ups could trigger a sharper selloff in equities as investors seek safer havens, potentially benefiting assets like the DXY or US Treasuries, while pressuring growth-oriented indices.
The recent news highlights some of these interconnected risks. Reports of a potential disruption at the Strait of Hormuz, while not directly tied to Nasdaq100's immediate price action, underscore the fragility of global energy markets and the potential for inflation spikes. Such events can force central banks into difficult policy decisions, which in turn impact equity markets. The ongoing global mining push by China, as reported, also hints at shifts in commodity supply chains that could have ripple effects across various sectors, including the technology industry which relies on specific minerals for its products. These macro-level factors, though not always immediately reflected in daily price swings, form the underlying currents that can drive significant market movements.
Trading Scenarios and Risk Management
Given the current technical setup and market context, several scenarios are plausible for the Nasdaq100. The immediate focus remains on the support level around $24,166.02. A decisive break below this level, particularly on increased volume and confirmed by other indicators, would likely trigger further selling pressure. Conversely, if the index can hold above this critical support, a short-term bounce might ensue, especially if risk sentiment improves or if the DXY retraces some of its gains.
The ADX on the daily chart at 44.31 indicates a strong downtrend. This suggests that any rallies might be met with renewed selling interest, and a sustained upward move would require a significant shift in market dynamics or a clear break of key resistance levels. The RSI on the daily chart is approaching oversold territory (33.61), which historically can precede a technical bounce. However, the strength of the current downtrend suggests that such a bounce might be short-lived unless accompanied by a fundamental catalyst or a clear reversal in broader market sentiment.
Bearish Scenario: Downside Momentum Continues
65% ProbabilityNeutral Scenario: Consolidation Around Support
25% ProbabilityBullish Scenario: Bounce from Support
10% ProbabilityThe Path Forward: Actionable Insights for Traders
The current market environment for the Nasdaq100 is one of heightened caution. The confluence of a strengthening dollar, risk-off sentiment across equities, and bearish technical signals suggests that the path of least resistance may still be to the downside. Traders should pay close attention to the $24,014.88 level on the 4-hour chart. A decisive break below this point could accelerate selling pressure, targeting lower support levels. Conversely, any sustained hold above $24,166.02, especially if accompanied by a reversal in the DXY or an improvement in risk appetite, could offer a short-term trading opportunity for a bounce.
Given the strong downtrend indicated by the ADX (44.31 on daily, 32.36 on 1H), aggressive long positions are not recommended without clear confirmation of a trend reversal or at least a significant shift in momentum. The RSI approaching oversold territory on the daily chart (33.61) presents a potential for a technical rebound, but this must be confirmed by bullish divergences or a clear break of immediate resistance levels. For now, managing risk is paramount. Traders should consider tighter stop-losses and potentially smaller position sizes until the market provides a clearer direction. The market is currently pricing in a degree of caution, and until key levels are decisively broken or reclaimed, volatility is likely to remain elevated.
Frequently Asked Questions: Nasdaq100 Analysis
What happens if the Nasdaq100 breaks below the $24,014.88 support level?
A break below $24,014.88 on the 4-hour chart would invalidate the current support and likely trigger further selling pressure. This could accelerate the downtrend, targeting the next significant support at $23,938.38.
Should I consider buying the Nasdaq100 at current levels around $24,120.31 given the oversold RSI?
While the daily RSI at 33.61 is approaching oversold territory, the strong bearish trend (ADX 44.31) suggests caution. Buying at current levels is speculative; a confirmed bounce above immediate resistance at $24,343.71, or a clear reversal pattern, would be a more prudent entry trigger.
Is the RSI at 36.88 on the 1-hour chart a bearish signal for the Nasdaq100?
An RSI of 36.88 is in neutral territory but trending downwards, indicating bearish momentum is present on the short-term timeframe. While not yet oversold, it aligns with the prevailing downtrend and suggests that upside potential may be limited in the immediate term.
How will the rising DXY at $99.38 affect the Nasdaq100's performance this week?
The strengthening DXY at $99.38 typically exerts downward pressure on growth stocks like the Nasdaq100, as it makes US assets more expensive for international investors and can signal tighter liquidity. Continued dollar strength could exacerbate the current pullback in the Nasdaq100.
Track markets in real-time
AI-powered analysis, technical indicators and real-time price data.
Join Our Telegram Channel
Breaking market news, AI analysis and trading signals instantly.
Join Channel