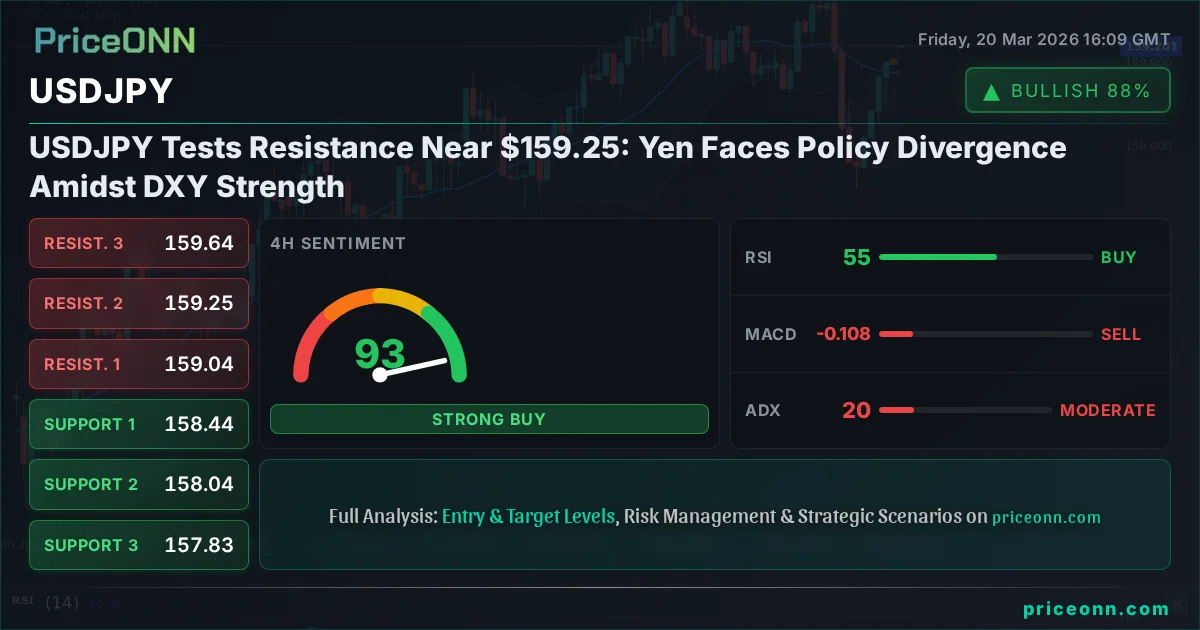
USDJPY Tests Resistance Near $159.25: Yen Faces Policy Divergence Amidst DXY Strength
USD/JPY is trading near $159.25, recovering from a sharp sell-off as the Yen underperforms. Key levels and market sentiment analyzed.
The relentless march of USDJPY towards new highs has captured the market's attention, and frankly, it’s a situation that demands a closer look right now. We're seeing the pair hover around the critical $159.25 mark, a level that has acted as both a magnet and a ceiling in recent trading sessions. This isn't just a simple tug-of-war between the US dollar and the Japanese yen; it's a complex interplay of central bank policies, shifting risk sentiment, and broader macroeconomic forces that are painting a fascinating picture for traders. Having tracked USDJPY through various market cycles, I can tell you that the current divergence between the Bank of Japan's accommodative stance and the Federal Reserve's more hawkish undertones creates a unique environment. This dynamic is not just theoretical; it's actively shaping price action and presenting both challenges and opportunities. The question on everyone's mind is: can USDJPY sustain this upward momentum, or are we on the cusp of a significant correction?
- USDJPY is testing resistance near $159.25, with the 1H RSI at 67.21 signaling potential overbought pressure.
- Critical resistance sits at $159.25, with a break above potentially targeting $159.64 (R2).
- The ADX at 26.2 on the 1H chart indicates a strong uptrend, but Stochastic at 98.03 suggests an extreme overbought condition.
- The Dollar Index (DXY) is strong at 99.44, reinforcing upward pressure on USDJPY, while the S&P 500's decline to 6558.5 signals risk-off sentiment.
The yen's persistent weakness against the dollar is a narrative that has been unfolding for some time, driven largely by the stark contrast in monetary policy between the two economic powerhouses. While the Federal Reserve has been navigating the complexities of inflation and economic growth, signaling a cautious approach to rate cuts, the Bank of Japan has maintained its ultra-loose monetary policy. This policy divergence is a powerful engine for the USDJPY pair, creating a fundamental imbalance that favors dollar strength. We’ve seen this play out numerous times, where interest rate differentials alone can drive significant currency movements. The market is constantly pricing in future rate hikes or cuts, and right now, the anticipation of continued Fed hawkishness, or at least a delayed pivot, versus the BoJ's unwavering commitment to easing, creates a fertile ground for USDJPY appreciation.
Looking at the broader market context, the Dollar Index (DXY) is telling a similar story. Currently trading around 99.44, the DXY shows a strong upward trend on the daily chart, supported by robust momentum. A rising dollar index typically exerts downward pressure on other currency pairs, particularly those with weaker underlying economies or more dovish central banks, like the yen. This correlation is not just a coincidence; it's a reflection of global capital flows seeking yield and stability. When the dollar strengthens, it often signifies a 'risk-off' sentiment, where investors flock to perceived safe-haven assets like the US dollar, often at the expense of riskier assets or currencies from countries with less attractive yields.
The Yen's Precarious Position
The Japanese yen, however, seems to be caught in a challenging crossfire. Despite the dollar's strength, the yen's weakness is amplified by internal factors. The Bank of Japan's commitment to maintaining negative interest rates and its yield curve control policy, even as inflation shows signs of stirring, leaves it vulnerable. We saw recent news highlighting that 'USD/JPY is trading near 158.33, recovering 0.4% after Thursday's sharp sell-off, as the Japanese Yen underperforms despite policy divergence.' This underperformance is key. While the policy divergence itself is a driver, the market's perception of the BoJ's resolve and its ability to manage inflation without disrupting the fragile economic recovery are crucial. Any hint that the BoJ might be forced to abandon its ultra-loose policy prematurely could trigger a sharp reversal, but for now, the path of least resistance appears to be yen weakness.
On the technical front, the 1-hour chart for USDJPY paints a picture of a strong uptrend, with the ADX at 26.2 indicating solid trending conditions. The RSI at 67.21 is in the upper neutral zone, suggesting room for further upside, but the Stochastic Oscillator is flashing a warning sign. With the %K line at 98.03 and the %D line at 81.76, we are deep in overbought territory. This divergence between the ADX's bullish trend signal and the Stochastic's extreme overbought condition suggests that while the trend is up, the immediate upside might be limited, and a pullback or consolidation could be on the horizon. It's a classic case of trend strength versus exhaustion.
Navigating the Resistance at $159.25
The immediate focus for USDJPY traders will undoubtedly be the resistance zone around $159.25. The 1-hour chart shows resistance levels at $159.194, $159.267, and $159.364. A decisive break and sustained hold above $159.267 would be a significant bullish signal, potentially opening the door for a move towards the next resistance level. However, given the overbought Stochastic readings and the general risk-off sentiment seen in global equities, a rejection from this level is also a strong possibility. We've seen this pattern before, where momentum stalls at key resistance points, leading to a retracement as traders take profits or reposition.
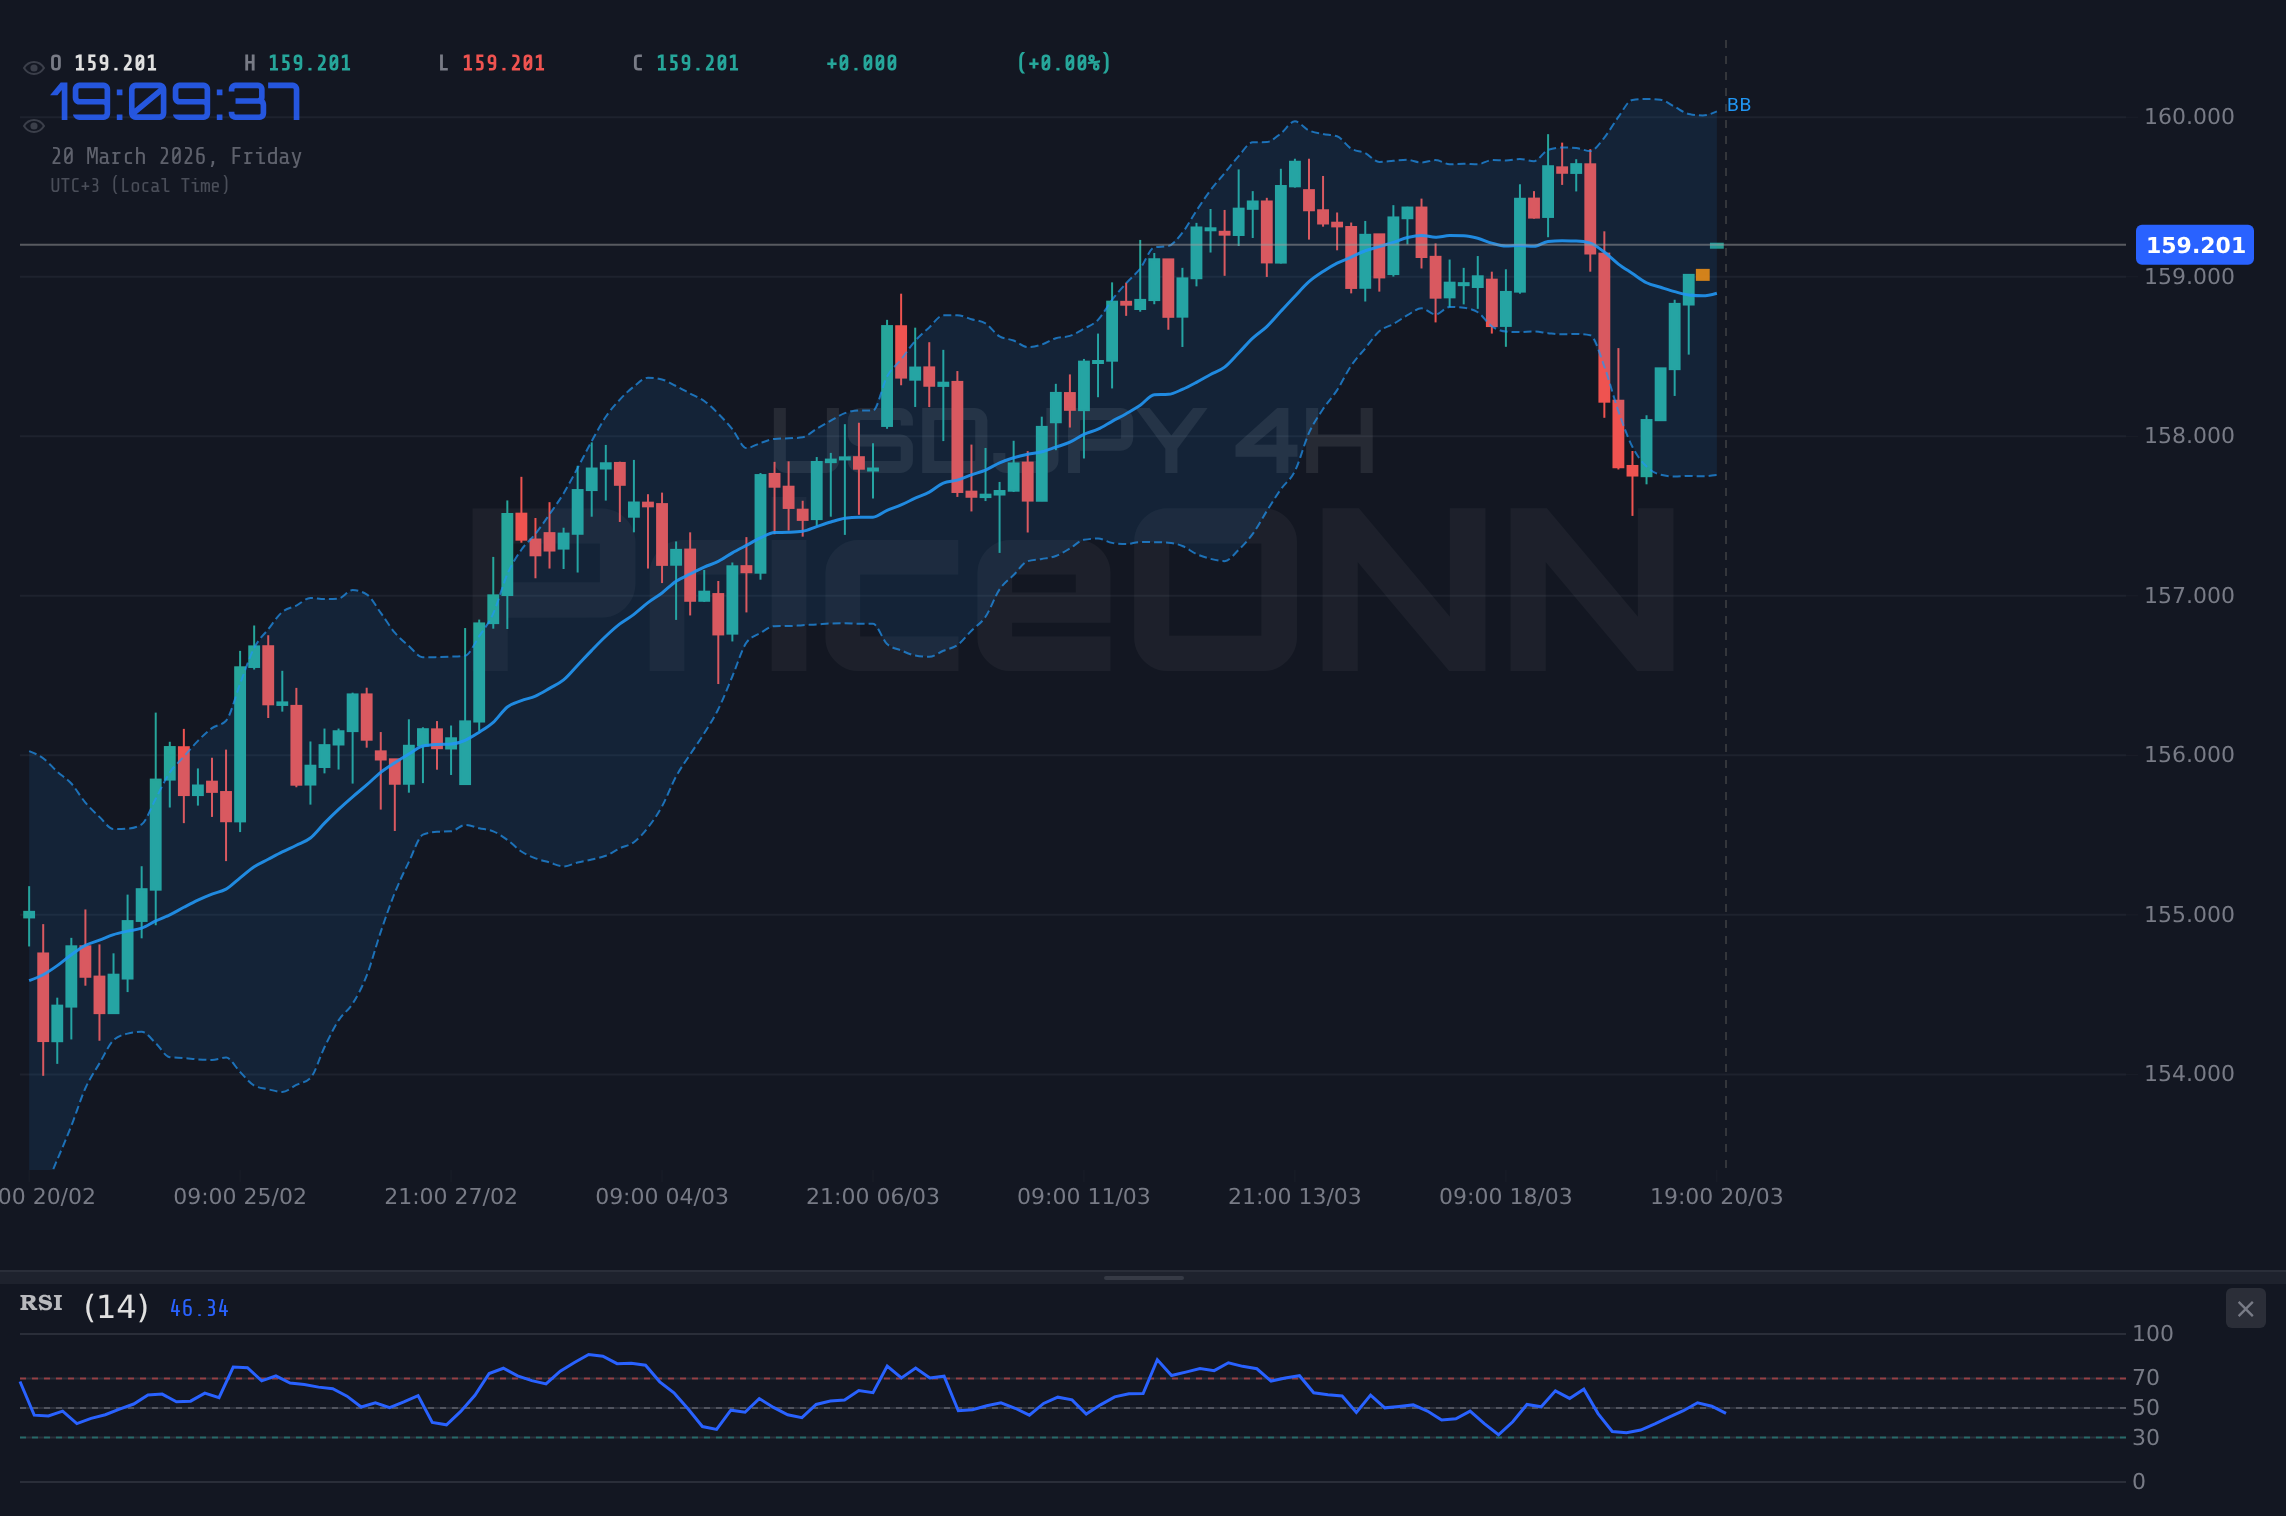
The 4-hour timeframe offers a slightly different perspective. While the trend is still predominantly considered neutral with moderate strength (ADX at 20.47), the RSI at 55.15 is comfortably in the neutral zone, and the MACD shows negative momentum, suggesting a potential cooling off from recent highs. However, the Stochastic oscillator here is showing a buy signal with %K at 57.16 and %D at 26.11. This mixed signal across different timeframes highlights the current indecision and the importance of the $159.25 level. It’s a battleground where bulls and bears are likely to fight for control.
The daily chart analysis for USDJPY presents a more nuanced view. The trend is still predominantly neutral, but the RSI at 59.62 indicates a healthy upward bias, and the MACD is showing positive momentum. The Stochastic oscillator, however, is starting to show a potential pullback with %K at 62.08 and %D at 79.89, crossing over. This suggests that while the longer-term trend might still favor upside, the short-to-medium term could see consolidation or a minor correction. The key takeaway from the daily chart is the overall bullish sentiment, but with caveats regarding short-term exhaustion.
The Broader Economic Landscape
Beyond the immediate price action, understanding the macroeconomic backdrop is crucial. The recent news about the S&P 500 plunging to its lowest point of 2026, breaching the 6,570 level, is a significant indicator of risk aversion. This 'risk-off' sentiment typically benefits safe-haven assets like the US dollar and can put pressure on currency pairs like USDJPY if it triggers broader market turmoil. However, in the case of USDJPY, the yen's own safe-haven status is being overshadowed by its weak monetary policy. This creates a peculiar situation where even as global markets show signs of stress, the dollar's strength, driven by yield differentials, continues to propel USDJPY higher.
The commodity markets also offer clues. Gold prices testing the $4,500 support level amid a liquidity squeeze signals potential financial stress, which would usually favor yen strength. Yet, the yen is weakening. This disconnect highlights how dominant the interest rate differential narrative is for USDJPY right now. WTI oil prices, despite slipping below $94 amid de-escalation efforts, are still elevated, contributing to inflation concerns globally. While higher energy prices can sometimes indirectly support the yen if they signal global demand, the immediate impact on the dollar's attractiveness often takes precedence.
Central bank communications will be the next critical factor. Any subtle shift in language from the Federal Reserve regarding inflation or future rate policy could significantly impact USDJPY. Similarly, any indication from the Bank of Japan that they are contemplating a policy tweak, however minor, could spark a rapid yen appreciation. Currently, the market is pricing in a specific outlook, and any deviation from that expectation could lead to sharp price movements. Traders are keenly watching Fed Fund Futures and OIS data for clues on future rate expectations. The current data suggests a cautious Fed, which supports the continuation of the USD strength theme.
Trading Scenarios for USDJPY
Bullish Scenario: Breaking the Ceiling
15% ProbabilityNeutral Scenario: Consolidation Phase
50% ProbabilityBearish Scenario: Pullback from Resistance
35% ProbabilityThe technical indicators provide a mixed bag, which often precedes a period of consolidation or a decisive breakout. On the 1-hour chart, the ADX at 26.2 suggests a strong trend, but the Stochastic oscillator is screaming 'overbought' at 98.03. This is a classic sign that the current momentum might be unsustainable in the short term. The RSI at 67.21 is also approaching overbought territory, further supporting the idea that a pullback is possible, even if the broader trend remains bullish. The key here is confirmation. A failure to push higher from current levels, coupled with a break below the $159.024 support, would validate the bearish scenario.
Conversely, a strong move above the $159.267 resistance, especially with increasing volume, would signal that the bulls are taking firm control. In such a scenario, the next targets would be around $159.643 and potentially higher. However, we must consider the broader market context. The risk-off sentiment indicated by the S&P 500's decline and the elevated oil prices contributing to inflation fears create an environment where safe-haven demand could eventually reassert itself, potentially challenging dollar strength. If geopolitical tensions were to escalate significantly, it could trigger a flight to safety that benefits the yen, despite its weak monetary policy.
The divergence between the 1-hour and 4-hour signals is also noteworthy. While the 1-hour chart shows strong bullish momentum but overbought conditions, the 4-hour chart presents a more neutral picture with a moderate ADX and a Stochastic showing a buy signal. This suggests that the immediate pressure might be resistance, but the underlying trend still has legs if key levels hold. The daily chart reinforces the longer-term bullish bias, but the Stochastic's potential crossover warns of potential retracements. Therefore, a patient approach is warranted. Waiting for a clear break of the $159.25 resistance or a confirmed bounce from the $159.024 support would be prudent for defining a clearer entry point.
The current technical setup on USDJPY shows conflicting signals across timeframes. While the overall trend might favor the upside, the overbought Stochastic oscillator on the 1-hour chart and the approaching resistance at $159.25 suggest a high probability of short-term consolidation or a pullback. Traders should exercise caution and wait for clearer confirmation before entering positions. Risk management is paramount, especially given the potential for sharp moves driven by central bank policy shifts or geopolitical events.
Frequently Asked Questions: USDJPY Analysis
What happens if USDJPY breaks above the $159.364 resistance level?
A sustained break above $159.364 on the daily chart would likely trigger further buying pressure, invalidating the immediate bearish scenario. The next key target would then be around $160.705, aligning with the R2 resistance on the daily timeframe. This would signal strong bullish conviction, potentially fueled by continued Fed hawkishness or dovish surprises from the BoJ.
Should I consider buying USDJPY at current levels near $159.25 given the RSI at 67.21?
Entering at current levels carries risk due to the approaching resistance and overbought Stochastic signals on the 1-hour chart. A more prudent approach would be to wait for a confirmed breakout above $159.364 or a pullback to the $159.024 support level, where a potential bounce could offer a better risk-reward ratio. Patience is key here.
Is the RSI at 67.21 on the 1-hour chart a sell signal for USDJPY right now?
An RSI of 67.21 is approaching overbought territory but is not yet an extreme sell signal on its own. It indicates that the upward momentum is strong but potentially nearing exhaustion. Combined with the overbought Stochastic and resistance at $159.25, it suggests a higher probability of consolidation or a pullback rather than an immediate reversal. Confirmation from price action is needed.
How will the current DXY strength at 99.44 affect USDJPY this week?
The strong DXY at 99.44 reinforces the upward pressure on USDJPY, as the dollar generally strengthens against the yen in risk-off environments or when interest rate differentials favor the US. This correlation suggests that continued DXY strength would support USDJPY's move towards higher resistance levels, provided the BoJ maintains its dovish stance.
Track markets in real-time
AI-powered analysis, technical indicators and real-time price data.
Join Our Telegram Channel
Breaking market news, AI analysis and trading signals instantly.
Join Channel