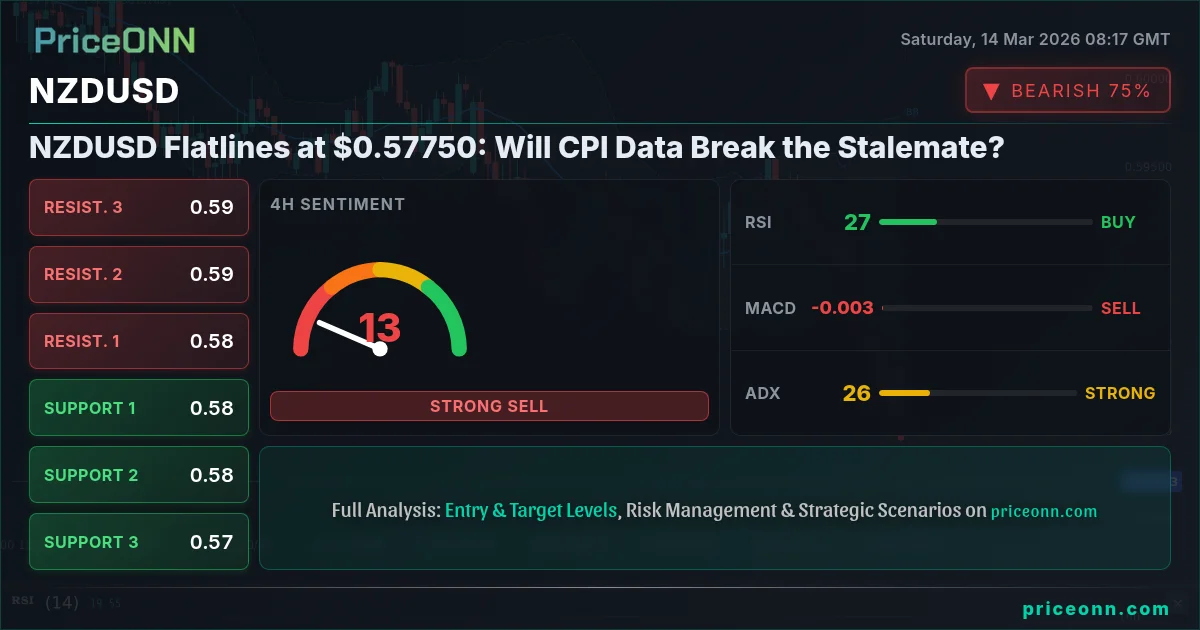
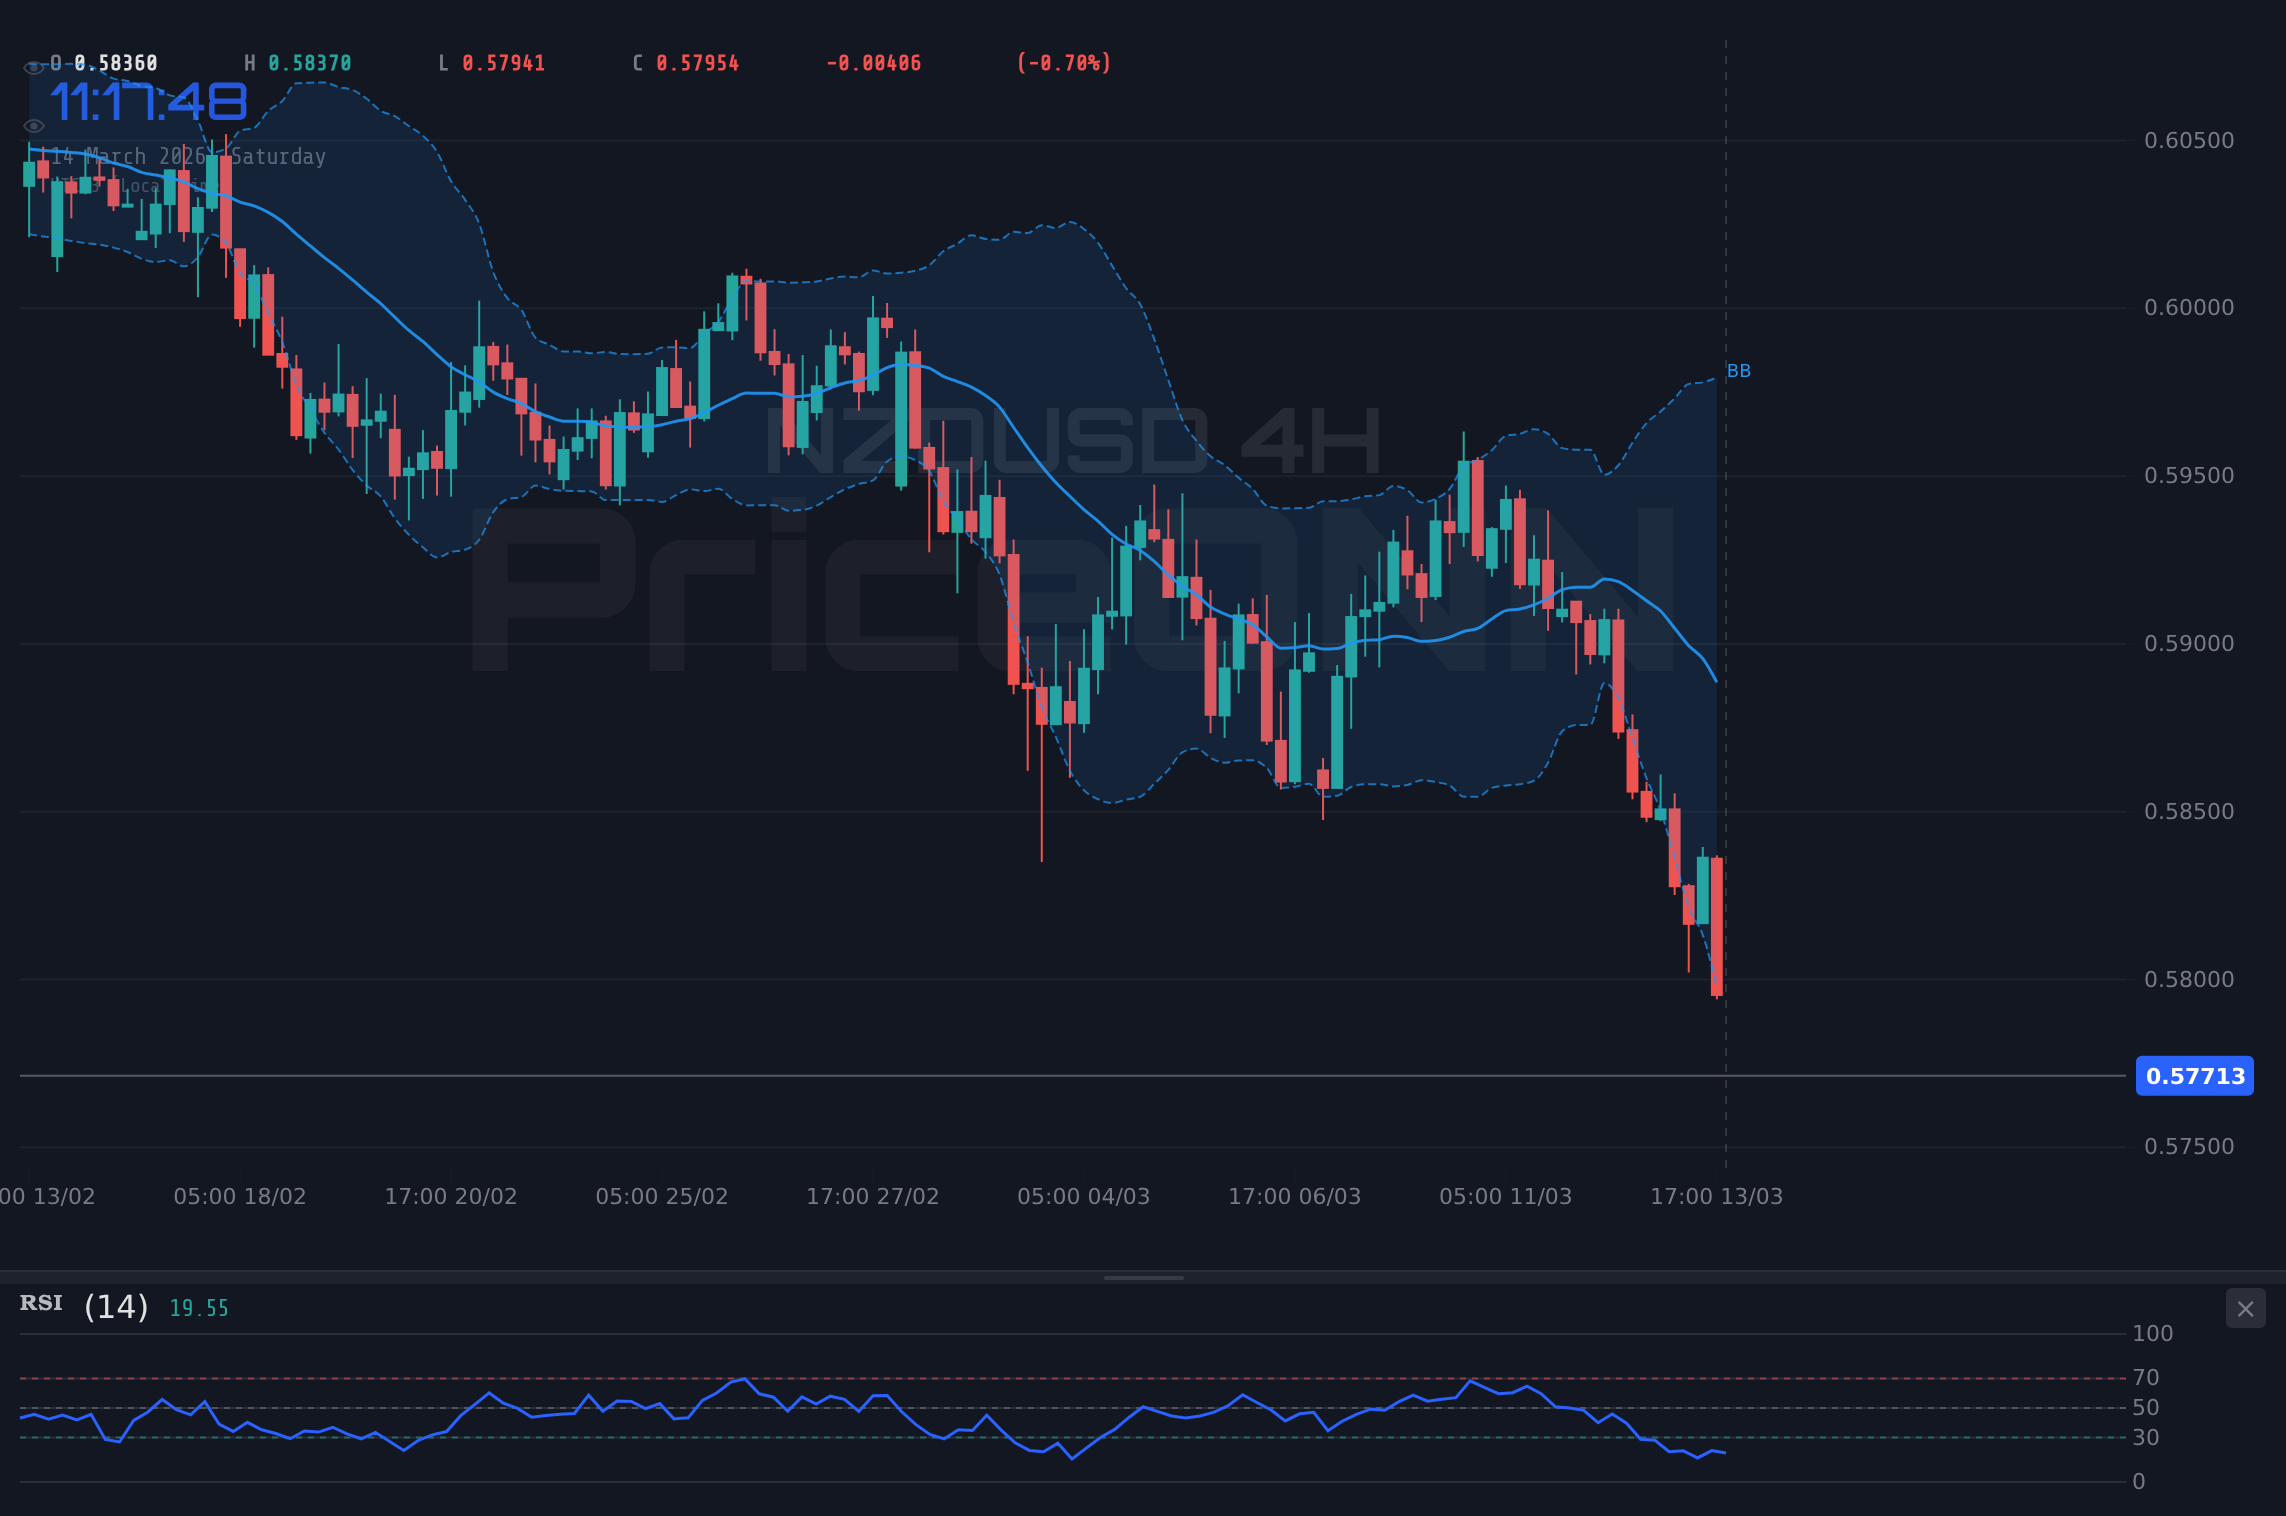
NZDUSD is currently trading near $0.57750, a level it has been hovering around for the better part of the last week. The pair is struggling to find a clear direction, with both bulls and bears hesitant to commit to a decisive move. The key question now is: will next week's CPI data provide the much-needed catalyst to break this stalemate?
- NZDUSD is stuck at $0.57750, unable to establish a clear trend.
- Key support sits at $0.57701, tested multiple times this week.
- The ADX on the 1D chart reads 23.64, suggesting a weak trend.
- Next week's CPI data could be a major driver for NZDUSD.
Having tracked NZDUSD through the 2024 rate cycle, it's clear that economic data releases often act as pivotal moments, and the upcoming CPI figures are no exception. The New Zealand Dollar's performance has been closely tied to global risk sentiment and commodity prices, particularly dairy, a major export for New Zealand. With the DXY at 100.2, the NZDUSD is under pressure, struggling to maintain its ground. Recent news highlights this pressure, with the New Zealand Dollar posting only mild gains despite positive economic indicators elsewhere.
The technical picture is mixed. On the 1-hour chart, the RSI is at 21.82, indicating oversold conditions, but the ADX at 46.62 confirms a strong downtrend. This divergence suggests that while a short-term bounce is possible, the overall momentum remains bearish. The pair is currently trading below its 200-day moving average, a key indicator of long-term trend direction. The recent PriceONN market news underscores this bearish sentiment, noting that the Kiwi is under pressure and struggling to hold above the $0.5900 level amidst global uncertainty.
The Bull's Roadmap: A Reversal Scenario
For the bulls to regain control, NZDUSD needs to break above the immediate resistance at $0.57957 on the 1-hour chart. This would signal a potential shift in momentum and could pave the way for a move towards $0.58222, the 4-hour resistance level. A sustained break above $0.58222 would be a significant victory for the bulls, potentially triggering a rally towards $0.58919, the 1-day resistance level. This scenario is contingent on a weaker-than-expected DXY and positive risk sentiment returning to the markets. Key indicators to watch include the RSI, which needs to break above 50 to confirm the bullish momentum, and the MACD, which needs to cross above its signal line. This bullish scenario is likely to play out within the next week, if the aforementioned conditions are met.
The bullish scenario is highly dependent on external factors, such as a weaker dollar and improved risk sentiment. Any negative surprises in economic data or further escalation of geopolitical tensions could quickly derail this scenario.
Where Bears Take Control: A Continuation of the Downtrend
The bearish scenario appears to be the more probable outcome, given the current market conditions. With the DXY at 100.2 and showing strong upward momentum, NZDUSD is likely to face continued pressure. If the pair breaks below the immediate support at $0.57701, a further decline towards $0.57601, the 1-day support level, is likely. A sustained break below $0.57601 could open the door for a move towards $0.57000, a key psychological level. The ADX on the 1-day chart at 23.64 suggests that the downtrend is not yet exhausted, and the RSI at 31.94 indicates that there is still room for further downside. This bearish scenario is likely to unfold within the next few days, especially if next week's CPI data comes in stronger than expected.
The bearish scenario is supported by the overall technical picture, which shows a clear downtrend across multiple timeframes. The strong DXY and negative risk sentiment further reinforce this bearish outlook.
The Waiting Game: A Range-Bound Scenario
In a neutral scenario, NZDUSD could remain range-bound between $0.57701 and $0.57957. This would likely occur if the market is indecisive and lacks a clear catalyst. The key indicators to watch in this scenario are the RSI and the MACD. If the RSI remains between 30 and 70, and the MACD oscillates around its signal line, it would suggest that the market is in a consolidation phase. This scenario could persist for the next few days, until a clear catalyst emerges. The Stochastic oscillator, currently signaling a potential oversold bounce on the 1H timeframe, could also contribute to this range-bound movement.
The PriceONN market news highlights that NZD/USD has been drifting lower, eyeing the 0.5800 mark as renewed safe-haven buying benefits the USD. This sentiment supports the likelihood of a range-bound or bearish scenario, as the USD strength continues to weigh on the pair.
Scenario Comparison
Here's a comparison of the three scenarios:
| Scenario | Trigger | Target | Probability |
|---|---|---|---|
| Bullish | Break above $0.57957 | $0.58919 | 30% |
| Bearish | Break below $0.57701 | $0.57000 | 50% |
| Neutral | Range-bound between $0.57701 and $0.57957 | N/A | 20% |
Most Likely Outcome
Based on the current market conditions and technical analysis, the bearish scenario appears to be the most likely outcome, with an estimated probability of 50%. The strong DXY, negative risk sentiment, and overall downtrend across multiple timeframes support this view. The neutral scenario is assigned a probability of 20%, while the bullish scenario is considered the least likely, with a probability of 30%. This is because the bullish scenario requires a significant shift in market sentiment and a weaker dollar, which are not currently evident.
What I'm Watching
This week, I'm closely watching the following triggers:
- CPI Data: Next week's CPI data is the key catalyst to watch. A stronger-than-expected CPI print could fuel further USD strength and exacerbate the bearish pressure on NZDUSD.
- DXY: The DXY's performance will continue to be a major driver for NZDUSD. A sustained break above 100.2 could signal further USD strength and weigh on the pair.
- Risk Sentiment: Any changes in global risk sentiment could also impact NZDUSD. A return to positive risk sentiment could provide some support for the pair, while further risk aversion could exacerbate the bearish pressure.
Frequently Asked Questions: NZDUSD Analysis
What happens if NZDUSD breaks below the $0.57701 support level?
If NZDUSD breaks below $0.57701, the next likely target is $0.57601, the 1-day support level. A sustained break below this level could open the door for a move towards $0.57000, a key psychological level.
Should I sell NZDUSD at current levels of $0.57750 given the RSI at 21.82?
While the RSI at 21.82 indicates oversold conditions on the 1-hour chart, the overall trend remains bearish. A short-term bounce is possible, but it's prudent to wait for a clear confirmation of a trend reversal before initiating a long position. The ADX at 46.62 confirms a strong downtrend, further supporting the bearish outlook.
Is the ADX reading of 23.64 on the 1D chart a reliable indicator for trend strength?
An ADX reading of 23.64 suggests a weak trend, indicating that the market is in a consolidation phase. While the downtrend is still in place, the lack of strong momentum suggests that the pair could remain range-bound between key support and resistance levels.
How will next week's CPI data affect NZDUSD given the current DXY strength?
Next week's CPI data is likely to be a major driver for NZDUSD. A stronger-than-expected CPI print could fuel further USD strength, exacerbating the bearish pressure on NZDUSD. Conversely, a weaker-than-expected CPI print could provide some relief for the pair, but the overall trend is likely to remain bearish given the current DXY strength.
Technical Outlook Summary
| Indicator | Value | Signal |
|---|---|---|
| RSI (14) - 1H | 21.82 | Oversold |
| MACD Histogram - 1H | Negative | Bearish |
| Stochastic - 1H | K=3.44, D=22.58 | Oversold |
| ADX - 1H | 46.62 | Strong Downtrend |
| Bollinger - 1H | Lower Band | Testing Lower Band |
Track markets in real-time
AI-powered analysis, technical indicators and real-time price data.
Join Our Telegram Channel
Breaking market news, AI analysis and trading signals instantly.
Join Channel