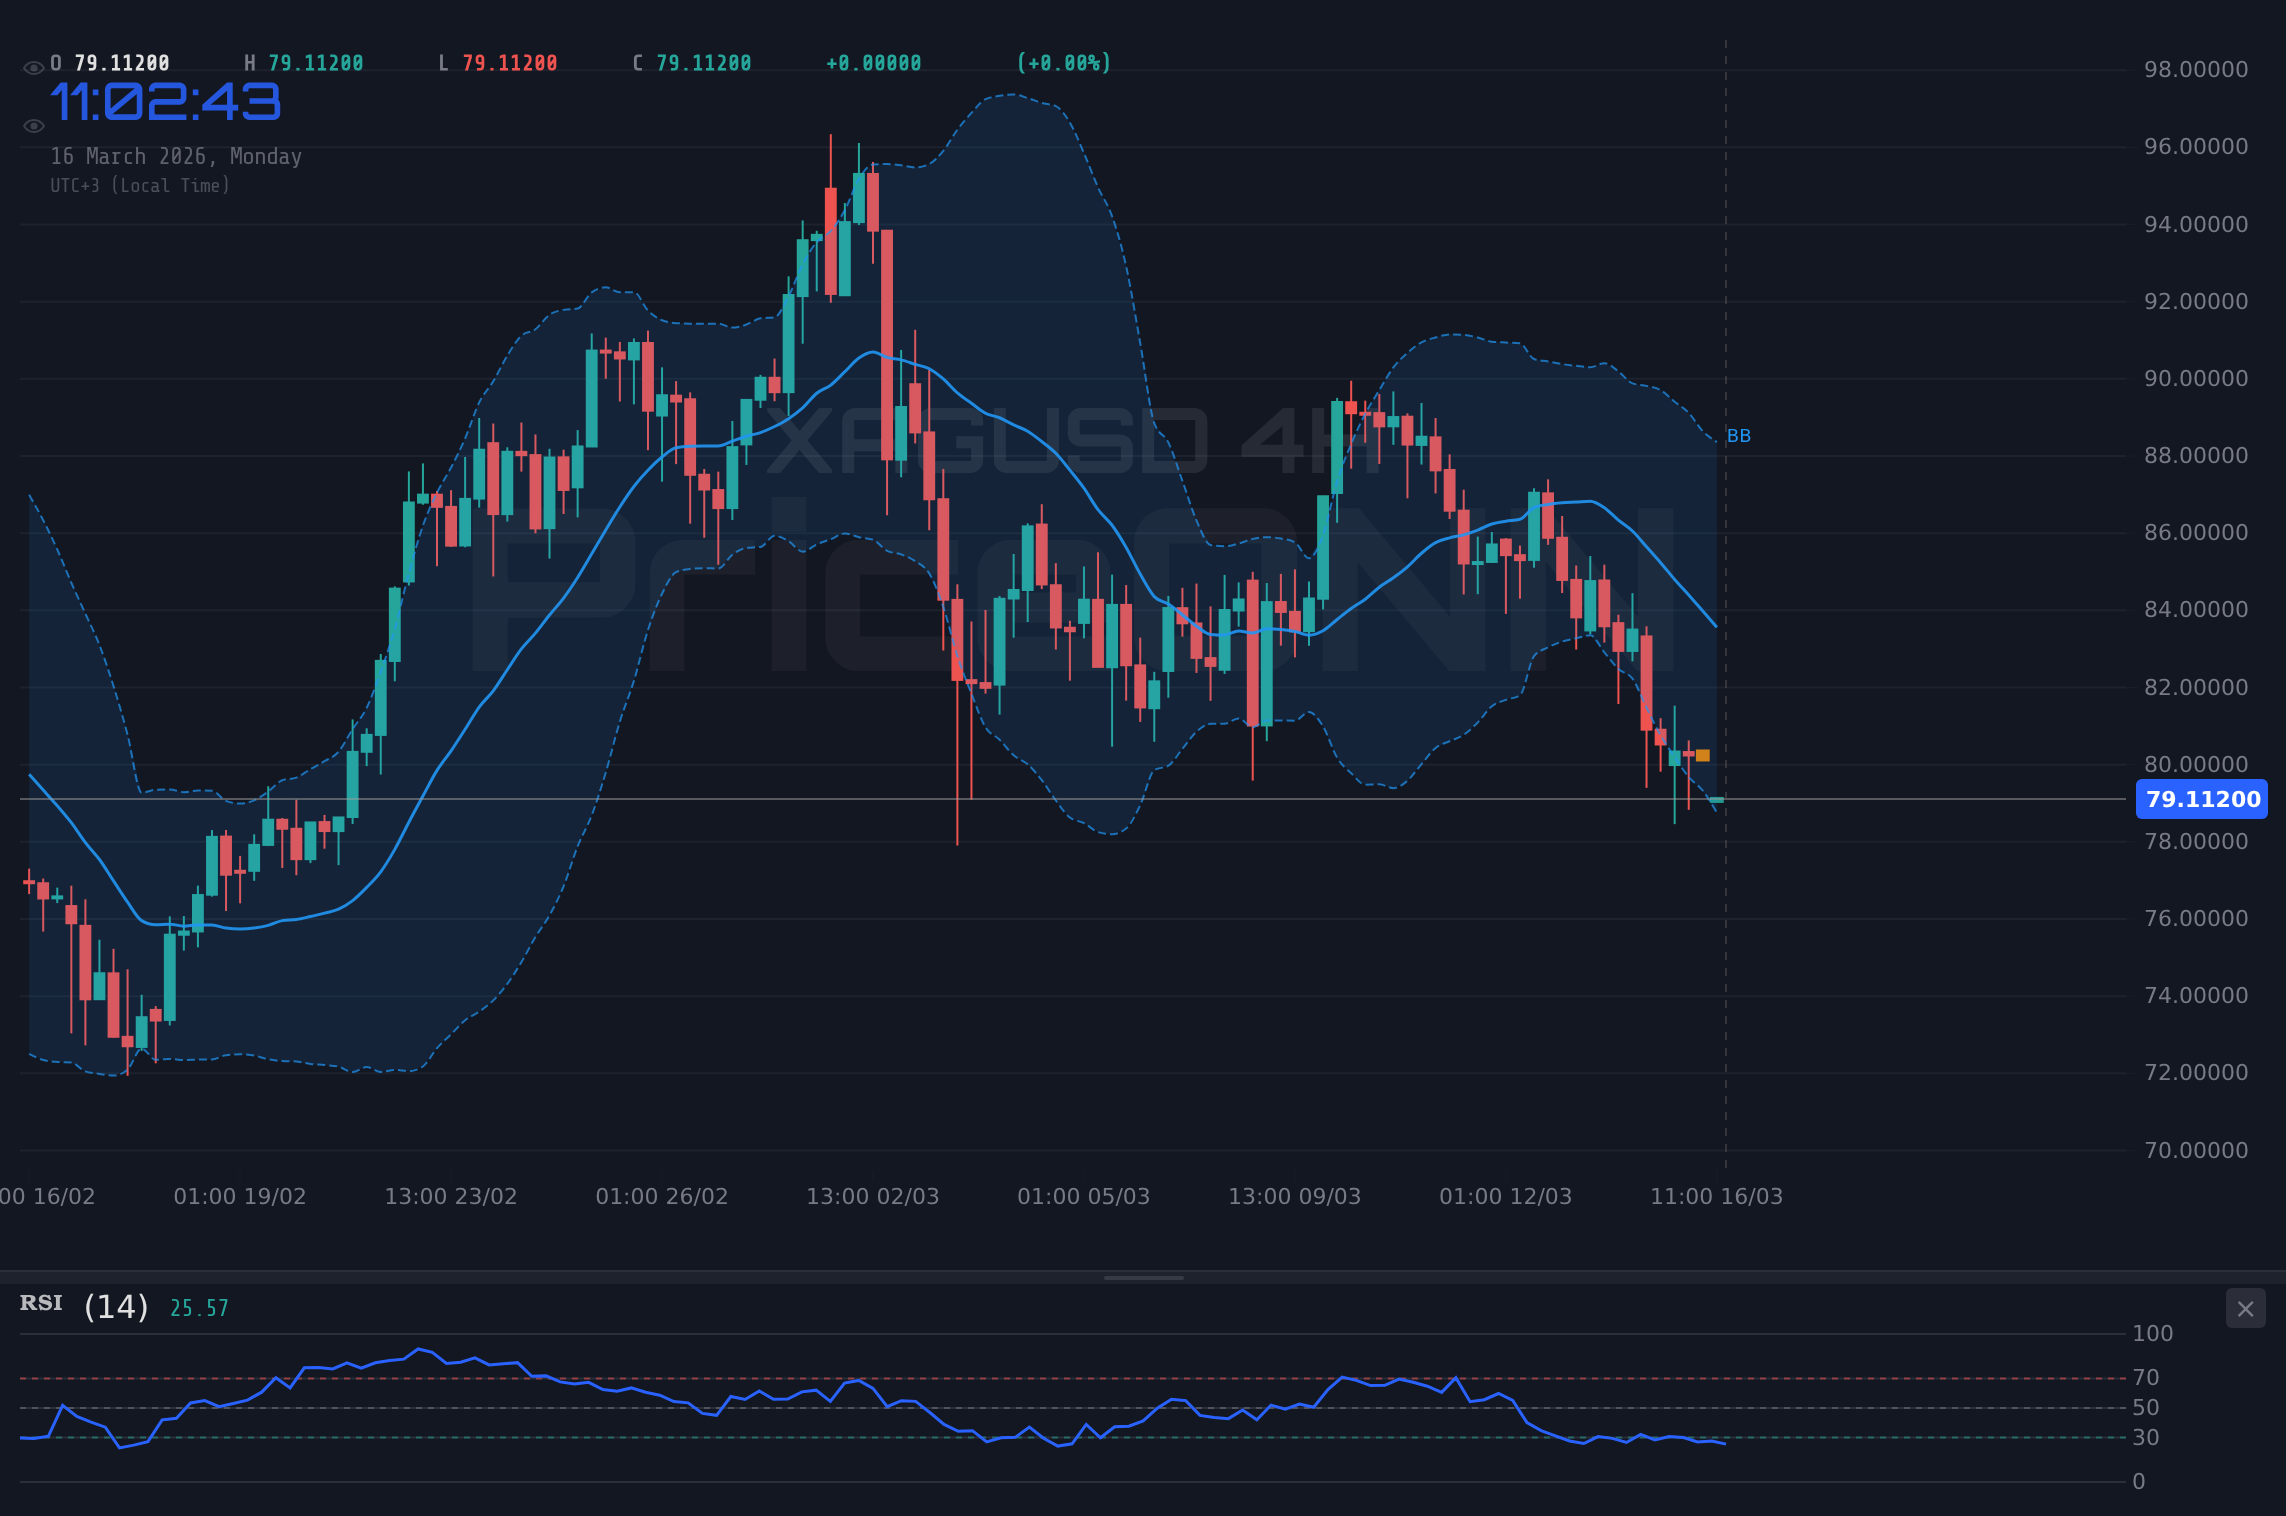
Silver Price Analysis: XAGUSD Tests $79.20 Support Amidst Volatile Markets
Silver (XAGUSD) is trading at $79.20, approaching critical support. This analysis dives into the technicals, macro drivers, and potential scenarios for traders.
Having tracked XAGUSD through periods of significant volatility, the current setup around the $79.20 mark is particularly compelling. This isn't just another trading day; it's a juncture where the interplay of macroeconomic pressures and technical fortitude will likely dictate the next significant move for silver. The recent price action, a sharp decline from recent highs, has brought the metal down to a level that many market participants have been watching closely. This analysis aims to dissect the current market sentiment, the underlying fundamental drivers, and what the technical indicators are screaming about XAGUSD's immediate future. We're looking beyond the headlines to understand the real forces at play, and whether this test of support represents a buying opportunity or a prelude to further downside.
- The RSI is currently at 35.83 on the 1H chart, indicating a bearish leaning within a neutral zone, suggesting further downside pressure might be limited in the short term.
- Critical support for XAGUSD is identified at $78.15, a level that has seen significant price action and is currently in focus.
- The MACD histogram shows positive momentum on the 1H chart, despite the overall bearish trend, hinting at potential short-term buying interest.
- Geopolitical tensions in the Middle East are fueling oil price surges, which typically correlate with inflation fears and can indirectly support precious metals like silver, although the dollar's strength is currently counteracting this.
Navigating the Currents: XAGUSD at a Critical Juncture
The price of silver, XAGUSD, is currently hovering around the $79.20 level, a point of significant interest for traders and analysts alike. This price point is not arbitrary; it sits precariously close to a key support level, $78.15, and its proximity demands attention. The past few days have seen a notable downturn in silver prices, a move that has surprised some given the escalating geopolitical tensions in the Middle East, which historically tend to boost safe-haven assets. However, the narrative is complex. While oil prices have surged due to these disruptions, as reported by energy news outlets, the US Dollar Index (DXY) has also shown resilience, currently trading around 100.04. This dollar strength is acting as a significant headwind for silver, creating a tug-of-war effect that is keeping the metal range-bound and volatile. Understanding this dynamic is crucial for anyone looking to navigate the silver market right now. The current market sentiment is one of caution, with traders weighing the safe-haven appeal of silver against the headwinds of a strong dollar and the broader risk-off sentiment that seems to be prevailing in some equity markets, like the S&P 500, which is showing a bearish trend on the 4H and 1D charts.
The daily change for XAGUSD reflects this pressure, showing a decline of -1.64%, equivalent to a $1.32 drop, bringing the price to $79.20. The daily range, from $78.46 to $81.53, illustrates the volatility inherent in the current market conditions. This broad range suggests that while sellers have been in control, there's also underlying buying interest that prevents a complete collapse. The direction is clearly downwards in the short to medium term, but the proximity to support levels is what truly captures the attention of the astute trader. The question on everyone's mind is whether this level will hold, or if we are looking at a deeper correction. The interplay between inflation fears, central bank policy expectations, and geopolitical instability creates a challenging but potentially rewarding environment for those who can read the signs correctly.
Technical Signals: A Mixed Bag on the Charts
Diving deeper into the technical indicators for XAGUSD, we see a picture that is far from clear-cut, reflecting the current market indecision. On the 1-hour timeframe, the trend is decisively bearish with a power of 96%, yet the RSI is sitting at 35.83, which, while in the neutral zone, shows a slight downtrend. This suggests that while the momentum is bearish, the selling pressure isn't entirely overwhelming, and a short-term bounce could be on the cards. The MACD indicator offers a glimmer of hope for bulls, showing positive momentum with the MACD line above the signal line. However, this is contrasted by Bollinger Bands that are trading below the middle band, indicating a bearish bias. Stochastic levels are also showing a potential for a bounce, with %K at 44.89 and %D at 51.57, hinting at a possible crossover soon. The ADX, a measure of trend strength, is at 42.09, confirming a strong downtrend on this timeframe. The overall signal for the 1H chart leans towards 'SELL' (1 Buy, 7 Sell, 0 Neutral), but the conflicting signals from MACD and Stochastic warrant a closer look for short-term trading opportunities.
Shifting to the 4-hour timeframe, the bearish trend intensifies, with a power of 92%. The RSI here is even lower at 30.27, pushing into oversold territory. This level often precedes a reversal, but in a strong downtrend, it can also signal capitulation. The MACD is firmly in negative momentum territory, below its signal line, reinforcing the bearish sentiment. Bollinger Bands are hugging the lower band, indicating significant selling pressure, and the Stochastic is showing a clear downtrend with %K at 16.09 and %D at 21.92. The ADX at 34.11 still points to a strong downtrend. The 4H chart is overwhelmingly bearish, with a 'SELL' signal across the board (0 Buy, 8 Sell, 0 Neutral). This timeframe paints a clearer picture of the dominant trend, suggesting that any short-term bullish signals on the 1H chart might be mere retracements within a larger downtrend.
The daily chart provides the broadest perspective, and here, the trend is still classified as neutral with 50% power, though the momentum is clearly leaning bearish. The RSI at 46.78 is in the neutral zone but trending downwards, suggesting a lack of conviction from buyers. MACD is negative, and Bollinger Bands are below the middle band, consistent with the bearish sentiment seen on lower timeframes. Stochastic is also bearish, with %K at 12.28 and %D at 30.57, indicating potential for further downside or a period of consolidation. However, the ADX at 12.68 is notably weak, suggesting that the current downtrend lacks strong directional conviction. This divergence between the weaker ADX and the bearish signals from other indicators on the daily chart is crucial. It implies that while the overall sentiment is negative, the market might be entering a phase of consolidation rather than a strong, committed downtrend. The daily overall signal is 'SELL' (2 Buy, 6 Sell, 0 Neutral), but the weak ADX is a key factor to monitor for any potential shift.
Fundamental Drivers: Inflation, Geopolitics, and the Dollar's Grip
The fundamental backdrop for silver is a complex interplay of inflationary pressures, geopolitical instability, and central bank policies, all of which are currently being overshadowed by the strength of the US Dollar. The recent surge in oil prices, driven by disruptions in the Strait of Hormuz and escalating Middle East tensions, is a significant factor. As reported by commodity news, crude oil prices have spiked, which typically fuels inflation expectations. Historically, silver, often seen as an inflation hedge, should benefit from such an environment. However, the current narrative is dominated by the US Dollar Index (DXY), which is trading around 100.04. The DXY's strength, a result of various factors including expectations of continued hawkishness from the Federal Reserve, is acting as a significant drag on dollar-denominated commodities like silver. When the dollar strengthens, it makes silver more expensive for holders of other currencies, thus dampening demand.
Looking at the economic calendar, the releases from the past few days, particularly those concerning the USD on Friday, March 13th, were notably absent of actual figures. This lack of concrete data means that market participants are likely relying more heavily on forward-looking statements from central banks and ongoing geopolitical developments. The upcoming week holds several high-impact events, including potential rate hikes from seven major central banks, including the Federal Reserve and the European Central Bank. These decisions will be critical in shaping the interest rate differential between the US and other major economies, directly impacting the DXY and, consequently, silver prices. If the Fed signals a more hawkish stance than anticipated, or if other central banks lag in their tightening cycles, the dollar could strengthen further, putting more pressure on XAGUSD. Conversely, any signs of a dovish pivot or global economic slowdown fears could bolster demand for safe-haven assets like silver, provided the dollar's strength abates.
The correlation between silver and the DXY is a key element to watch. As the DXY strengthens, XAGUSD typically faces headwinds. With the DXY at 100.04 and showing a strong uptrend on multiple timeframes, this correlation is currently working against silver bulls. The S&P 500 (SP500) and Nasdaq 100 (Nasdaq) indices are also showing a predominantly bearish trend on the daily charts, reflecting a broader risk-off sentiment in the equity markets. While this might normally drive investors towards safe havens like gold and silver, the dominant narrative remains the strong dollar. The news that Gold has fallen below the critical $5,000 level, despite geopolitical turmoil, further underscores the dollar's current dominance and the fading safe-haven status of precious metals in the immediate term. This suggests that for silver to find sustained upside momentum, either the DXY needs to weaken significantly, or the inflationary narrative driven by energy prices needs to overwhelm the dollar's strength, compelling a shift in market sentiment.
Market Structure and Trader Positioning
Examining the broader market structure and how traders are positioned provides further context for XAGUSD's current predicament. The overall trend analysis across multiple timeframes reveals a consistent bearish bias in the short to medium term, especially on the 4-hour and daily charts. However, the 1-hour chart presents a more nuanced picture with conflicting signals, suggesting potential for short-term fluctuations or minor bounces. This divergence between timeframes is typical in consolidation phases or at key support levels where conflicting forces battle for control.
The general 'SELL' signals dominating the 1H and 4H timeframes, contrasted with the weaker ADX on the daily chart, indicate that while the prevailing trend is down, conviction might be wavering. This could be a sign that the market is absorbing selling pressure near the $78.15 support level. For scalpers and short-term traders, the 1H chart's mixed signals might offer opportunities for quick trades, perhaps targeting a bounce towards the 1.14492 resistance on EURUSD, which often moves inversely to the dollar. However, for swing and long-term traders, the dominant bearish trend on lower timeframes suggests a more cautious approach. Waiting for confirmation of a bottoming process or a clear break above key resistance levels would be prudent. The current environment doesn't scream 'buy the dip' without significant caveats.
The lack of definitive directional signals across all timeframes suggests a market that is waiting for a catalyst. This could be a significant economic data release, a major geopolitical development, or a shift in central bank rhetoric. Until then, XAGUSD might remain range-bound, with the $78.15 support and the $80.67 (1H resistance) or $81.76 (4H resistance) acting as key boundaries. The news that Silver (XAG/USD) has staged a comeback, climbing back above the $81.00 level after touching a near two-week low of $78.3, as reported by commodity news, highlights this volatility and the rapid shifts in sentiment that can occur. This suggests that while the current price is $79.20, the market is actively testing these boundaries, and a move above $81.00 would be a significant development for the bulls, signaling a potential short-term reversal.
Looking Ahead: What's Next for Silver?
The path forward for silver hinges on several key factors. Firstly, the direction of the US Dollar Index (DXY) will be paramount. A sustained weakening of the DXY, perhaps triggered by a less hawkish Fed or a global economic slowdown, could provide the necessary tailwind for XAGUSD to reclaim higher ground. Secondly, the geopolitical situation in the Middle East remains a wild card. While currently favoring the dollar, any further escalation or unexpected de-escalation could dramatically shift market sentiment and commodity prices. Thirdly, inflation data will continue to be a critical driver. If inflation proves more persistent than expected, central banks might be forced into more aggressive tightening, which could pressure growth assets but potentially bolster precious metals as a hedge, albeit with the dollar acting as a counterforce.
From a technical standpoint, the $78.15 support level is the immediate line in the sand. A decisive break below this level, supported by strong volume and confirming bearish signals across timeframes, could open the door to further downside, potentially targeting the $75.77 and $72.14 levels on the daily chart. Conversely, if XAGUSD can hold above $78.15 and manage to break through the near-term 1H resistance at $80.67, then a move towards the 4H resistance at $81.76 becomes plausible. Confirmation would likely require a break above the $84.16 daily resistance level. The RSI at 34.1 on the 1H chart suggests that while the downtrend is present, the oversold conditions are not extreme, leaving room for a potential bounce. The overall 'SELL' signals across most timeframes indicate that caution is the primary strategy for now, but traders should remain vigilant for any signs of a fundamental or technical shift.
The current market is highly sensitive to geopolitical news and central bank policy shifts. Any unexpected developments could trigger rapid price movements. Traders should exercise strict risk management, utilize stop-losses, and avoid over-leveraging positions. The confluence of a strong dollar and geopolitical uncertainty creates a complex environment where short-term volatility can mask underlying trends. Focus on price action near key levels like $78.15 and $80.67 for immediate trading decisions.
Frequently Asked Questions: XAGUSD Analysis
What happens if XAGUSD breaks below the $78.15 support level?
If XAGUSD decisively breaks below $78.15, supported by strong volume and bearish technical signals, it could trigger further downside. The next significant support levels to watch would be $75.77, followed by $72.14 on the daily chart. This scenario would likely be driven by continued dollar strength or a shift away from safe-haven demand.
Should I buy XAGUSD at current levels of $79.20 given the RSI is at 35.83?
Buying at $79.20 requires caution, as the overall trend on lower timeframes is bearish. While the RSI at 35.83 on the 1H chart suggests some cooling of selling pressure, it's not yet in extreme oversold territory. A more prudent approach would be to wait for confirmation of a bottom, perhaps a bounce above $80.67 resistance, or a clear bullish divergence on the daily chart.
Is the MACD histogram showing positive momentum a buy signal for XAGUSD at $79.20?
The positive MACD histogram on the 1H chart is a conflicting signal against the broader bearish trend. It suggests some underlying buying interest or a potential short-term retracement. However, on the 4H and daily charts, MACD shows negative momentum. Therefore, this positive signal alone is not a strong buy signal and should be confirmed by other factors, such as a break of resistance or sustained bullish price action.
How will the upcoming central bank rate decisions affect XAGUSD this week?
Upcoming central bank decisions, particularly from the Fed and ECB, are critical. If they signal more aggressive rate hikes or maintain a hawkish stance, the US Dollar could strengthen further, pressuring XAGUSD. Conversely, any hint of a pause or dovish tilt could weaken the dollar and potentially support silver prices, especially if inflationary data remains elevated.
The market is currently in a delicate balance. While the bearish technical signals on the 4-hour and daily charts are undeniable, the approaching support level at $78.15, combined with geopolitical uncertainties that could historically favor precious metals, presents a complex picture. Traders must remain disciplined, closely monitoring the price action around these key levels and staying attuned to macroeconomic shifts. Patience will be rewarded as the market clarifies its next direction. The current price of $79.20 is a crucial point, and how it evolves in the coming sessions will set the tone for silver's trajectory.
Track markets in real-time
AI-powered analysis, technical indicators and real-time price data.
Join Our Telegram Channel
Breaking market news, AI analysis and trading signals instantly.
Join Channel