
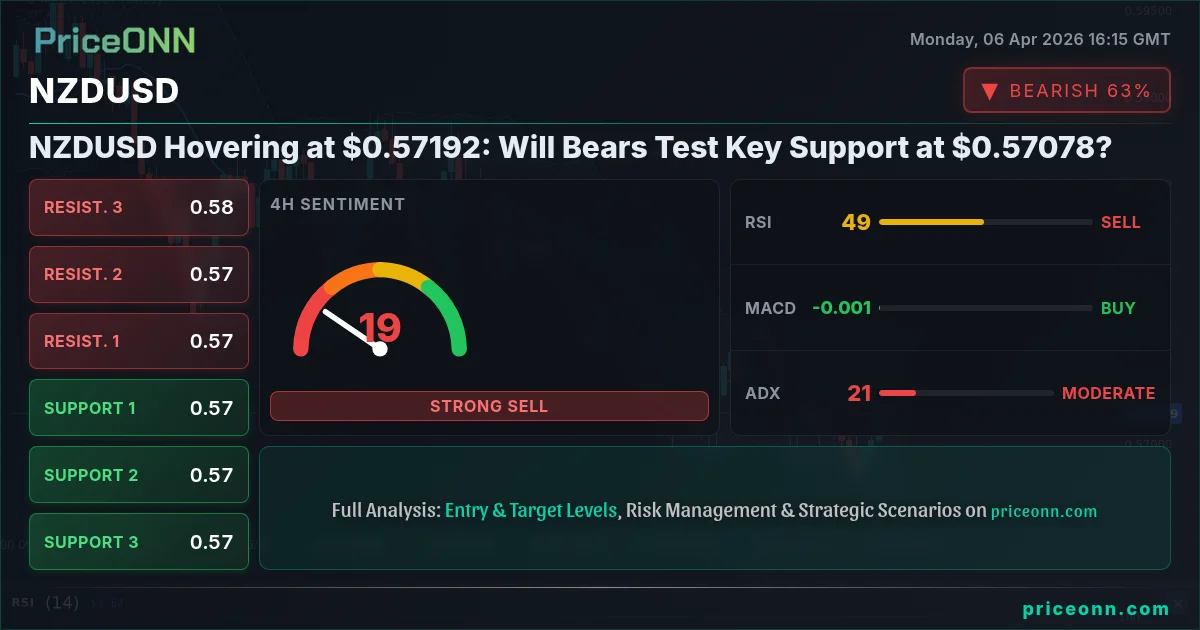
NZDUSD Hovering at $0.57192: Will Bears Test Key Support at $0.57078?
NZDUSD is currently trading at $0.57192. With RSI at 67, bulls are losing steam, but ADX at 20.6 suggests a trend is yet to commit. This analysis explores the bull vs. bear debate.
The currency markets are a constant tug-of-war, and right now, the focus is sharply on NZDUSD. Trading precariously around the $0.57192 mark, this pair is at a critical juncture where bulls and bears are locked in a fierce battle. The question on every trader's mind is whether the current strength can hold, or if the bears will claw back control, testing vital support levels. Having tracked NZDUSD through recent volatility, it's clear that multiple factors are at play, from the broader risk sentiment signaled by the S&P 500 to the persistent strength of the US Dollar Index (DXY). Understanding these intermarket dynamics is crucial for navigating the choppy waters ahead.
- NZDUSD is trading at $0.57192, with key support at $0.57078 and resistance at $0.57266.
- The 1-Day RSI at 43.93 signals a bearish trend, while the 1-Hour RSI at 58.85 suggests a bullish inclination.
- ADX readings across timeframes (1H: 30.01, 4H: 20.6, 1D: 42.52) indicate mixed trend strength, with the daily chart showing a strong downtrend.
- The US Dollar Index (DXY) at 99.71 shows strength, potentially pressuring NZDUSD, while the S&P 500's rise to 6572.87 suggests a moderate risk appetite.
- The prevailing technical signals present a mixed picture, making a clear directional bias challenging without further confirmation.
The Bullish Case: Can Momentum Hold Above $0.57192?
On the shorter timeframes, there are glimmers of hope for the bulls. The 1-Hour chart for NZDUSD paints a picture of upward momentum, with a general buy signal across most indicators. The RSI(14) at 58.85, while not yet in overbought territory, shows a clear upward eğilim, suggesting buyers are actively participating. MACD is also showing positive momentum on this timeframe, with the MACD line above its signal line, indicating that the bulls are currently in the driver's seat for intraday trading. Furthermore, the Stochastic Oscillator, with %K at 65.84 and %D at 77.25, is signalling a potential bullish crossover, although it's currently in a bearish configuration (%K
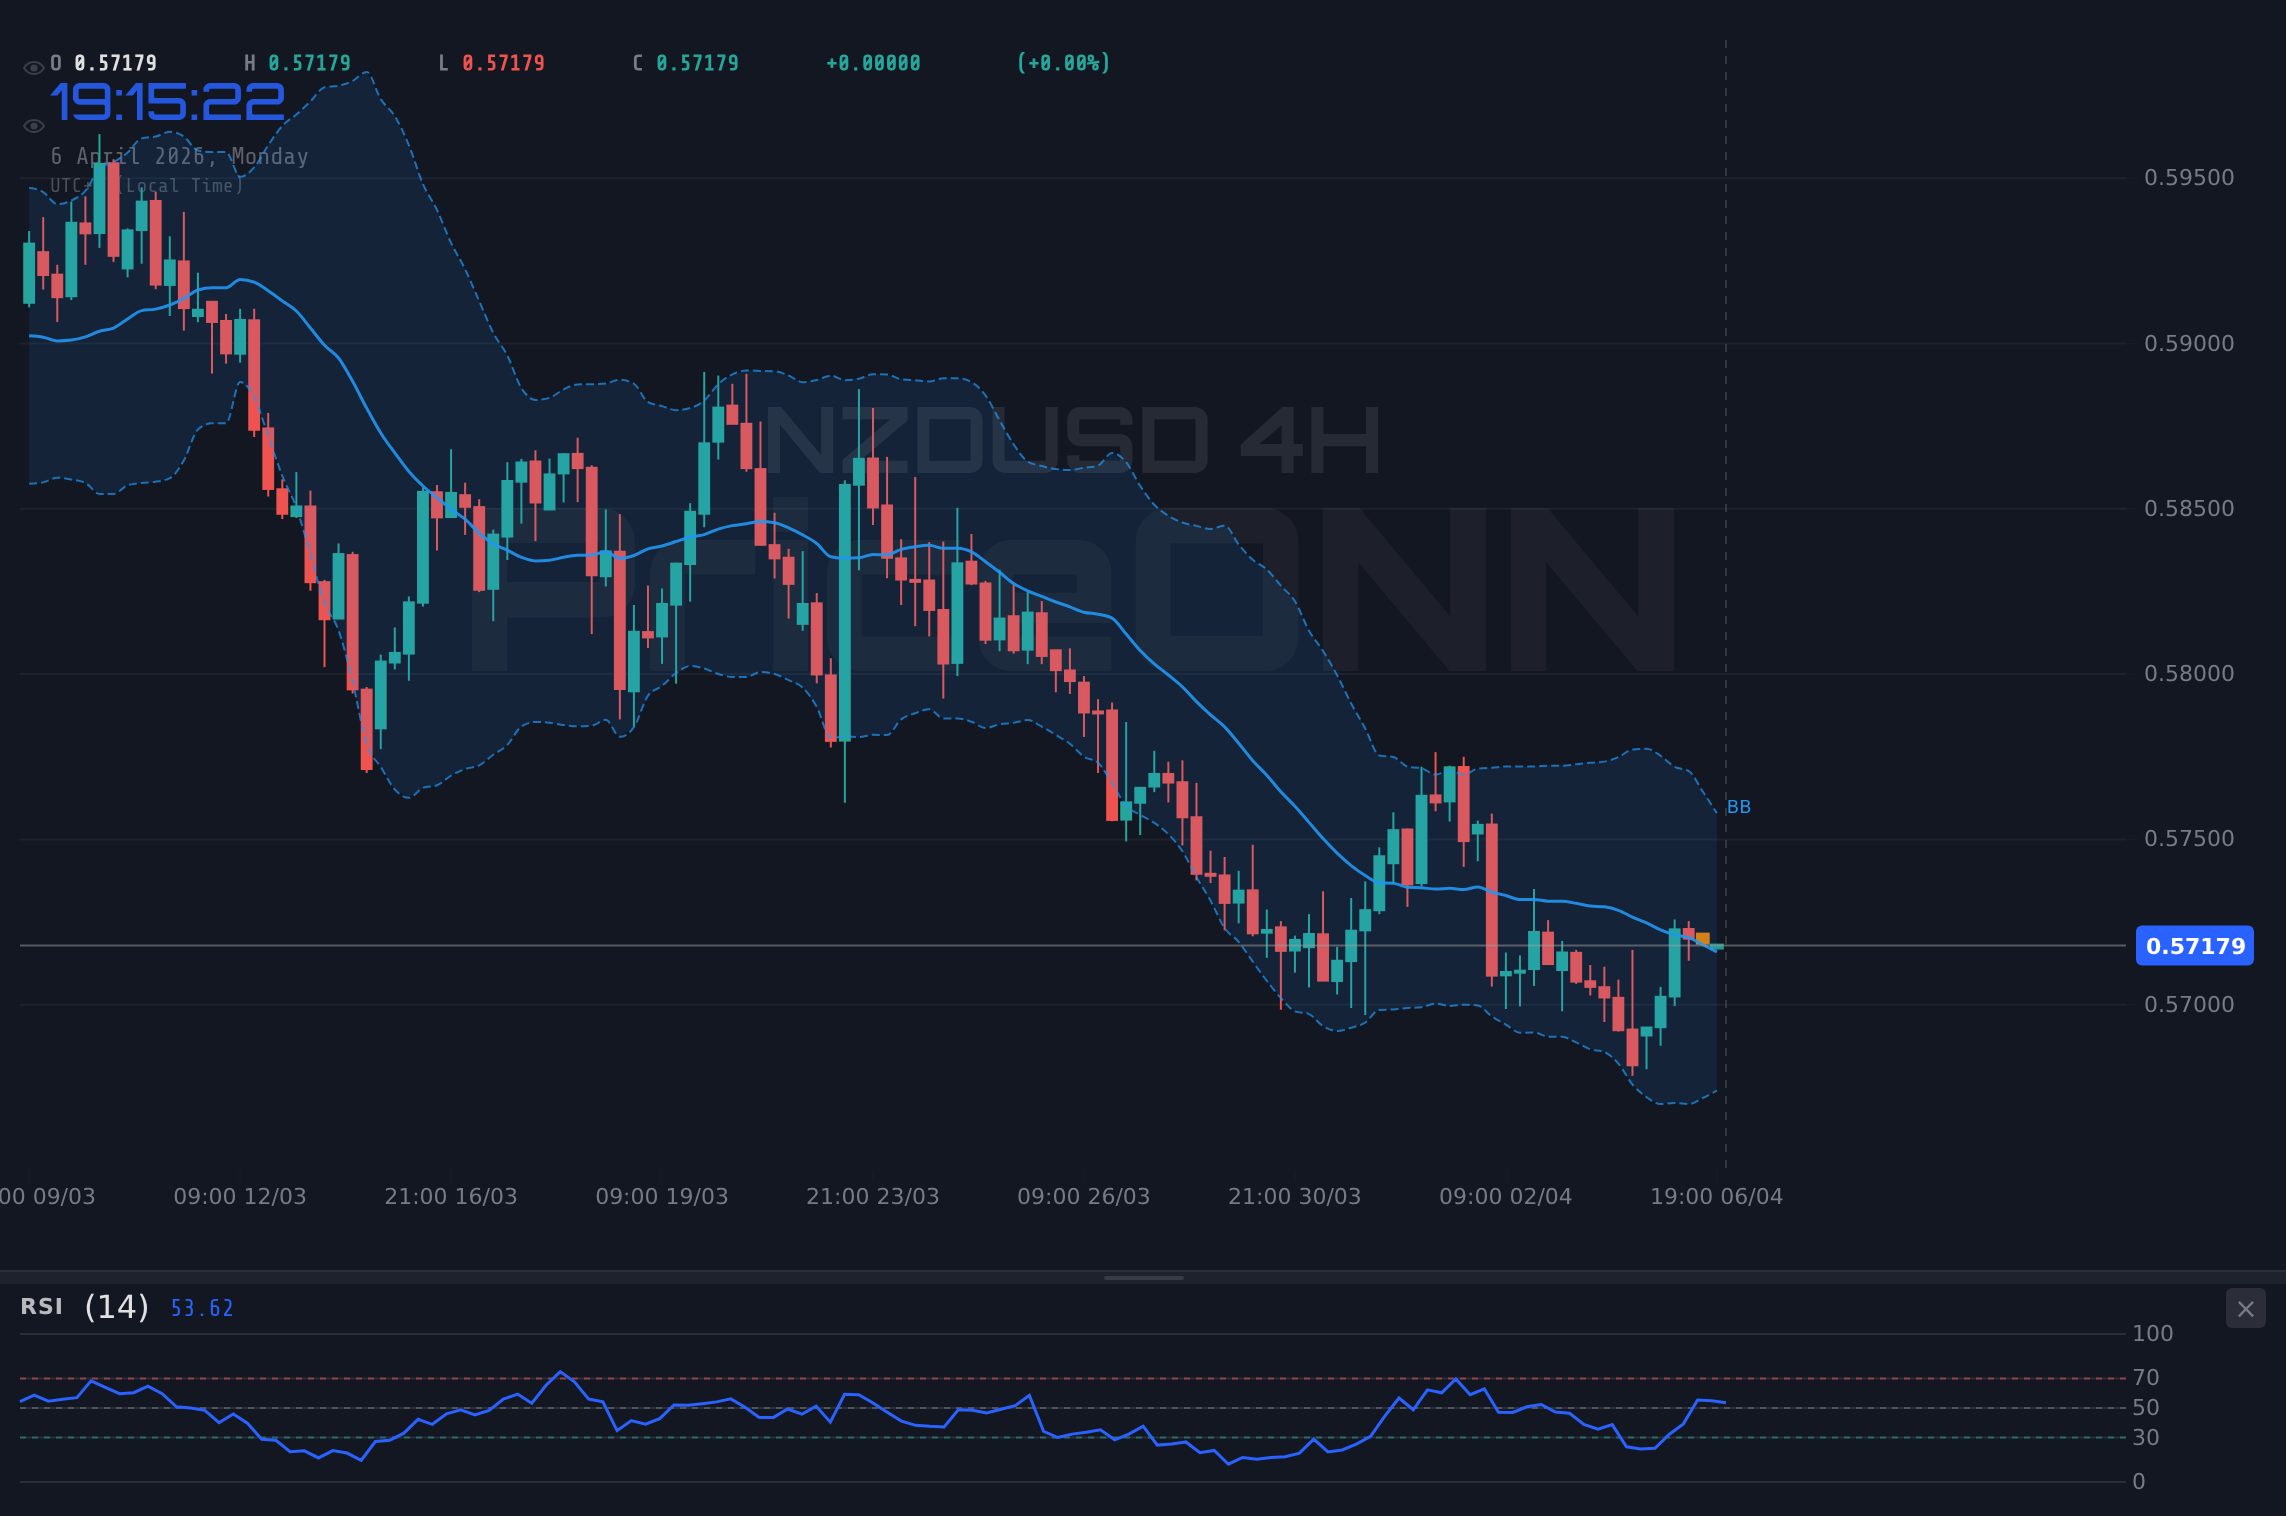
The 4-Hour chart, while showing a neutral trend overall (50% strength), still offers some support for the bullish argument. The RSI(14) at 57.02 continues to hover in neutral territory with a rising eğilim, and the MACD is exhibiting positive momentum. The Stochastic Oscillator here is particularly interesting: %K at 87.14 and %D at 60.56 shows a strong bullish signal (%K > %D) and is pushing into overbought territory. This suggests that short-term buying pressure could intensify. The fact that the price is holding above the middle Bollinger Band also lends credence to the idea that the immediate trend might be upwards. If the bulls can maintain control and push past the immediate resistance levels, particularly the $0.57325 mark, we could see a more significant rally unfold. This is the kind of setup that swing traders watch closely, looking for confirmation of a trend reversal.
Correlation analysis also provides some context. The S&P 500 is currently trading at 6572.87, showing a solid gain of 0.74% on the day. This risk-on sentiment in equities can sometimes translate into higher demand for riskier currencies like the NZD, especially if the US Dollar Index (DXY) is not showing overwhelming strength. While the DXY is currently at 99.71, showing some upward movement, it's not yet at levels that would definitively crush all risk assets. The interplay between a rising S&P 500 and a potentially stable or slightly weakening DXY could create a favorable environment for NZDUSD to climb. The narrative of renewed ETF demand, as seen in Bitcoin holding above $60,000, might also spill over into broader risk sentiment, indirectly supporting NZDUSD.
The Bearish Case: Daily Trend and Dollar Strength Loom Large
However, the picture darkens considerably when we shift our focus to the longer-term daily charts. The Daily RSI(14) for NZDUSD is sitting at 43.93, firmly in neutral territory but with a distinct downward eğilim. This suggests that while we might see short-term bounces, the underlying pressure is still bearish. The MACD on the daily chart, despite showing positive momentum and the MACD line above its signal line, is operating within a larger bearish context. More concerning is the ADX at 42.52 on the daily timeframe. This indicates a strong downtrend is in place, and any short-term rallies are likely to be met with significant selling pressure as the larger trend reasserts itself. The price currently trading below the middle Bollinger Band on the daily chart further reinforces this bearish outlook, suggesting that the path of least resistance is downwards.
The Stochastic Oscillator on the daily chart also presents a bearish signal, with %K at 33.19 and %D at 22.13, showing a bullish crossover (%K > %D), but this occurs in oversold territory and often signals a bear market rally rather than a true trend reversal. The fact that it's in oversold territory means there's potential for a bounce, but the strong daily ADX suggests this bounce will likely be capped. The primary support level to watch on the downside is $0.57078, followed by $0.5697. A decisive break below these levels would confirm the bearish thesis and could lead to a much sharper decline, potentially targeting the $0.5667 mark. The market's reaction to the recent drop in AUD/USD to near 0.6885, partly due to robust US jobs data and Middle East tensions boosting the dollar, serves as a cautionary tale for NZDUSD.
The strength of the US Dollar Index (DXY) cannot be overstated. Currently at 99.71, the DXY's daily chart shows a strong uptrend (95% strength) with an ADX of 29.76. This persistent dollar strength is a significant headwind for NZDUSD. When the dollar is strengthening broadly, it tends to pull down pairs like NZDUSD, especially if the Reserve Bank of New Zealand (RBNZ) is not seen as being as hawkish as the Federal Reserve. Although specific RBNZ or Fed policy data isn't provided in the recent economic calendar, the general trend of dollar strength often correlates with expectations of tighter monetary policy or a more resilient US economy compared to its peers. This macro backdrop provides a solid foundation for the bearish argument, suggesting that any rallies in NZDUSD might be opportunities for sellers to enter the market.
Navigating the Cross-Currents: Technicals and Intermarket Analysis
The conflicting signals across different timeframes and indicators create a complex trading environment for NZDUSD. While the 1-hour chart shows bullish signs, the daily chart paints a decidedly bearish picture. This divergence is where multi-timeframe analysis becomes critical. For instance, the 1-hour RSI at 58.85 suggests bullish momentum, but the daily RSI at 43.93 indicates underlying weakness. Similarly, the ADX readings are wildly different: a strong uptrend on the 1-hour (30.01) versus a strong downtrend on the daily (42.52). This suggests that short-term traders might find opportunities on the buy-side, but longer-term investors or swing traders should be wary of the dominant daily trend. The market sentiment, as reflected by the S&P 500's climb, offers some support for riskier assets, but the strong DXY trend acts as a significant counterforce.
The price action around the key levels is also telling. NZDUSD is currently testing resistance near $0.57266 on the 1-hour chart, while the critical support lies at $0.57078. A failure to break above $0.57266, especially with the bearish signals from the daily timeframe, could see the price quickly reverse towards $0.57078. Conversely, a decisive close above $0.57266, confirmed by increasing volume and sustained buying pressure across multiple timeframes, could signal a short-term bullish reversal. However, given the strong daily downtrend indicated by the ADX, such a move would likely face significant resistance higher up, potentially around $0.57325 or $0.57414.
The recent news flow also adds layers of complexity. Reports of escalating Middle East tensions and climbing oil prices, while typically a risk-off signal that could benefit safe havens, are also being countered by hopes for de-escalation, as seen in gold's reaction. For NZDUSD, this geopolitical uncertainty creates a volatile backdrop. If tensions escalate further, it could trigger a flight to safety, hurting NZDUSD. If tensions ease, it could boost risk appetite, potentially helping NZDUSD. The market's reaction to US jobs data, which boosted the dollar and pressured AUD/USD, highlights the sensitivity of commodity currencies to US economic strength and the greenback's performance.
The Verdict: A Bear Market Rally or a Genuine Reversal?
Weighing the evidence, the short-term bullish signals on the 1-hour and 4-hour charts appear to be battling against a strong, established bearish trend on the daily timeframe. The ADX readings are particularly telling: a strong trend is present, but its direction is dictated by the longer timeframe. Therefore, while intraday traders might find opportunities to the upside, the overall bias leans bearish. The DXY's strength and the bearish daily technicals suggest that any rallies are likely to be selling opportunities in the context of the larger downtrend. The key level to watch remains $0.57078. A break below this level would confirm the bearish scenario, while a sustained move above $0.57325, backed by strong volume and positive daily chart confirmation, would be needed to even consider a significant bullish reversal.
Given the mixed signals and the dominance of the daily bearish trend, caution is paramount. The current price action around $0.57192 represents a critical test. Bulls are fighting to hold ground, potentially aiming for resistance near $0.57266, while bears are poised to push the price lower, targeting support at $0.57078. The strength of the ADX on the daily chart (42.52) signals that this is not a time for indecision; a trend is in force, and it's currently pointing downwards. Traders should look for clear breaks of these key levels, supported by increased volume and confirmation from other indicators, before committing to a directional trade. The market is offering clues, but clarity will only emerge once these levels are decisively breached.
The current environment, characterized by geopolitical uncertainty and mixed economic signals, demands a disciplined approach. While the short-term charts may offer enticing setups, the long-term trend on the daily NZDUSD chart remains bearish. This suggests that any upward movements should be viewed with skepticism, potentially as bear market rallies. The strong performance of the US Dollar Index further complicates the bullish case. Therefore, until we see a decisive shift in daily technicals or a clear break of key resistance levels like $0.57325, the more probable scenario involves further downside pressure. The support at $0.57078 is the immediate line in the sand; a breach here would open the door for a more significant decline. Patience and risk management are key as the market digests these conflicting signals and awaits a clearer directional mandate.
Bearish Scenario: The Downtrend Continues
65% ProbabilityBullish Scenario: Short-Term Momentum Persists
15% ProbabilityNeutral Scenario: Consolidation Around $0.57192
20% ProbabilityFrequently Asked Questions: NZDUSD Analysis
What happens if NZDUSD breaks below the $0.57078 support level?
A break below $0.57078 on the daily chart would confirm the bearish trend, potentially triggering a move towards $0.56970. This scenario is supported by the strong daily ADX of 42.52, indicating a powerful downtrend is likely to resume.
Should I buy NZDUSD at current levels of $0.57192 given the mixed technical signals?
Buying at $0.57192 carries significant risk due to the dominant daily bearish trend. While the 1-hour chart shows bullish momentum (RSI 58.85), the daily RSI at 43.93 suggests weakness. A more prudent approach would be to wait for a confirmed break above $0.57325 or a clear rejection from resistance near $0.57266.
Is the RSI at 43.93 on the daily chart a sell signal for NZDUSD right now?
An RSI of 43.93 on the daily chart is not an immediate sell signal but indicates bearish momentum. It suggests that the downside has more room to run than the upside. This level, combined with the strong daily ADX, supports the view that rallies may be short-lived and bear market conditions prevail.
How will the strength of the US Dollar Index (DXY) at 99.71 affect NZDUSD this week?
The DXY's current level of 99.71 and its strong daily uptrend (ADX 29.76) act as a significant headwind for NZDUSD. Persistent dollar strength typically pressures pairs like NZDUSD, making it harder for the Kiwi to gain ground. Traders should monitor DXY closely, as continued strength could reinforce the bearish outlook for NZDUSD.
Technical Outlook Summary
| Indicator | Value | Signal | Interpretation |
|---|---|---|---|
| RSI (14) | 43.93 | Bearish | Daily RSI suggests downward momentum. |
| MACD Histogram | -0.003 | Bearish | Daily MACD shows negative momentum. |
| Stochastic | 33.19 / 22.13 | Bullish crossover in oversold | Daily Stochastic shows potential for a bounce. |
| ADX | 42.52 | Strong Downtrend | Confirms a powerful bearish trend on daily chart. |
| Bollinger | Middle Band | Watch | Price below middle band on daily, indicating bearish pressure. |
Key Levels
Support Levels
Resistance Levels
Track markets in real-time
AI-powered analysis, technical indicators and real-time price data.
Join Our Telegram Channel
Breaking market news, AI analysis and trading signals instantly.
Join Channel